



1 Introduction
Jet flows are an important member of the shear flow family (Crow & Champagne Reference Crow and Champagne1971; Yule Reference Yule1978; Hussain & Zaman Reference Hussain and Zaman1981; Petersen & Samet Reference Petersen and Samet1988). Whether they originate from axisymmetric or non-axisymmetric nozzles or orifices, they have both fundamental and practical significance, with rich flow phenomena (Matsuda & Sakakibara Reference Matsuda and Sakakibara2005; Bogey & Bailly Reference Bogey and Bailly2006; Kim & Choi Reference Kim and Choi2009; Ghasemi, Pereira & Li Reference Ghasemi, Pereira and Li2017). They are extensively involved in applications associated with mixing, heating/cooling, cleaning and combustion, etc., and require proper implementation of passive/active control strategies to suit the needs of the particular applications. One of the efficient passive control mechanisms is to issue the jet from non-circular openings of different shapes. Non-circular jets are practically beneficial due to their enhanced mixing, improved heat/mass transfer, and regulated noise levels (Ai et al. Reference Ai, Yu, Law and Chua2005; Mi & Nathan Reference Mi and Nathan2010; Gohil, Saha & Muralidhar Reference Gohil, Saha and Muralidhar2015); their different and richer dynamics also improve and expand our fundamental understanding of the mechanisms behind jet flows (Bejan, Ziaei & Lorente Reference Bejan, Ziaei and Lorente2014).
Flow dynamics of the non-circular jets in the near field to the developing regions are dominated by the three-dimensional perturbations arising from the so-called axis-switching phenomenon. Axis switching represents the shape change of the non-circular jets as the cross-section visually appears to rotate with the downstream distance. However, this conventional reference to axis switching as a rotational phenomenon should be replaced by the cross-sectional evolution towards more round shapes farther downstream. This phenomenon is initiated by the dynamics of the shedding of non-circular vortex rings and their evolution, and results in the cross-sectional deformation and the increased level of complexity compared to the axisymmetric shear layers (Ghasemi et al. Reference Ghasemi, Roussinova, Barron and Balachandar2016). Changing the nozzle shape produces different jet flow dynamics, which are often implemented to passively control jet flows (Gutmark & Grinstein Reference Gutmark and Grinstein1999). Further, axis switching is also influenced by the inlet flow conditions, such as momentum thickness, turbulence level and Reynolds number (Grinstein & Devore Reference Grinstein and Devore1996; Xu et al. Reference Xu, Pollard, Mi, Secretain and Sadeghi2013; Ghasemi et al. Reference Ghasemi, Roussinova, Balachandar and Barron2015). In the far field (developed region), non-circular jets evolve towards more axisymmetric cross-sections, in a way similar to that of circular jets.
Owing to the increased near-field three-dimensionality, non-circular jets develop a wider near field and have a larger spread rate compared to their round counterparts (Quinn & Militzer Reference Quinn and Militzer1988; Zaman Reference Zaman1999). As a result, non-circular jets entrain more ambient fluid into the jet core, enhancing the fluid mixing process (Krothapalli, Baganoff & Karamcheti Reference Krothapalli, Baganoff and Karamcheti1981; Ho & Gutmark Reference Ho and Gutmark1987; Zaman Reference Zaman1999; Hashiehbaf & Romano Reference Hashiehbaf and Romano2013). Further, non-circular jets experience increased instantaneous lateral oscillations involving the axis-switching phenomenon (Ghasemi, Roussinova & Balachandar Reference Ghasemi, Roussinova and Balachandar2013), leading to the occurrence of off-centre peaks in the time-averaged streamwise velocity profiles (Tsuchiya & Horikoshi Reference Tsuchiya and Horikoshi1986; Quinn & Militzer Reference Quinn and Militzer1988). This is uncommon for circular jets (unless due to the vena contracta effect (Mi et al. Reference Mi, Kalt, Nathan and Wong2007)). Similarly, high-aspect-ratio rectangular jets are known to demonstrate the saddle-back distribution of the time-averaged velocity (Vouros et al. Reference Vouros, Panidis, Pollard and Schwab2015). It is inferred that the time-averaged analysis of non-circular jets mainly reflects the outcomes of the axis switching rather than describing the underlying physics. In order to identify the governing mechanisms associated with the observed phenomena, the instantaneous vortex dynamics should be explored.
The Kelvin–Helmholtz (KH) instability produces vortex rings shed from the jets, whether of circular or non-circular cross-section (Hussain & Zaman Reference Hussain and Zaman1981; Grinstein Reference Grinstein2001). The dynamics and complexities of the vortex rings, however, are determined by the curvature of the rings imparted initially by the shape of the nozzle (Grinstein & Devore Reference Grinstein and Devore1996). The circular vortex rings have a uniform radius of curvature; the sharp corners of the rectangular/square rings attain a higher local curvature relative to their flat sides. The vortex rings travel with the advection velocity of the main flow, which is almost the same for the entire vortex rings, plus the additional self-induced velocity, which varies locally on the vortex rings, hence is responsible for the deformation and rich dynamics of the rings (Grinstein & Devore Reference Grinstein and Devore1996).
The additional self-induced velocity on the vortex rings is, based on the Biot–Savart law (see appendix A), proportional to the local curvature of the ring, the inverse of the vortex core radius and the vortex circulation (Saffman & Baker Reference Saffman and Baker1979; Saffman Reference Saffman1992; Margerit & Brancher Reference Margerit and Brancher2001); and hence it is higher near the high-curvature (sharp) regions of the non-circular vortex rings. As a result, the orientation of the non-circular vortex rings appears to be rotating around their streamwise axis (Callegari & Ting Reference Callegari and Ting1978; Grinstein Reference Grinstein2001; Margerit & Brancher Reference Margerit and Brancher2001). This is, however, merely a visual impression caused by the fascinating three-dimensionality of the ring deformations (Grinstein Reference Grinstein2001; Ghasemi et al. Reference Ghasemi, Roussinova, Barron and Balachandar2016). The curvature-induced vortex ring deformations initiate axis switching in the near field, and the interactions among the streamwise rib-shaped vortex loops, the corner hairpin vortices and the primary KH rings dominate the subsequent downstream dynamics (Grinstein & Devore Reference Grinstein and Devore1996; Ghasemi et al. Reference Ghasemi, Roussinova, Barron and Balachandar2016). The axis-switching phenomenon may be amplified or prevented by the upstream conditions, through changes in the formation of the streamwise vorticity (Zaman Reference Zaman1996; Towne et al. Reference Towne, Cavalieri, Jordan, Colonius, Schmidt, Jaunet and Brès2017). Consequently, single or multiple switching may take place until the ring attains a rather symmetric geometry and/or eventually breaks down into smaller scales.
In addition to the mechanism of the self-induced velocity, the axis switching of non-circular jets is theoretically related to the pressure distribution (Abramovich Reference Abramovich1982). Three instability modes for the pressure perturbations have been identified in rectangular jets (Tam & Thies Reference Tam and Thies1993); the first and the third modes relate to the pressure fluctuations at the corners, while the second governs the central region and is dominant over the other two modes with increasing downstream distance. The large-eddy simulation study by Ghasemi et al. (Reference Ghasemi, Roussinova, Barron and Balachandar2016) indicates that the corner pressure perturbations propagate towards the central region, and deform the initially two-dimensional ring into a three-dimensional shape; then after the axis switching, they flatten the ring and recover its two-dimensional character. These perturbation mechanisms are responsible for the enhanced small-scale entrainment, while the axis switching is responsible for the enhanced large-scale entrainment of the rectangular jets (Grinstein, Gutmark & Parr Reference Grinstein, Gutmark and Parr1995; Grinstein Reference Grinstein2001).
It is clear from the preceding literature review that the axis switching in non-circular jets is useful for enhanced entrainment and noise control. However, the majority of the experimental studies are described in terms of the time-averaged flow features, while some numerical simulations have attempted to explore the underlying physics by characterizing the instantaneous vortex dynamics (Grinstein et al.
Reference Grinstein, Gutmark and Parr1995; Grinstein & Devore Reference Grinstein and Devore1996; Grinstein Reference Grinstein2001; Ghasemi et al.
Reference Ghasemi, Roussinova, Barron and Balachandar2016). Capturing/quantifying the self-induced (curvature-induced) velocities experimentally is required to correlate them with the spatio-temporal dynamics of the vortical structures in non-circular jet flows. Therefore, the objective of the present study is to experimentally quantify the self-induced velocities due to the curvature variations on the vortex rings generated during the axis switching of a rectangular jet, with and without acoustic excitation. Phase-locked and conventional particle image velocimetry (PIV) measurements are conducted for a rectangular jet of aspect ratio 2 at Reynolds number
 $Re=UD_{h}/\unicode[STIX]{x1D708}=17\,750$
, where
 $U$
,
 $D_{h}$
and
 $\unicode[STIX]{x1D708}$
denote the centreline velocity at the nozzle exit, the hydraulic diameter and the kinematic viscosity. This condition is selected for in-depth characterization in the present study, because our recent study (Ghasemi, Tuna & Li Reference Ghasemi, Tuna and Li2018) investigated a wide range of flow conditions, equivalent to a Reynolds number of 1775 to 71 000, for double-peaking phenomena of the turbulence intensity in shear layers via competition between fluid rotation and shearing; during that study it was noticed that, at this flow condition, rich dynamic phenomena exist with relation to the curvature-induced velocities around the sharp corners of the rectangular rings. For active control, the flow is also acoustically actuated at the fundamental and subharmonic modes associated with the naturally evolving jet for different amplitudes. Acoustic control of the vortex ring generation, advection, self-induced deformations and axis switching are explored by the spatio-temporal tracking of the three-dimensional vortex structures.
2 Measurement procedure
2.1 Air flow tunnel
Measurements are carried out at the outlet of the air flow tunnel shown in figure 1(a). The blower fan forces the air flow through the circular inlet, which transitions into a rectangular cross-section. The air is then passed through the diffuser section. The conditioning section displays the space in which the honeycomb insert and a set of three wire screens are placed. After the
 $9:1$
smooth contraction region which reduces the turbulence intensity to less than 0.9 % and mean flow uniformity within 0.25 % inside the inviscid core, the air flow passes through the
 $L=300~\text{mm}$
duct and exits into the jet region from the rectangular opening with the dimensions of the side length
 $a=20~\text{mm}$
by the top edge
 $b=40~\text{mm}$
(figure 1
b). At the exit of the duct, the centreline velocity is maintained at
 $U=10~\text{m}~\text{s}^{-1}$
corresponding to the Reynolds number
 $Re=UD_{h}/\unicode[STIX]{x1D708}=17\,750$
, where
 $D_{h}=26.67~\text{mm}$
is the hydraulic diameter.
Air flow tunnel for producing the rectangular jet. The blower fan forces the air flow through the circular inlet, which transitions into the rectangular cross-section. The air is then passed through the diffuser section. The conditioning section displays the space in which the honeycomb insert and a set of three wire screens are placed. After the
 $9:1$
smooth contraction region, the air flow passes through the
 $L=300~\text{mm}$
duct and exits into the jet region from the rectangular opening with the dimensions of the side length
 $a=20~\text{mm}$
by the top edge
 $b=40~\text{mm}$
.

Boundary layer at the separation edge in the side view (
 $z/a=0$
) plane of the naturally developing jet. (a) The measured velocity (
 $u/U$
) matching the Blasius profile characterizes the laminar flow with the shape factor
 $H=\unicode[STIX]{x1D6FF}^{\ast }/\unicode[STIX]{x1D703}=2.59$
, where
 $\unicode[STIX]{x1D6FF}^{\ast }$
and
 $\unicode[STIX]{x1D703}$
denote the displacement and momentum thickness, respectively. (b) Streamwise turbulence intensity (
 $u_{rms}/U$
).

Experimental set-up for the PIV measurements: (a) top, (b) side, (c) cross-section and (d) isometric views of the rectangular duct, with the relative positioning of the camera, laser and the speaker. Sample mid-planes are illustrated for the top view (TV:
 $y/a=0$
) or the
 $x$
–
 $z$
plane, the side view (SV:
 $z/a=0$
) or the
 $x$
–
 $y$
plane, and the diagonal view (DV:
 $y/z=0.5$
) or the
 $x$
–
 $\unicode[STIX]{x1D701}$
plane.

It is important to mention the boundary layer characteristics at the separation edge. As shown in figure 2(a) in the SV (
 $z/a=0$
) plane, the measured velocity matches the Blasius profile with the shape factor
 $H=\unicode[STIX]{x1D6FF}^{\ast }/\unicode[STIX]{x1D703}=2.59$
, where
 $\unicode[STIX]{x1D6FF}^{\ast }$
and
 $\unicode[STIX]{x1D703}$
denote displacement and momentum thickness, respectively. The boundary layer velocity at the exit of the duct is characterized as laminar flow. The corresponding root-mean-square (r.m.s.) of the streamwise inlet velocity fluctuations is given in figure 2(b). It can be seen that the centreline turbulence intensity is less than 0.02 with a peak value of nearly 0.08 in the boundary layer which decays near the wall region.
2.2 Hot-wire anemometry and particle image velocimetry
Spatial distribution of the uncertainties associated with the PIV measurements of the streamwise (
 $\unicode[STIX]{x1D700}_{u}/U$
) and spanwise (
 $\unicode[STIX]{x1D700}_{v}/U$
) velocity components in the SV (
 $z/a=0$
) plane.

First, the hot-wire (HW) anemometry is conducted using an automatically traversed single probe oriented normal to the flow direction. A Dantec 55P11 straight general-purpose probe connected to a Dantec Streamline Constant Temperature Anemometry system is utilized to carry out the measurements. HW data are sampled at a 16 kHz frequency, producing a total number of
 $524\,288$
samples for the time period of
 $32.8$
s. Spectral analysis is conducted for the fluctuating velocity obtained from the HW at a frequency resolution of 0.03 Hz. After the HW, planar particle image velocimetry (PIV) is conducted with the origin of the coordinate system fixed at the channel exit
 $(x,y,z)=(0,0,0)$
in the centroid of the rectangular exit cross-section in the
 $y$
–
 $z$
plane. The
 $x$
-axis is oriented along the streamwise direction while the
 $y$
- and
 $z$
-axes stand normal to the longer (
 $b=40~\text{mm}$
) and shorter walls of the duct (
 $a=20~\text{mm}$
), respectively (figure 3). The main components of the system consist of a dual pulsed Nd:YAG laser producing an output of up to
 $70~\text{mJ}~\text{pulse}^{-1}$
, a
 $1600\times 1200$
pixel
 $14$
-bit Imager Pro X 2M charge-coupled device (CCD) camera, and a programmable timing system. The laser beam is generated by the combination of cylindrical and spherical lenses. The laser beam light sheet thickness at its waist is of the order of
 $1~\text{mm}$
.
The glycol–water based fog is produced to form the flow seeding particles at an average diameter of
 $3~\unicode[STIX]{x03BC}\text{m}$
. Care is taken to uniformly seed the flow at the outlet of the duct. The
 $60~\text{mm}$
fixed focal length lens and a 532 nm
 $\mp$
10 nm band-pass filter are used along with the camera. The camera and the laser pulse are synchronized by a timing control system using LaVision’s DaVis 8 software. The camera/laser set-ups optimized for the field of view (FOV) are translated together by using a set of servo-driven traverses to obtain various locations/orientations desired for the PIV. Images acquired in multiple
 $x$
–
 $y$
planes provide the SV information for two FOVs that are overlapped by 10 % and then stitched at various
 $z$
locations. Also, the
 $x$
–
 $z$
planes capture the top view (TV) flow field for the two FOVs that are also overlapped by 10 % and then stitched at different
 $y$
locations. In addition, PIV measurements are conducted in a DV (
 $y/z=0.5$
) or the
 $x$
–
 $\unicode[STIX]{x1D701}$
plane to provide a complete set of time-averaged data associated with the three-dimensionality of the rectangular jet. Accordingly, the above information obtained at the planar FOV spacing of
 $0.05a$
are interpolated to reconstruct the phase-averaged, three-dimensional flow field by using the phase-locked PIV measurement technique (Amitay, Tuna & Dell’Orso Reference Amitay, Tuna and Dell’Orso2016).
The jet is acoustically excited by a sub-woofer which is located at the outlet and near the longer edge of the rectangular opening (near the
 $y/a=-0.5$
edge). It is oriented normal to the TV or the
 $x$
–
 $z$
planes, as shown in figure 3(c), and the acoustic waves are emitted in the
 $y$
-axis direction. The sinusoidal excitation signal from the sub-woofer serves as a reference for the synchronized data acquisition in phase-locked PIV. The frequency–amplitude characteristics of the acoustic forcing signal are given in table 1 with the detailed information given in appendix B. It should be noted that sufficiently strong driving pressure (excitation amplitude) is required so that the flow behaviour (vortex shedding) synchronizes with the driving signal’s frequency and results in robust phase-locking measurements. After cropping the camera sensor to
 $960\times 1200$
pixels, each FOV for different views covers a
 $50~\text{mm}\times 39~\text{mm}$
(SV),
 $50~\text{mm}\times 39~\text{mm}$
(TV) or
 $62~\text{mm}\times 50~\text{mm}$
(DV) area. The velocity field calculations are conducted by cross-correlating pairs of successive images in LaVision’s DaVis 8 software. An advanced multi-pass technique is adopted, resulting in the initial and final correlation passes of
 $64\times 64$
pixels with 50 % overlap and
 $24\times 24$
pixels with 75 % overlap, respectively.
This also leads to the vector pitches of
 $0.246~\text{mm}$
(SV),
 $0.248~\text{mm}$
(TV) and
 $0.313~\text{mm}$
(DV) with camera pixel scale factors of
 $24.4$
,
 $24.2$
and
 $19.1~\text{pixels}~\text{mm}^{-1}$
for the side, top and diagonal views, respectively. Post-processing of the results is achieved by the universal outlier detection (Westerweel & Scarano Reference Westerweel and Scarano2005) and removal with vector replacement. Time-averaged quantities are obtained using 1000, 1500, 2000, 2500 and 3000 instantaneous image pairs acquired at a rate of 14.73 Hz; the
 $2000$
snapshots are found to be more than sufficient to provide the converged fields. The PIV random errors are estimated according to the particle image disparity method (Sciacchitano et al.
Reference Sciacchitano, Neal, Smith, Warner, Vlachos, Wieneke and Scarano2015), resulting in the corresponding average uncertainties evaluated to be less than 2 % within 95 % confidence in the core region of the jet. The local distribution of the uncertainties associated with the PIV measurements corresponding to the streamwise (
 $\unicode[STIX]{x1D700}_{u}/U$
) and spanwise (
 $\unicode[STIX]{x1D700}_{v}/U$
) velocity components in the SV (
 $z/a=0$
) plane are presented in figure 4. It can be seen that the higher uncertainty levels are evaluated within the shear layer region and found to be more significant for the spanwise (
 $\unicode[STIX]{x1D700}_{v}/U$
) velocity components.
2.3 Characterization of the fundamental and subharmonic frequencies used for the acoustic excitation
Streamwise velocity spectra obtained as the power spectral density (PSD) from the HW measurements along three lines parallel to the
 $x$
-axis for (
 $x/a=1$
, 1.5, 2, 2.25, 2.75, 3.5, 5.5 and 18.75): (a) centreline (along the
 $x$
-axis at
 $y/a=z/a=0$
); (b) long edge (along the
 $x$
-axis at
 $y/a=0.5,z/a=0$
); (c) short edge (along the
 $x$
-axis at
 $y/a=0,z/a=1$
).

As shown in figure 5, HW measurements of the streamwise velocity are used to obtain the spectra of the fluctuations at different locations of the naturally (NAT) evolving rectangular jet. The measurement points (
 $x/a=1,1.5,2,2.25,2.75,3.5,5.5$
and
 $18.75$
) are located along the three lines parallel to the
 $x$
-axis as the centreline (along the
 $x$
-axis at
 $y/a=z/a=0$
), the long edge line (along the
 $x$
-axis at
 $y/a=0.5,z/a=0$
) and the short edge line (along the
 $x$
-axis at
 $y/a=0,z/a=1$
). At
 $x/a=1$
, a broadband peak, typically seen in the near field of the shear layers, characterizes the fundamental frequency (
 $f_{n}=350~\text{Hz}$
). This fundamental mode, which is more distinguishable at the edges, is associated with the shear layer roll-up due to the initial KH instability.
The corresponding dimensionless frequency can be obtained in terms of the Strouhal number as
 $St_{a}=f_{n}a/U=0.7$
, or alternatively as
 $St_{h}=f_{n}D_{h}/U=0.93$
and
 $St_{e}=f_{n}D_{e}/U=1.12$
, where
 $D_{h}$
and
 $D_{e}$
are the hydraulic and equivalent diameters, respectively. The corresponding values for
 $D_{h}$
and
 $D_{e}$
can be calculated using
 $D_{h}=4ab/(2(a+b))$
and
 $D_{e}=\sqrt{(4ab/\unicode[STIX]{x03C0})}$
. The Strouhal numbers presented here are larger than that of round jets (0.3–0.7) reported by Ho & Nosseir (Reference Ho and Nosseir1981), Crow & Champagne (Reference Crow and Champagne1971) and Mi & Nathan (Reference Mi and Nathan2010). They rather conform to the values observed by Grinstein et al. (Reference Grinstein, Gutmark and Parr1995) and Mi & Nathan (Reference Mi and Nathan2010) for rectangular jets. The higher dominant frequencies in rectangular jets suggest a more unstable near field compared to circular jets, which can be attributed to the more complex vortex dynamics. Earlier studies on non-circular jets (Mi & Nathan Reference Mi and Nathan2010) report the shifting of the spectral dimensionless frequency (Strouhal number) of the fluctuations towards higher values. This suggests the increased presence of small-scale perturbations. Axisymmetric vortex rings are formed in circular jets due to the low-frequency KH instability transitioning from the linear to the nonlinear state. On the other hand, non-circular vortex rings experience additional modes of high-frequency instability due to the azimuthal perturbations resulting from curvature-induced instabilities.
The subharmonic mode (
 $f_{n}/2=175~\text{Hz}$
) is due to the vortex pairing farther downstream and modulates the initial KH instability through the feedback mechanism (Ho & Huang Reference Ho and Huang1982). The nonlinear effects first set in due to the transition of the initially linear KH instabilities. Afterwards, these nonlinear trends are intensified during the vortex pairing which results in the appearance of higher harmonic peaks in the spectra. The centreline spectra (
 $y/a=z/a=0,~x/a=1-18.75$
) portray both
 $f_{n}$
and
 $f_{n}/2$
frequencies of comparable energy content where the subharmonic dominates with downstream distance. The long (
 $y/a=0.5,~z/a=0$
) and short (
 $y/a=0,~z/a=1$
) edges initiate with a dominant
 $f_{n}$
frequency as well as higher harmonics and again the
 $f_{n}/2$
frequency prevails downstream. The higher harmonics are mostly detectable near the edges where the shear layer is present, while the corresponding peaks are not strong in the centreline spectra. Beyond
 $x/a=18.75$
, there is no frequency preference and the jet approaches a fully developed isotropic state. In this far-field region, small scales are ubiquitous and contribute to the enhanced mixing.
To verify the fundamental frequency (
 $f_{n}$
) and its subharmonic (
 $f_{n}/2$
) mode obtained above from the HW measurements, linear stability (LST) analysis is conducted (see appendix C for details). According to the hydrodynamic theory of stability, shear layers can be described by the interaction of the ensemble of propagating instability waves (Michalke Reference Michalke1972; Drazin & Reid Reference Drazin and Reid2004; Betchov Reference Betchov2012). The amplitudes corresponding to individual propagating instability modes, the wavelengths of which characterize the length scale of a particular flow structure, may amplify/fade while evolving in time/space. Such an interpretation becomes convenient by analysing the flow in the Fourier space rather than in the physical time/space. The present spatial LST predictions allow the perturbations to grow/decay in space and only advect in time without amplification/damping.
Spatial theory of the linear stability (LST) analysis obtained from the PIV. (a) Typical measured velocity profile versus the data fit at a given arbitrary axial location (for
 $0.25<x/a<1.25$
) and (b) its corresponding growth rate
 $(-\unicode[STIX]{x1D6FC}_{i})$
characterizing the fundamental frequency
 $(f_{n}=350~\text{Hz})$
. (c) Streamwise distribution of the growth rates associated with the different perturbation frequencies. (d) Streamwise variation of the growth rates associated with the fundamental
 $(f_{n})$
mode and its subharmonic
 $(f_{n}/2)$
frequency.

To this end, the method of least squares is implemented for the curve fitting (Dini, Seligt & Maughmert Reference Dini, Seligt and Maughmert1992) of the velocity profiles obtained from the PIV, with a typical representation shown in figure 6(a). It should be noted that figure 6(a) is just an arbitrary velocity profile obtained from PIV to demonstrate how the curve fitting is carried out. The velocity profiles are fitted to a hyperbolic tangent (tanh), which is the commonly used function in the spatial LST analysis (Monkewitz & Huerre Reference Monkewitz and Huerre1982). The Orr–Sommerfeld equation derived from introducing the normal-mode perturbations to the linearized incompressible Navier–Stokes equations (Schmid & Henningson Reference Schmid and Henningson2012) is then solved by implementing the Chebyshev polynomials for the spectral approximation of the eigenfunctions. The spatial LST provides the corresponding growth rates
 $(-\unicode[STIX]{x1D6FC}_{i})$
associated with a range of frequencies. For instance, the typical growth rate profile corresponding to the arbitrary velocity in figure 6(a) is presented in figure 6(b). Afterwards, figure 6(c) incorporates all the velocity profiles at several streamwise locations within the PIV field of view to obtain the colour map of the growth rates associated with the different frequencies as they change with downstream distance. The planar PIV data used for the LST calculations are taken in the near-exit region of the SV plane to verify the fundamental and subharmonic modes obtained from the HW.
The growth rate associated with the fundamental frequency (
 $f_{n}=350~\text{Hz}$
) is found to be dominant (figure 6
b) for this particular location. Similar information is reproduced for all the streamwise locations and presented as a contour plot in figure 6(c). The near-exit colour map shows that the strength of the fundamental mode shifts towards lower frequencies with the downstream distance and fades eventually. Beyond certain downstream locations where the nonlinear perturbations set in, the linear assumption deteriorates. For a direct comparison, the streamwise variation of the growth rates identifying the fundamental (
 $f_{n}$
) mode and its subharmonic (
 $f_{n}/2$
) are presented in figure 6(d). The fundamental mode is dominant in the near-exit region where the KH instabilities tend to roll up the shear layer. With increased downstream distance, the subharmonic effects dominate as the local passage frequency of the vortices is reduced due to the smaller self-induced velocity of the vortices. Care must be taken when discussing the subharmonic frequency in the context of the linear stability theory. The subharmonic frequency appears because of vortex pairing, which is a nonlinear mechanism. This is inferred from our streamwise velocity spectra obtained as the power spectral density (PSD) from HW measurements. Even though such a similar conclusion may not be directly drawn from the linear theory of stability, some underlying physics can be justified. The vortex pairing phenomenon occurs due to the deceleration of the vortex as a result of the smaller self-induced velocities associated with the larger core radius. Consequently, the upstream vortices which move faster may catch up with the downstream cores. Even before the pairing occurs, the reduced velocity of the vortices with the downstream distance reduces their passage frequency. This may explain why the LST results reveal a shift towards lower frequencies with downstream distance even before the linear assumption deteriorates.
The modes
 $f_{n}$
and
 $f_{n}/2$
, respectively referred to as the high (HF) and low (LF) frequencies, are used to acoustically force the jet at low (LA), mid- (MA) and high (HA) amplitudes. The characteristics of the excitation amplitudes and the corresponding sound pressure levels (SPLs) are presented in table 1, with the detailed descriptions given in appendix B. The objective is to specify a reference signal for the phase-locked PIV measurement as well as investigating the effect of the acoustic excitation on the jet characteristics. For instance, the jet excited at the
 $f_{n}$
frequency and mid-amplitude is referred to as HFMA. The natural/unperturbed case (NAT) is characterized by the SPL of 76.3 and 91.2 dB at the centre of the channel exit when the tunnel air flow is OFF or ON, respectively. The effect of the acoustic excitation is characterized as 79.1 dB (LA), 88.1 dB (MA) and 95.5 dB (HA) at the same location when the tunnel air flow is OFF. Based on these, each case can be described as shown in table 1 by adding the free-stream SPL to the acoustic excitation level (see appendix B).
3 Results and discussion
First, the qualitative representation of the rectangular jet cross-sectional evolution is described as an overview of the overall flow behaviour. Afterwards, the flow characteristics obtained from the pointwise HW and the planar PIV measurements are presented to provide interpretations for the time-averaged behaviours resulting from axis switching as well as acoustic forcing. Finally, the three-dimensional vortex dynamics are focused on the identification of the curvature-induced velocity of the vortex rings to shed more light on the instantaneous dynamics causing the time-averaged observations.
Schematic definition of the axis switching in isolated vortex rings versus rectangular jets. For isolated rectangular vortex rings, axis switching is accomplished when the ring appears to be rotated for
 $90^{\circ }$
around its streamwise axis, while the initial rectangular shear layer of the jet may mildly reshape towards rounder cross-sections.

3.1 Qualitative description of axis switching in rectangular jets and isolated vortex rings
Before presenting the actual data, figure 7 provides a schematic description of the differences between the ‘axis switching’ of rectangular jets and isolated vortex rings. Even though the present study is focused on rectangular jets and not on isolated vortex rings, it is important to define the axis-switching phenomenon for both cases and explain the differences. While the cause of axis switching for both cases is the self-induced vortex ring deformations, the outcomes are different for isolated rings and continuous jets. For isolated rectangular vortex rings, axis switching is traditionally defined when the ring rotates for
 $90^{\circ }$
around its streamwise axis. We emphasize that this is merely a visual observation; hence the present study suggests that a definition based on deformation/reshaping is more appropriate. On the other hand, neighbouring vortex rings interacting within the initially rectangular shear layers (jets) do not demonstrate this apparent
 $90^{\circ }$
rotation. Instead, the diagonal width contracts while the SV and TV planes mildly expand at different rates and result in the cross-sectional reshaping from rectangular to more round geometries.
The phase-averaged streamwise velocity displayed in figure 8, qualitatively describes the cross-sectional evolution of the rectangular jet. The cross-sectional planes are obtained from the interpolation of the phase-locked measurements in multiple SV planes. The first observation is the rectangular cross-section of the jet in the near field at
 $x/a=0.7$
. The edges show a slower velocity as they are subjected to the low-speed ambient, while the central region forms the high-velocity potential core. Farther downstream at
 $x/a=1.5$
, the jet boundaries become more distorted. While the SV
 $x$
–
 $y$
plane expands with downstream distance, the DV span shrinks. Eventually, at
 $x/a=3.9$
, the jet cross-section evolves into rather elliptic/circular shapes due to axis switching. The relevant underlying physics governing the axis-switching phenomenon is described in the following sections by exploring the spatio-temporal vortex dynamics. It should be noted that the shifted high-velocity regions at
 $x/a=1.5$
and
 $2.3$
are due to the directional effect of the acoustic excitation on the tilting of the vortex rings, as discussed later in figures 16 and 17. In addition, beyond
 $x/a=3.1$
the jet core starts to bifurcate into a pair of high-speed zones which are commonly observed in elliptic (Hussain & Husain Reference Hussain and Husain1989) and rectangular (Grinstein Reference Grinstein2001) jets.
Phase-averaged streamwise velocity in the cross-sectional views (
 $y$
–
 $z$
planes at
 $x/a=0.7$
, 1.5, 2.3, 3.1 and 3.9) of the rectangular jet acoustically actuated at high frequency and high amplitude (HFHA).

3.2 Jet evolution along the centreline and the higher-order moments
HW measurements along the jet centreline (along the
 $x$
-axis at
 $y/a=z/a=0$
). (a) Time-averaged streamwise velocity (
 $u$
). (b) R.m.s. of the streamwise velocity fluctuations
 $(u_{rms})$
. (c) Skewness of the streamwise velocity fluctuations
 $(S_{u})$
. (d) Kurtosis of the streamwise velocity fluctuations
 $(K_{u})$
.

In figure 9, HW data are presented along the jet centreline (
 $y/a=z/a=0$
) for different acoustic excitations (LFLA, LFHA, HFLA, HFMA HFHA, NAT). The shaded band regions overlaid on the line plots are associated with the uncertainty levels of the HW. As seen in figure 9(a), the time-averaged streamwise velocity decays (when
 $u/U<0.98$
) after the potential (unmixed) core
 $x/a=2.5{-}3$
(or
 $x/D_{h}=1.9{-}2.25$
). Similar to non-circular jets of different shapes (
 $x/D_{h}=1{-}3.5$
), the present rectangular jet develops a shorter potential core compared to the round jets issued from the smooth contraction nozzles (
 $x/D_{h}=5.5$
) and orifice plates (
 $x/D_{h}=4$
) (Mi & Nathan Reference Mi and Nathan2010). This is a consequence of the axis switching which results in enhanced entrainment of the ambient fluid as well as the earlier shear layer merging/breakdown (Grinstein Reference Grinstein2001). The subharmonic (LF) forcing at high amplitude (HA), or the LFHA case, which is known to promote vortex pairing (Ghasemi et al.
Reference Ghasemi, Tuna and Li2018), results in the shortest potential core length. Therefore, in the fully developed region of the jet where the velocity profiles are self-similar, the larger spreading rate implies a higher rate of entrainment.
The r.m.s. of the streamwise velocity fluctuations (
 $u_{rms}$
) in the natural case, shown in figure 9(b), develops an overshoot due to the wobbling of the large-scale structures, which fades away after the potential core breakdown. This ‘wobbling’ is associated with the unsteady fluctuations of the large scales mostly taking place in the lateral direction due to the vortex pairing and breakdown which result in the lateral expansion of the jet near the end of the potential core. In addition, they are correlated with increased local anisotropy and intermittency. Mi & Nathan (Reference Mi and Nathan2010) suggest that the overshoot (hump) after the linear increase of
 $u_{rms}$
does not occur for the circular, square, cross- and star-shaped jets which have an aspect ratio of one. On the other hand, the overshoot is observed in triangular, rectangular and elliptic jets. For both the fundamental and subharmonic frequencies, increasing the excitation amplitude weakens the overshoot. The centreline
 $u_{rms}$
overshoot disappears completely for the subharmonic LFHA case.
The higher-order moments of the statistics are presented in terms of the skewness (
 $S_{u}$
) and kurtosis (
 $K_{u}$
) of the streamwise velocity fluctuations in figure 9(c) and (d), respectively. The typical values of the skewness (
 $S_{u}=0$
) and kurtosis (
 $K_{u}=3$
) characterize a normal Gaussian distribution of the statistics and hence are associated with the isotropic fluctuations. For round jets, the centreline (
 $S_{u}=0$
) and (
 $K_{u}=3$
) demonstrates an isotropic state in the near-exit and far-field regions while they deviate from these values near the end of the potential core. It should be noted that the far-field skewness and kurtosis approach isotropy, but never attain the exact isotropic values. This continually occurs by the small-scale entrainment mechanisms nibbling the non-turbulent patches of the fluid into the far-field jet. Conversely, the large-scale entrainment mechanisms, such as engulfment and flow induction in the near field, eventually result in the shear layer merging and vortex breakdown at the end of the potential core and hence intensify the anisotropy. As also seen here, for non-circular jets the anisotropic values start before the end of the potential core due to axis switching (Mi & Nathan Reference Mi and Nathan2010; Ghasemi et al.
Reference Ghasemi, Roussinova, Barron and Balachandar2016).
The negative skewness in the time signal implies the dominance of values smaller than the mean compared to the larger ones. Also, the large values of the kurtosis are an indication of the higher probability of finding large peaks (either smaller or larger than the mean) in the time signal, which are associated with elevated intermittency (Frisch Reference Frisch1995) levels replacing the orderly oscillations. The large value of the kurtosis at the end of the potential core suggests the intermittent nature of the flow due to the shear layer merging and vortex breakdown. In addition, the negative skewness can be associated with the interference of the slower vortical structures abruptly entrained inwards (Bogey, Bailly & Juvé Reference Bogey, Bailly and Juvé2003; Bogey & Bailly Reference Bogey and Bailly2007). Acoustic excitation is found to increase the intermittency level and broaden its region of effectiveness. The high-amplitude (HA) subharmonic excitation (LF), which develops the shortest length of the potential core, demonstrates earlier intermittency generation. The positive skewness observed near the exit can be associated with the local curvature-induced velocities of the perturbed corners of the rectangular vortex ring increasing the occurrence of fluctuations larger than the mean value.
PIV measurements along the jet centreline (along the
 $x$
-axis at
 $y/a=z/a=0$
). (a) Time-averaged streamwise velocity (
 $u$
). (b) R.m.s. of the spanwise velocity fluctuations
 $(v_{rms})$
in the SV (
 $z/a=0$
) or the
 $x$
–
 $y$
plane. (c) R.m.s. of the streamwise velocity fluctuations
 $(u_{rms})$
. (d) R.m.s. of the transverse velocity fluctuations
 $(w_{rms})$
in the TV (
 $y/a=0$
) or the
 $x$
–
 $z$
plane.

Time-averaged PIV measurements for the natural (NAT) or unexcited jet. Streamwise velocity (a–c) and plane-normal vorticity (d–f) in the SV (
 $z/a=0$
) or the
 $x$
–
 $y$
plane, TV (
 $y/a=0$
) or the
 $x$
–
 $z$
plane, and DV (
 $y/z=0.5$
) or the
 $x$
–
 $\unicode[STIX]{x1D701}$
plane.
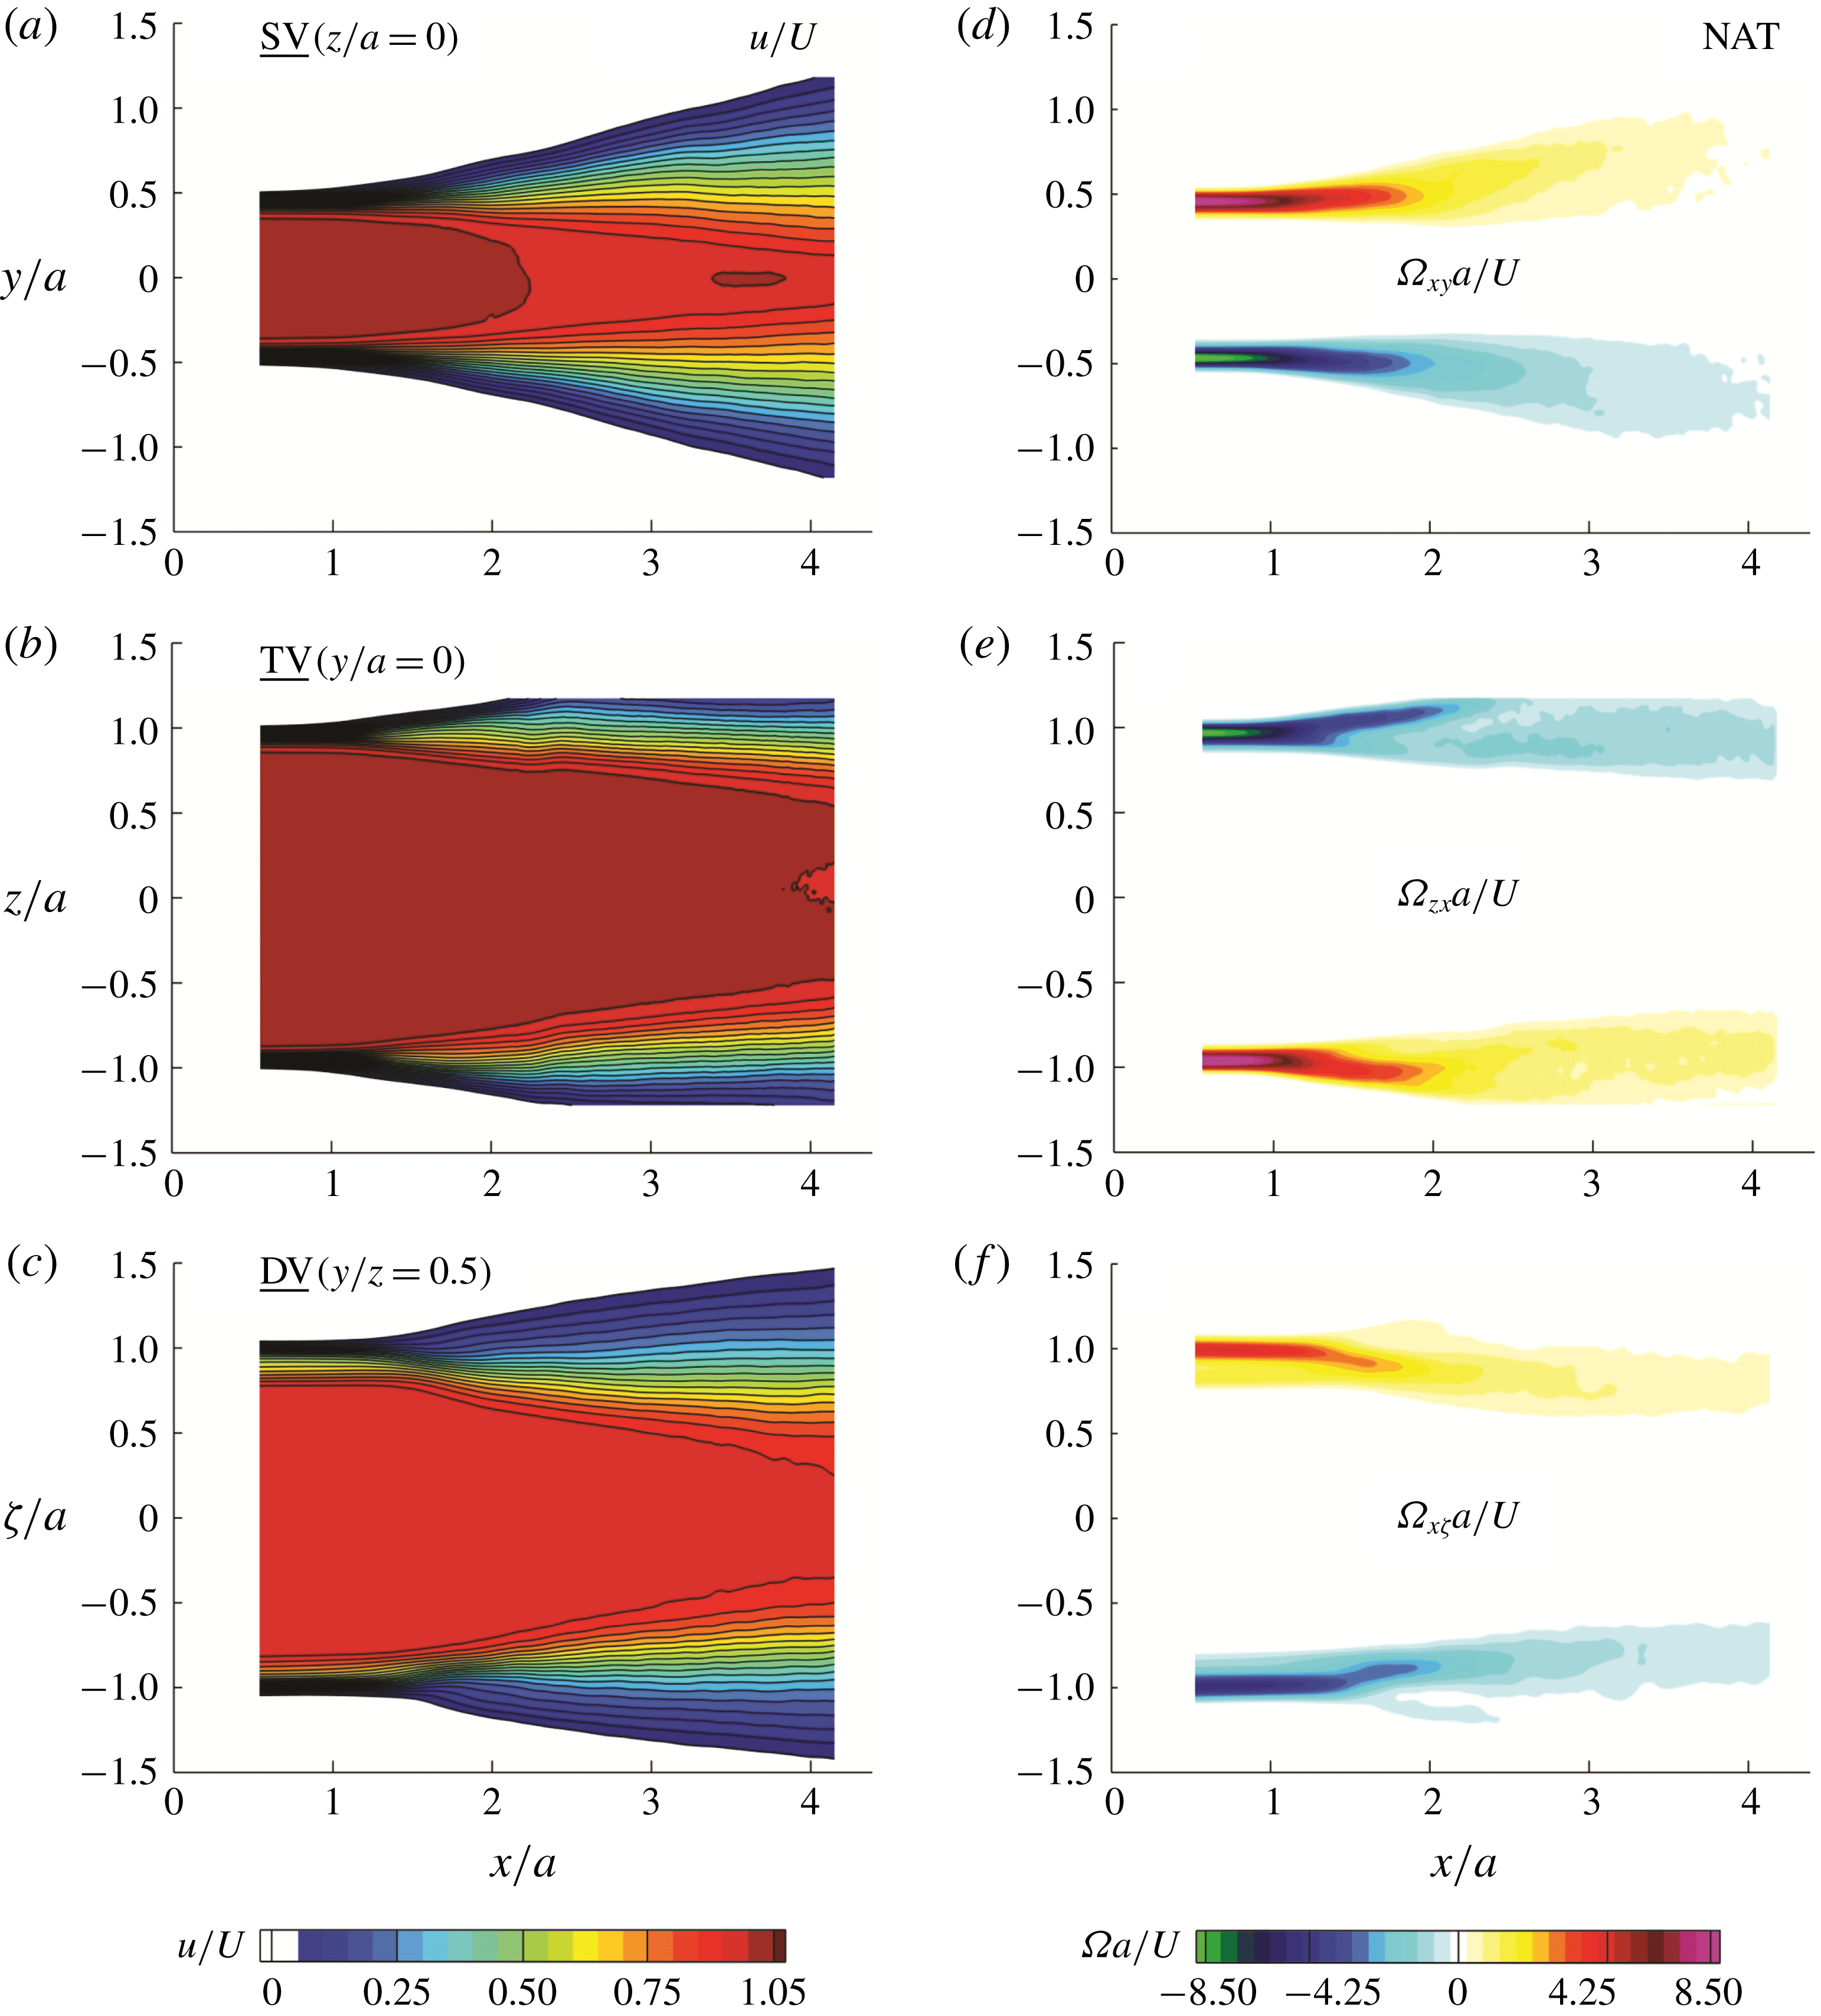
The centreline
 $u/U$
and
 $u_{rms}$
from the PIV (lines) nicely align with the HW (symbols) in figure 10. In addition, the transverse and spanwise velocity fluctuations (
 $v_{rms}$
and
 $w_{rms}$
) in the
 $y$
- and
 $z$
-directions, respectively, presented in figure 10(b,d), reveal interesting information. While the centreline variation of
 $v_{rms}$
is significantly augmented under the acoustic excitation, the
 $w_{rms}$
is not strongly affected. This observation reveals the directional effectiveness of the acoustic waves being emitted in the
 $y$
-direction aligned with the
 $v_{rms}$
. Further, the subharmonic (LFHA) excitation is found to intensify the spanwise velocity fluctuations while it decreases the streamwise component. This is a justifiable observation as the subharmonic forcing is suggested (Ghasemi et al.
Reference Ghasemi, Tuna and Li2018) to enhance the vortex pairing and results in the lateral expansion of the jet.
3.3 Time-averaged flow field in the side, top and diagonal views
The mean velocity (
 $u/U$
) and the vorticity (
 $\unicode[STIX]{x1D6FA}=\unicode[STIX]{x1D6FA}_{xy},\unicode[STIX]{x1D6FA}_{zy},\unicode[STIX]{x1D6FA}_{x\unicode[STIX]{x1D701}}$
) component normal to each plane of view (SV, TV or DV in figure 3
d) obtained from the PIV are respectively presented in figure 11(a–f) for the naturally developing jet (NAT). Out of the multiple FOVs, one sample mid-plane is illustrated in figure 3(d) for each of the SV (the
 $x$
–
 $y$
plane at
 $z/a=0$
), TV (the
 $x$
–
 $z$
plane at
 $y/a=0$
) and DV (the
 $x$
–
 $\unicode[STIX]{x1D701}$
plane at
 $y/z=0.5$
) views. If otherwise the SV (the
 $x$
–
 $y$
plane at
 $z/a=1$
) and TV (the
 $x$
–
 $z$
plane at
 $y/a=0.5$
) views are shifted to the edges of the jet, it is stated in the figure captions as well as the text. The high velocity near the centreline describes the potential core while the jet is decelerated near the edges as shown in figure 11(a–c). While the vorticity is negligible inside the potential core, the largest values occur near the edges subjected to the low-speed ambient (figure 11
d–f). The opposite signs of the vorticity on either side of the jet describe the sense of rotation of the passing vortices. This sense of rotation describes the roll-up of the shear layer from the high-speed side (potential core) towards the low-speed side (ambient fluid). Therefore, the near-field vorticity field describes the time-averaged evolution of the shear layer in different planar views. In the SV plane (figure 11
d), the shear layer clearly grows in thickness and expands outwards. On the other hand, the shear layers go through a contraction in the DV plane as seen in figure 11(e). The TV shear layers start with an expansion, which declines with the downstream distance. These differences in the relative evolution of the shear layers in the SV, TV and DV planes are the outcomes of the instantaneous vortex dynamics during the axis switching reflected in the time-averaged flow fields (Grinstein & Devore Reference Grinstein and Devore1996; Grinstein Reference Grinstein2001; Ghasemi et al.
Reference Ghasemi, Roussinova, Barron and Balachandar2016).
In figures 12–14, the line plots obtained from the PIV measurements are extracted at different streamwise locations (
 $x/a=1,2,3$
) in the SV, TV and DV planes for the NAT, LFLA, LFHA, HFLA, HFMA and HFHA excitations. The traverse origins of the profiles are shifted to the local in-plane half-width of the jet (
 $y_{0.5},z_{0.5},\unicode[STIX]{x1D701}_{0.5}$
). The half-width values at each streamwise location in the corresponding planes of view are defined as the lateral locations at which the local velocity is 50 % of the centreline value. In figure 12(a,d,g), the
 $u$
profiles start with a rather top-hat shape at
 $x/a=1$
and almost maintain the incoming laminar boundary layer characteristics at the separation edge. The half-width locations (
 $y-y_{0.5}=z-z_{0.5}=\unicode[STIX]{x1D701}-\unicode[STIX]{x1D701}_{0.5}=0$
) approximately coincide with the inflection point in the velocity profiles which can be interpreted as the location of the critical layer in the shearing region. The presence of the inflection point in the velocity profiles suggests that the flow is prone to the onset of the instabilities. According to ‘Rayleigh’s inflection-point theorem’, a necessary condition for the instability is the presence of an inflection point in the base flow velocity profile (Drazin & Reid Reference Drazin and Reid2004). Even if the boundary layer profile at the separation edge does not have an inflection point, it appears eventually due to the shear layer instability.
Interestingly, the velocity profiles located in the diagonal plane (figure 12
g) demonstrate an extra inflection point indicating an additional destabilizing mode near the corners of the jet. This observation further motivates the following sections in a search for the peculiar phenomena taking place at the high-curvature corners of the jet. Farther downstream, the streamwise velocity profiles evolve into rather Gaussian shapes with a tendency towards a fully developed distribution (Quinn & Militzer Reference Quinn and Militzer1988; Grinstein & Devore Reference Grinstein and Devore1996; Grinstein Reference Grinstein2001; Ghasemi et al.
Reference Ghasemi, Roussinova, Barron and Balachandar2016). This is in accordance with the jet expansion due to the increased entrainment with the downstream distance. As can be seen, the acoustic forcing does not result in the significant variation of the time-averaged streamwise velocity. However, there is a minor effect at
 $x/a=1$
where forcing the jet at the fundamental frequency (HFHA) results in the slightly more developed velocity profile in the SV plane (figure 12
a). At
 $x/a=2$
and
 $3$
, the subharmonic excitation (LFHA) results in an advanced development in the SV and DV planes while the TV view shows a delayed evolution.
Time-averaged streamwise velocity (
 $u$
) measured by the PIV for the NAT, LFLA, LFHA, HFLA, HFMA and HFHA excitations: (a–c) SV (
 $z/a=0$
) or the
 $x$
–
 $y$
plane, (d–f) TV (
 $y/a=0$
) or the
 $x$
–
 $z$
plane, and (g–i) DV (
 $y/z=0.5$
) or the
 $x$
–
 $\unicode[STIX]{x1D701}$
plane.

R.m.s. of the streamwise velocity fluctuations
 $u_{rms}$
measured by the PIV for the NAT, LFLA, LFHA, HFLA, HFMA and HFHA excitations: (a–c) SV (
 $z/a=0$
) or the
 $x$
–
 $y$
plane, (d–f) TV (
 $y/a=0$
) or the
 $x$
–
 $z$
plane, and (g–i) DV (
 $y/z=0.5$
) or the
 $x$
–
 $\unicode[STIX]{x1D701}$
plane.

R.m.s. of the spanwise velocity fluctuations (
 $v_{rms}$
,
 $w_{rms}$
,
 $\unicode[STIX]{x1D702}_{rms}$
) measured by the PIV for the NAT, LFLA, LFHA, HFLA, HFMA and HFHA excitations: (a–c) SV (
 $z/a=0$
) or the
 $x$
–
 $y$
plane, (d–f) TV (
 $y/a=0$
) or the
 $x$
–
 $z$
plane, and (g–i) DV (
 $y/z=0.5$
) or the
 $x$
–
 $\unicode[STIX]{x1D701}$
plane.

The PIV data for the lateral variation of
 $u_{rms}$
are presented in figure 13 in the SV (a–c), TV (d–f) and DV (g–i) planes for the NAT, LFLA, LFHA, HFLA, HFMA and HFHA excitations at
 $x/a=1$
, 2 and 3. The
 $u_{rms}$
attains high values within the shear layer region due to the fluctuating motion of the large-scale vortical structures. The fluctuations decrease towards the outer low-speed flow as well as within the potential core. At
 $x/a=1$
, the double-peaked
 $u_{rms}$
profiles are observed with a major peak near the high-speed side and a minor one located towards the low-speed region (figure 13
a,d,g). This peculiar double peaking of the
 $u_{rms}$
appears as a result of the shear/rotation counteractions due to the interaction of the fundamental and subharmonic modes as elaborated by Ghasemi et al. (Reference Ghasemi, Tuna and Li2018). The fundamental mode is associated with the shear layer roll-up due to the KH instability which produces the vortex rings. Farther downstream, the vortex rings tend to merge where the subharmonic mode dominates. At
 $x/a=1$
, the double peak is more evident in the SV plane (figure 13
a) and it transitions to a single one with downstream distance (
 $x/a=2$
and 3). Especially in the SV plane, the acoustic excitation at the fundamental frequency (HFHA) amplifies the minor peak which is located near the low-speed side. This is because the HFHA excitation causes the more upstream occurrence of the KH roll-ups which tend to lean outside towards the low-speed ambient (Ghasemi et al.
Reference Ghasemi, Tuna and Li2018). On the other hand, the major peak on the high-speed side is augmented under the subharmonic excitation which is found to contract more vortices inwards due to enhanced vortex pairing (Ghasemi et al.
Reference Ghasemi, Tuna and Li2018). The r.m.s. profiles laterally expand with downstream distance. This is in accordance with the growth of the vortical structures and the consequent thickening of the shear layer due to the viscous diffusion.
In figure 14, the lateral variation of the spanwise velocity fluctuations corresponding to the SV (a–c), TV (d–f) and DV (g–i) planes are presented as
 $v_{rms}$
,
 $w_{rms}$
and
 $\unicode[STIX]{x1D702}_{rms}$
, respectively. At
 $x/a=1$
, the peaks of the spanwise fluctuations are augmented proportional to the forcing amplitude of the fundamental mode (HFHA, HFMA) in the SV (figure 14
a), TV (figure 14
d) and DV (figure 14
g) planes. This occurs due to the advanced upstream location of the KH roll-ups which laterally undulate the shear layer. It should be noted that the effect of the subharmonic forcing is not significant at
 $x/a=1$
since this region is dominated by the KH instability and the shear layer roll-ups. On the other hand, at
 $x/a=2$
where the subharmonic (LFHA) excitation enhances the vortex pairing (Ghasemi et al.
Reference Ghasemi, Tuna and Li2018), the r.m.s. peak of the spanwise velocity fluctuations tends to become stronger. Eventually, the peak of the spanwise velocity fluctuations associated with the subharmonic forcing dominates at
 $x/a=3$
. In parallel with the aforementioned observations (figure 10) for the centreline values, the spanwise fluctuations are stronger in the SV plane due to the fact that the acoustic source emits along the
 $y$
-axis which is aligned with the direction of
 $v_{rms}$
.
3.4 Axis switching and vortex dynamics under various acoustic forcing
According to the schematic definition given in figure 7, the outward expansion and the inward contraction of the velocity/vorticity fields observed in different planes of view describe the axis-switching phenomenon. In order to quantify the streamwise locations within which the axis switching is initiated and completed, the relative expansion/contractions among different planar fields are determined. To this end, the streamwise evolution of the spanwise locations (
 $y_{\unicode[STIX]{x1D6FA}_{max}},z_{\unicode[STIX]{x1D6FA}_{max}},\unicode[STIX]{x1D701}_{\unicode[STIX]{x1D6FA}_{max}}$
) at which the maximum vorticity occurs in the shear layer are detected. The obtained locations for the SV (
 $y_{\unicode[STIX]{x1D6FA}_{max}}$
), TV (
 $z_{\unicode[STIX]{x1D6FA}_{max}}$
) and DV (
 $\unicode[STIX]{x1D701}_{\unicode[STIX]{x1D6FA}_{max}}$
) planes are shown in figure 15 for the NAT, LFLA, LFHA, HFLA, HFMA and HFHA excitations. It should be noted that these locations are normalized by their corresponding near-exit values (
 $y_{\unicode[STIX]{x1D6FA}_{max,0}},z_{\unicode[STIX]{x1D6FA}_{max,0}},\unicode[STIX]{x1D701}_{\unicode[STIX]{x1D6FA}_{max,0}}$
) so that they all start from unity. Therefore, in all the cases the peak vorticity location remains constant (unity) almost up to the downstream location
 $x/a=1$
. This implies that the shear layers neither expand nor contract from their original positions located near the edges. Then, beyond a certain downstream distance, the locations of the peak vorticity in the DV drops below unity, meaning that the shear layer is contracting in this plane.
Streamwise evolution of the traverse locations of the maximum vorticity (
 $y_{\unicode[STIX]{x1D6FA}_{max}}$
,
 $z_{\unicode[STIX]{x1D6FA}_{max}}$
,
 $\unicode[STIX]{x1D701}_{\unicode[STIX]{x1D6FA}_{max}}$
) respectively shown in the SV (
 $z/a=0$
) or the
 $x$
–
 $y$
plane, the TV (
 $y/a=0$
) or the
 $x$
–
 $z$
plane and the DV (
 $y/z=0.5$
) or the
 $x$
–
 $\unicode[STIX]{x1D701}$
plane: (a) NAT, (b) HFLA, (c) LFLA, (d) HFMA, (e) LFHA and (f) HFHA excitations.

Isosurfaces of the instantaneous
 $Q_{p}$
-criterion during the phases (
 $\unicode[STIX]{x1D719}=0^{\circ },120^{\circ },240^{\circ }$
) for the acoustic forcing at HFHA. Vortical structures are coloured by the vorticity component corresponding to the roll-up sense of rotation. See supplementary movie 1 available at https://doi.org/10.1017/jfm.2018.988, together with movie 2 which shows forcing at HFMA for comparison.

Sample SV (
 $z/a=0$
) instantaneous snapshots of the vorticity (
 $\unicode[STIX]{x1D6FA}_{xy}a/U$
) and the
 $Q$
-criterion to compare the symmetric and non-symmetric (tilted) vortex shedding for the natural and the acoustically forced (HFHA) jets, respectively. The side near the acoustic source demonstrates roll-up and vortex shedding at more upstream locations compared to the farther shear layer.

On the other hand, the SV and TV planes show an increase to larger than unity characterizing the outward expansion of the shear layer. This characterizes the region within which the first axis switching is started between the DV plane with respect to the SV and TV views. The first axis switching is known to occur mostly due to the self-induced deformation of the initially non-circular (rectangular here) KH vortex rings (Grinstein & Devore Reference Grinstein and Devore1996; Ghasemi et al. Reference Ghasemi, Roussinova, Barron and Balachandar2016). Even though weaker, a second axis switching may be characterized between the SV and TV planes by the cross-over observed in the peak vorticity locations. This weak cross-over means that one side of the jet becomes slightly wider than the other one (Grinstein & Devore Reference Grinstein and Devore1996; Ghasemi et al. Reference Ghasemi, Roussinova, Barron and Balachandar2016). This second axis switching is known to be associated with the interaction of the primary KH vortex ring with the secondary streamwise vortex loops as well as the corner hairpin vortices (Grinstein & Devore Reference Grinstein and Devore1996; Ghasemi et al. Reference Ghasemi, Roussinova, Barron and Balachandar2016).
The expansions/contractions in different view planes and the consequent axis-switching characteristics are not significantly influenced under the low-amplitude (LFLA and HFLA) excitations. However, the streamwise locations of the second axis switching observed in figure 15(b,c) are slightly advanced. Under the subharmonic excitation (LF) at high amplitude (HA), the expansion rate in the SV is decreased while it is increased in the TV plane. In addition, the contraction of the DV plane is somewhat enhanced. Unlike the subharmonic, the fundamental excitation (HF) increases the expansion in the SV with respect to the TV. Furthermore, increasing the amplitude of the HF excitation results in the faster contraction in the DV plane. Therefore, increasing the excitation amplitude from LA to HA at the fundamental (HF) frequency advances the location of the first axis switching by earlier expansion of the SV shear layer and the contraction in the DV plane. On the other hand, it postpones the second axis switching by delaying the expansion of the TV plane.
The above discussed jet dynamics reflected into the time-averaged flow features are associated with axis switching. Instantaneously, the axis-switching phenomenon is initiated by the deformations of the non-circular (e.g. rectangular) vortex rings due to the self-induced velocity (Callegari & Ting Reference Callegari and Ting1978; Grinstein Reference Grinstein2001; Margerit & Brancher Reference Margerit and Brancher2001; Ghasemi et al.
Reference Ghasemi, Roussinova, Barron and Balachandar2016). To further investigate the governing mechanisms of the axis switching in rectangular jets, the spatio-temporal dynamics of the initially rectangular ring needs to be explored. To this end, planar phase-locked PIV conducted in multiple SV and TV planes are interpolated into the volumetric structures constructing the three-dimensional vortical structures. The
 $Q_{p}$
-criterion (Jeong & Hussain Reference Jeong and Hussain1995) is calculated to identify the vortex cores where the second invariant (
 $Q$
) of the velocity gradient tensor is positive. For instance, the isosurfaces of the instantaneous
 $Q_{p}$
-criterion are presented in figure 16 to visualize the three-dimensional vortical structures during the phases of HFHA excitation. The vortex loops constructing each of the four sides of the rectangular ring are coloured by the vorticity component which characterizes their roll-up sense of rotation. The volumes are presented for the three phases of
 $\unicode[STIX]{x1D719}=0^{\circ },120^{\circ },240^{\circ }$
during the period of acoustic excitation. Three viewpoints are presented for each phase. The SV is located at the upper-left corner and the cross-sectional view in the lower-right corner. The middle large volume is then viewed at an angle best illustrating the three-dimensional structures.
In the spatial point of view, the rectangular vortex ring of figure 16 is formed due to the KH instability in the near-exit region. With increased downstream distance, the originally rectangular shape turns into the more distorted geometry. Any given point on the vortex ring moves by the advection velocity of the main flow as well as the local self-induced velocity (Saffman & Baker Reference Saffman and Baker1979; Saffman Reference Saffman1992). The self-induced velocity is related to the local curvature at that point, the inverse of the vortex core radius and the local circulation (Saffman & Baker Reference Saffman and Baker1979; Saffman Reference Saffman1992). The major factor for the self-induced velocity of the rectangular vortex rings is the presence of the sharp corners. Therefore, the additional curvature-induced velocity on top of the convective velocity of the vortex ring generates the local acceleration at the corners with respect to the flat sides.
According to the Biot–Savart law (Margerit & Brancher Reference Margerit and Brancher2001), higher velocities are induced at the high-curvature regions of a vortex filament. See appendix A for further details on the Biot–Savart integral and its correlation with the curvature-induced velocity. Farther downstream, the deformed vortex rings tend to break down and the small-scale vortical structures appear in the shear layer. It is worth mentioning that the self-induced velocity of an axisymmetric vortex ring is mostly related to the radii of the circular ring and the vortex core since the curvature distribution is uniform. A circular structure is decelerated while evolving in time/space as a result of the increased radii of the vortex ring as well as the core thickening due to the viscous diffusion.
From a temporal point of view, one could track the vortex rings of figure 16 in time/phase. At the phase
 $\unicode[STIX]{x1D719}=0^{\circ }$
, the vortex ring
 $R_{1}$
which emerges first is advected farther downstream compared to its following ring
 $R_{2}$
. At this instant,
 $R_{1}$
appears to be more distorted while
 $R_{2}$
still maintains its rather rectangular shape. At the phase
 $\unicode[STIX]{x1D719}=120^{\circ }$
, the vortex ring
 $R_{3}$
starts to form and enter the domain. Also, the rings
 $R_{2}$
and
 $R_{1}$
are now advected farther downstream compared to the previous phase (
 $\unicode[STIX]{x1D719}=0^{\circ }$
). Also at
 $\unicode[STIX]{x1D719}=120^{\circ }$
, the ring
 $R_{1}$
is surrounded by the small-scale vortices shedding from the primary KH ring due to the growth of the perturbations. The ring
 $R_{1}$
does not maintain its intact shape at
 $\unicode[STIX]{x1D719}=240^{\circ }$
and the upstream
 $R_{2}$
and
 $R_{3}$
rings go through the deformations. Observing the vortex cores from the downstream towards the upstream reveals the formation of a rather elliptic shape of the cross-section. This elliptic shear layer recognized from the downstream demonstrates the small-scale vortices near the jet boundaries. The spatio-temporal evolution of the volumetric vortical structures reveals the deformations of the rings due to the axis switching. The near-exit rectangular shape is found to evolve into the rather elliptic shape accompanied with the increased small-scale activities with downstream distance.
Another interesting observation in figure 16 is that the vortex rings appear to be tilted when looking from the SV. This is due to the directional effect of the excitation observed earlier in the lateral velocity fluctuations (
 $v_{rms}$
) in figure 10. Since the acoustic source, which is located near the
 $y/a=-0.5$
edge, emits the pressure waves along the
 $y$
-axis (normal to the TV or the
 $x$
–
 $z$
planes), the shear layer closer to the acoustic source (
 $y/a=-0.5$
) tends to roll up in more upstream locations compared to the farther edge (
 $y/a=0.5$
). To better visualize and clarify the occurrence of the KH roll-ups in more upstream locations at the vicinity of the acoustic source, figure 17 presents the sample SV (
 $z/a=0$
) snapshots of the instantaneous vorticity (
 $\unicode[STIX]{x1D6FA}_{xy}a/U$
) and the
 $Q$
-criterion. Symmetric and non-symmetric (tilted) vortex shedding for the natural and the acoustically forced (HFHA) jets are observed in both the vorticity and the
 $Q$
-criterion fields. The side near the acoustic source demonstrates KH roll-ups and vortex shedding taking place at more upstream locations compared to the farther side of the shear layer. Ghasemi et al. (Reference Ghasemi, Tuna and Li2018) used a vortex tracking algorithm to obtain the probability density function (p.d.f.) of the vortex core locations and suggest that the KH roll-ups are statistically shifted upstream when the shear layer is forced at its fundamental frequency. Observation of the vortex ring tilting could also be interpreted in terms of the earlier transition from the shear layer varicose (symmetric) mode of instability into the sinusoidal (antisymmetric) undulations.
In the sinusoidal mode, the lateral undulations of the vortices are expected to play an important role. Also, the directional effects of the acoustic source described instantaneously above need to be analysed in a time-averaged manner. To this end, figure 18 shows the r.m.s. of the spanwise velocity fluctuations (
 $v_{rms}$
) and the time-averaged vorticity (
 $\unicode[STIX]{x1D6FA}_{xy}a/U$
) in the SV plane under the effect of the fundamental and the subharmonic excitation. The peak values of the vorticity and
 $v_{p}$
are found to be shifted to more upstream locations and decay earlier for the excitation of the fundamental (HFHA) mode compared to the natural (NAT) shear layer. This suggests the advanced upstream location of the shear layer roll-up while the tilting of the vortex rings is not reflected in the time-averaged results. On the other hand, excitation of the subharmonic (LFHA) mode does not affect the streamwise location of the roll-ups. Instead, a thicker
 $v_{rms}$
region is formed due to the enhanced vortex pairing at LFHA. In addition, the
 $v_{rms}$
peaks are sustained farther downstream and appear earlier in the centreline region.
Side view (
 $z/a=0$
) or the
 $x$
–
 $z$
plane coloured by: (a–c) the transverse velocity fluctuations (
 $v_{rms}$
) and (d–f) time-averaged vorticity (
 $\unicode[STIX]{x1D6FA}_{xy}a/U$
) for the NAT, LFHA and HFHA cases.

Top view (near the
 $y/a=0.5$
edge) or the
 $x$
–
 $z$
plane coloured by the phase-averaged streamwise velocity. The TV plane is passed through the local vortex loop demonstrated by the yellow-coloured isosurface of the instantaneous
 $Q_{p}$
-criterion. The vortex loop is isolated from the longer side of the initially rectangular vortex ring. Instantaneous snapshots are presented for the acoustic forcing at HFHA during the phases (
 $\unicode[STIX]{x1D719}=0^{\circ },60^{\circ },120^{\circ },180^{\circ },240^{\circ },300^{\circ }$
). See supplementary movie 3.

3.5 Curvature-induced perturbations in rectangular vortex rings
To enhance the understanding of the driving mechanisms of the axis-switching phenomenon, the local variation of the self-induced velocity on the vortex ring needs to be characterized. To this end, the shorter and longer sides of the rectangular vortex ring shown earlier in figure 16 are considered as individual vortex loops under curvature-induced deformations. The
 $x$
–
 $z$
plane shown in figure 19 is passed through the vortex loop constructing the longer side of the initially rectangular vortex (see figure 16). This vortex loop, which is demonstrated by the yellow-coloured isosurface of the instantaneous
 $Q_{p}$
-criterion, is aligned with the
 $z$
-axis and advects downstream in the
 $x$
-direction. The intersecting TV (
 $x$
–
 $z$
plane at
 $y/a=0.5$
edge) is coloured by the instantaneous streamwise velocity. The snapshots are presented for the acoustic forcing at HFHA during the phases
 $\unicode[STIX]{x1D719}=0^{\circ },60^{\circ },120^{\circ },180^{\circ },240^{\circ },300^{\circ }$
.
During the phases
 $\unicode[STIX]{x1D719}=0^{\circ }{-}60^{\circ }$
, the segment of the vortex ring
 $R_{3}$
, which is just entering the domain, clearly shows two high-velocity spots near the high-curvature corners (
 $z/a=\mp 1$
). These local accelerations at the sharp corners with respect to the flat sides in the middle characterize the additional curvature-induced velocity. During this stage, the newly formed vortex loop
 $R_{3}$
viewed from the top maintains its rather straight geometry. However, its faster-moving sharp corners initiate the deformations as predicted by the Biot–Savart law (Margerit & Brancher Reference Margerit and Brancher2001) described in appendix A. After the fast motion of the corners, the initially flat mid-part which is now left behind attains a high curvature. Therefore, another high-velocity spot is induced in the middle part of the vortex loop. This stage is nicely visible during the phases
 $\unicode[STIX]{x1D719}=60^{\circ }{-}180^{\circ }$
through which the ring
 $R_{2}$
demonstrates development of a slightly arced shape. Accordingly, the three high-velocity spots on the corners and the middle of
 $R_{2}$
can be correlated with the local curvature. The vortex loop associated with the ring
 $R_{1}$
, which is evolved further in time/space, appears to be more distorted compared to
 $R_{2}$
and
 $R_{3}$
.
This wavy shape characterizes the increased number of high-curvature regions on the loop. Accordingly, the high-velocity spot in the middle splits into two. The outcome is the formation of four high-velocity zones over the span of the vortex segment which are associated with the two corners and the two high-curvature regions in the middle. Alternative variations of the high/low-velocity spots along the span of the vortex loop describe the formation of the azimuthal instabilities over the ring. Likewise, the increased number of high-velocity regions suggests the shorter wavelength (higher frequency) of the azimuthal instability. By further evolving in time and correspondingly with downstream distance, the two high-velocity spots at the corners tend to decay. On the other hand, the high-velocity pairs in the middle tend to merge into one where a single mode prevails. The self-induced deformations and the resulting distortions of the vortex loop finely correlate with the curvature distribution on the vortex loops. This wavy shape of the ring is the consequence of nonlinear growth of the azimuthal perturbations on top of the initial KH instability. These perturbations grow in time and space until the ring starts to disintegrate into the smaller scales.
Phase-averaged streamwise velocity spikes characterizing the curvature-induced velocity. Instantaneous information is extracted from the TV (near the
 $y/a=0.5$
edge) or the
 $x$
–
 $z$
plane. Instantaneous snapshots are presented for the acoustic forcing at HFHA during the phases (
 $\unicode[STIX]{x1D719}=0^{\circ },60^{\circ },120^{\circ },180^{\circ },240^{\circ },300^{\circ }$
). See supplementary movie 4.

Side view (near the
 $z/a=1$
edge) or the
 $x$
–
 $y$
plane coloured by the phase-averaged streamwise velocity. The plane is passed through the local vortex loop demonstrated by the isosurface of the instantaneous
 $Q_{p}$
-criterion. The vortex loop is isolated from the shorter side of the initially rectangular vortex ring. Instantaneous snapshots are presented for the acoustic forcing at HFHA during the phases (
 $\unicode[STIX]{x1D719}=0^{\circ },60^{\circ },120^{\circ },180^{\circ },240^{\circ },300^{\circ }$
). See supplementary movie 5.

Phase-averaged streamwise velocity spikes characterizing the curvature-induced velocity. Instantaneous information is extracted from the SV (near the
 $z/a=1$
edge) or the
 $x$
–
 $y$
plane. Instantaneous snapshots are presented for the acoustic forcing at HFHA during the phases (
 $\unicode[STIX]{x1D719}=0^{\circ },60^{\circ },120^{\circ },180^{\circ },240^{\circ },300^{\circ }$
). See supplementary movie 6.

The curvature-induced velocity over the vortex loop and its correlation with the spatio-temporal evolution of the azimuthal perturbations can be further elucidated by the surface plot given in figure 20. The phase-averaged streamwise velocity information is extracted from the TV (
 $x$
–
 $z$
plane at
 $y/a=0.5$
edge) plane passed through the vortex loop located on the longer side of the rectangular opening. The surface height and colour account for the local magnitude of the phase-averaged streamwise velocity. Near the nozzle exit, two small spikes appear which describe the curvature-induced velocities at the corners of the ring
 $R_{3}$
. These two spikes grow in magnitude through the phases
 $\unicode[STIX]{x1D719}=0^{\circ }{-}60^{\circ }$
and advect downstream with time. The ring
 $R_{2}$
, which is located farther downstream during the phases
 $\unicode[STIX]{x1D719}=0^{\circ }{-}60^{\circ }$
, develops an additional spike corresponding to its high curvature in the middle. Further in time and downstream distance, the ring
 $R_{1}$
forms larger spikes at the corners. In addition, two smaller spikes are formed in the middle. The increased number of these spikes on the span of the vortex loop demonstrates the formation of multiple high-curvature regions at shorter wavelengths. These peaks and valleys characterize a spatial instability at each specific downstream location. In addition, the spatial perturbations are monitored as they advect downstream, grow or decay spatio-temporally. For instance, between
 $x/a=2.5$
and 3, while there is still a spike in the middle, the corner spikes have almost decayed. Furthermore, beyond
 $x/a=3$
, the curvature gradient becomes negligible on the ring and the ring does not remain intact due to breakdown into the smaller scales. Therefore, no preference in the self-induced velocity is observed.
Another important observation in the TV plane is the symmetry of the self-induced velocity spikes with respect to the mid-plane (
 $z/a=0$
). This accordingly suggests that the perturbations within this plane propagate symmetrically. It should be noted that the corner and the middle spikes of the self-induced velocity characterized and discussed in figure 20 can be associated with the corner and centre modes of the pressure perturbations described by Tam & Thies (Reference Tam and Thies1993). In their vortex sheet model, the centre instability modes of the pressure perturbations are found to prevail over the corner modes with the downstream distance. In addition, the large eddy simulation by Ghasemi et al. (Reference Ghasemi, Roussinova, Barron and Balachandar2016) correlates the corner pressure perturbations with the self-induced velocity during the axis switching of the square-shaped vortex rings. The present measurements verify the findings of the above theoretical/numerical efforts by explaining the growth of the corner instabilities, their decay in time/space and the domination of the middle spikes with downstream distance.
The corresponding curvature-induced velocity information displayed for the TV in figures 19 and 20 are also presented for the SV plane in figures 21 and 22. The
 $x$
–
 $y$
plane displayed in figure 21 passes through the vortex loop constituting the shorter edge of the initially rectangular vortex ring. The vortex loop which is illustrated by the yellow-coloured isosurface of the instantaneous
 $Q_{p}$
-criterion is oriented along the
 $y$
-axis and travels downstream in the
 $x$
-direction. The intersecting SV (near the
 $z/a=1$
edge) or the
 $x$
–
 $y$
plane is coloured by the phase-averaged streamwise velocity. The phase-averaged images are shown for the acoustic forcing at HFHA during the phases
 $\unicode[STIX]{x1D719}=0^{\circ }{-}60^{\circ },120^{\circ },180^{\circ },240^{\circ },300^{\circ }$
. The main observation is the tilting of the shorter segment of the vortex ring viewed from the side. As discussed earlier for figures 16 and 17, this happens because of the more upstream KH roll-ups in the shear layer located near the acoustic source. Accordingly, the curvature-induced velocity in the SV plane exhibits an asymmetric pattern for either of the sharp corners (
 $y/a=\mp 0.5$
). The high-velocity spots are present again in accordance with the curvature variations over the vortex loop. However, they are not distinguished as clearly as in the TV vortex loop. This could be explained by the shorter length of the SV vortex loop where the spanwise (azimuthal) perturbations behave differently.
The dynamics of the vortex loop constructing the shorter edge in the SV (
 $x$
–
 $y$
plane near the
 $z/a=1$
edge) can be further clarified by exploring the curvature-induced velocity spikes presented in figure 22. At the phase
 $\unicode[STIX]{x1D719}=0^{\circ }$
, the two spikes near the edges (
 $y/a=\mp 0.5$
) of the
 $R_{2}$
loop characterize the curvature-induced velocity. Unlike the TV, the self-induced velocity spikes at the corners of the SV plane are not significantly larger relative to the middle of the loop. In addition, the count of the spikes on the span of the SV loop never grows beyond three while it reaches up to four on the vortex loop along the longer edge TV (
 $x$
–
 $z$
plane near the
 $y/a=0.5$
edge). On this shorter side of the rectangular vortex ring, the middle spike does not split into two. Instead, the middle spike is shifted away from the acoustic source which is located near the
 $y/a=-0.5$
edge. After the shifting, the middle spike eventually merges into the corner spike passing near the
 $y/a=0.5$
edge. As the flow develops further in time and downstream of the merging point, the self-induced velocity spikes are again only present at the two corners. Ultimately, these two corner spikes also approach the centre and coalesce. Beyond this coalescence, the centre mode prevails as previously observed for the longer side TV vortex loop.
4 Conclusions
Particle image velocimetry (PIV) and hot-wire (HW) anemometry measurements are employed to study the curvature-induced deformations of the vortex rings generated in the jet flows emerging from a rectangular duct of aspect ratio
 $2$
. At the Reynolds number of
 $Re=UD_{h}/\unicode[STIX]{x1D708}=17\,750$
, the near exit of the naturally evolving jet demonstrates the fundamental
 $(f_{n})$
frequency due to the Kelvin–Helmholtz (KH) instability as determined by the HW-based velocity spectra and the PIV-based spatial theory of linear stability (LST). With increased downstream distance, the passage frequency of the vortices drops until the subharmonic
 $(f_{n}/2)$
mode dominates due to the vortex pairing. The characterized fundamental and subharmonic modes are then used to acoustically excite the jet at different amplitudes. The PIV measurements of the jet show that the near-field rectangular cross-section evolves into more elliptic/circular shapes farther downstream. This observation, which is accompanied with the contraction of the jet diagonal as well as the mild expansion of the longer and shorter sides, is attributed to the axis-switching phenomenon. By means of the acoustic forcing, the relative expansion/contraction of the jet in the top (TV), side (SV) and diagonal (DV) views are found to be controllable. This alters the occurrence of the first (stronger) and second (weaker) axis switching and their corresponding locations.
Excitation of the subharmonic mode results in the shorter length of the potential core and larger spread rates due to the enhanced vortex pairing. Furthermore, the overshoot commonly formed in the centreline streamwise velocity fluctuations (
 $u_{rms}$
) is suppressed under the excitation at
 $f_{n}/2$
. On the other hand, excitation of the fundamental mode advances the first KH roll-up to more upstream locations. It is found that the acoustic excitation imposes directional effects on the jet flow. The lateral velocity fluctuations aligned with the direction of the acoustic waves are significantly increased. In addition, the instantaneous KH roll-ups occur at more upstream locations within the shear layer located near the acoustic source. As a result, the vortex rings viewed from the side appear to be tilted. The
 $u_{rms}$
profiles demonstrate a peculiar double-peaking phenomenon due to the interaction of the fundamental and subharmonic modes which can be altered by applying the different acoustic forcing strategies. The skewness and kurtosis of the fluctuations in the near-separation region of the rectangular jets demonstrate increased anisotropy/intermittency, in contrast to that of circular jets, which only become anisotropic near the end of the potential core. Such a deviation from the round jet behaviour can be associated with the local curvature-induced velocities at the perturbed corners of the rectangular vortex ring. Under the effect of the acoustic excitation, the intermittency levels grow and take place in a broader region. In addition, the high-amplitude (HA) subharmonic excitation (LF), which results in the shortest length of the potential core, causes the earlier production of the intermittent flow.
The global observations in the time-averaged flow fields are better interpreted by exploring the instantaneous three-dimensional vortex dynamics. The phase-locked spatio-temporal tracking of the three-dimensional flow structures exhibits the formation of initially rectangular vortex rings due to the KH instability. As the vortex rings are advected along with the bulk flow motion, they deform and eventually break down as a result of the curvature-induced velocity. Owing to the additional self-induced velocities, the high-curvature corners of the initially rectangular KH rings are found to move faster relative to the initially flat regions of the ring. Therefore, the rectangular ring loses its two-dimensionality and develops a three-dimensional structure due to the increased number of high-curvature regions (at shorter wavelengths) and the consequent self-induced velocity. This results in the formation of nonlinear azimuthal perturbations over the distorted ring which eventually breaks down into the smaller scales. The corner modes of the curvature-induced velocity eventually coalesce into a single mode in the middle. Unlike the isolated rectangular vortex rings, those formed in continuous jets do not demonstrate a rotation-like deformation. Instead, the vortical structures reshape into the more round geometry due to the axis switching.
Propagation of the perturbations produced by the curvature-induced velocities is found also to be influenced by the directional effect of the acoustic source. The small curvature-induced velocity spikes appear symmetrically in the TV plane passing through the longer vortex loop near the separation edge. Owing to the normal orientation of the acoustic source with respect to the TV plane, the first KH roll-up and the self-induced velocity distributions occur symmetrically. This symmetric shedding of the vortices resembles the varicose mode of instability. While propagating farther downstream, these two small spikes grow in magnitude. Later, an additional spike appears in the middle of the vortex loop corresponding to the formation of the local high curvature. Increased waviness of the vortex loop is found to be correlated with the appearance of more spikes and high-curvature regions suggesting higher-frequency (shorter-wavelength) perturbations. Eventually, the middle spike dominates while the corner spikes decay. Since the acoustic source emits along the shorter loops, the shear layer closer to the source rolls up in more upstream locations compared to the farther side. Consequently, the vortex rings observed from the SV appear to be tilted. Accordingly, a non-symmetric curvature-induced velocity distribution takes place along the vortex loop. This non-symmetric shedding of the vortices appears similar to the sinusoidal mode of the instability. Unlike the TV loop, the middle spike associated with the SV loop is shifted away from the acoustic source and merges into the corner spike located in the farther edge.
Acknowledgements
This research is supported by the Natural Sciences and Engineering Research Council of Canada (NSERC) via a Discovery Grant, and Ontario Centres of Excellence (OCE) TalentEdge Internship Program (TIP) under the Project Numbers 25398 and 25657. The authors also thank Dr S. Yarusevych for providing some of the hardware for facilitating the measurements.
Supplementary movies
Supplementary movies are available at https://doi.org/10.1017/jfm.2018.988.
Appendix A. The Biot–Savart integral and its correlation with the curvature-induced velocity
The experimental observations presented in the main body of the paper demonstrate the formation of high-velocity spots near the high-curvature regions of the vortex rings. In order to expand the relevant theoretical discussions, we consider the velocity
 $U_{T}$
of a given point
 $P$
in the vicinity of a three-dimensional curved vortex line of the form
 $\boldsymbol{X}(s,t)$
subjected to the inviscid flow condition. Here,
 $s$
is the arc length along the line and
 $\boldsymbol{P}$
denotes the position vector. The total velocity
 $U_{T}$
at a given point on the vortex comprises two components:
 $$\begin{eqnarray}\displaystyle U_{T}=U_{F}+U_{I}. & & \displaystyle\end{eqnarray}$$
The
 $U_{F}$
component of the velocity is due to the bulk flow, which is finite along the vortex line. The
 $U_{I}$
part of the velocity is induced by the presence of a vorticity field. Such a velocity/vorticity relationship can be investigated by taking the curl of the momentum equation to obtain the vorticity transport equation (Leonard Reference Leonard1985). Further calculations (Leonard Reference Leonard1985) result in the Biot–Savart integral along the vortex line curve
 $\complement$
(Saffman & Baker Reference Saffman and Baker1979; Saffman Reference Saffman1992):
 $$\begin{eqnarray}\displaystyle U_{I}(P,t)=-\frac{\unicode[STIX]{x1D6E4}}{4\unicode[STIX]{x03C0}}\int _{\complement }\frac{[\boldsymbol{P}-\boldsymbol{X}(s^{\prime },t)]\times \text{d}s^{\prime }}{|\boldsymbol{P}-\boldsymbol{X}(s^{\prime },t)|^{3}}, & & \displaystyle\end{eqnarray}$$
where
 $\unicode[STIX]{x1D6E4}$
is the circulation of the vortex line considered positive in the direction of
 $s$
. It can be noted that
 $U_{I}(P,t)$
diverges as
 $|\boldsymbol{P}-\boldsymbol{X}(s^{\prime },t)|\rightarrow 0$
. In order to deal with the singularity issue of the Biot–Savart integral, techniques such as the method of matched asymptotic expansion of singular integrals (MAESI) are implemented (Margerit & Brancher Reference Margerit and Brancher2001). It should be noted that the time
 $t$
appears due to the motion of the curved vortex line. For convenience, the position vector
 $\boldsymbol{P}$
can be represented in the curvilinear coordinate system of
 $(r,\unicode[STIX]{x1D703},s)$
corresponding to the point
 $\boldsymbol{P}(s,t)$
located on the vortex line:
 $$\begin{eqnarray}\displaystyle P(x,y,z)=\boldsymbol{X}(s,t)+r\hat{r}(\unicode[STIX]{x1D703},y,z), & & \displaystyle\end{eqnarray}$$
where
 $r$
defines the minimum distance between the points
 $P$
and
 $\boldsymbol{X}(s,t)$
on the vortex line. The expansion of the Biot–Savart integral yields (Callegari & Ting Reference Callegari and Ting1978):
 $$\begin{eqnarray}\displaystyle U_{I}(P,t)=U_{I}(r,t)=\frac{\unicode[STIX]{x1D6E4}}{2\unicode[STIX]{x03C0}r}\hat{\unicode[STIX]{x1D703}}+\frac{\unicode[STIX]{x1D705}\unicode[STIX]{x1D6E4}}{4\unicode[STIX]{x03C0}}\left[\ln \left(\frac{R}{r}\right)\right]\hat{b}+\frac{\unicode[STIX]{x1D6E4}}{4\unicode[STIX]{x03C0}R}(\cos \unicode[STIX]{x1D719})\hat{\unicode[STIX]{x1D703}}+\boldsymbol{Q}_{f}. & & \displaystyle\end{eqnarray}$$
Here,
 $\hat{\unicode[STIX]{x1D703}}$
and
 $\hat{b}$
introduce the local unit vectors in the circumferential and binormal directions, respectively. As inferred from the second term on the right-hand side,
 $\unicode[STIX]{x1D705}=1/R(s,t)$
accounts for the local curvature of the vortex filament. Accordingly, the local self-induced velocity
 $U_{I}(P,t)$
varies proportional to the curvature
 $\unicode[STIX]{x1D705}$
as also observed by the present measurements.
Appendix B. Characterization of sound pressure levels for acoustic excitation
As explained in the main body of the paper, the fundamental (
 $f_{n}$
) and its subharmonic (
 $f_{n}/2$
) mode, respectively referred to as the high-frequency (HF) and the low-frequency (LF), are detected using the HW-based spectra and then verified by the PIV-based stability analysis. Afterwards, they are used to acoustically excite the rectangular jet. The characteristics of the low (LA), mid- (MA) and high (HA) excitation amplitudes and the corresponding sound pressure levels (SPLs) are presented in table 1. The pressure levels are measured using a Brüel and Kjær
 $4192$
free-field condenser microphone. The SPL level is evaluated using the r.m.s. of the pressure (
 $p_{rms}$
) in the equation:
 $$\begin{eqnarray}\displaystyle L_{i}=\text{SPL}_{i}=10\log \left(\frac{p_{rms,i}}{p_{ref}}\right)^{2}=20\log \left(\frac{p_{rms,i}}{p_{ref}}\right)\!, & & \displaystyle\end{eqnarray}$$
where
 $p_{ref}=20~\unicode[STIX]{x03BC}\text{Pa}$
is the reference pressure used for the calculations in air. Summation of the
 $n$
different SPLs can be achieved using the equation:
 $$\begin{eqnarray}\displaystyle L_{sum}=10\log \left(\frac{p_{rms,1}^{2}+p_{rms,2}^{2}+\cdots +p_{rms}^{2},n}{p_{ref}^{2}}\right)\!. & & \displaystyle\end{eqnarray}$$
Considering the equation
 $$\begin{eqnarray}\displaystyle \left(\frac{p_{rms,i}}{p_{ref}}\right)^{2}=10^{L_{i}/10}, & & \displaystyle\end{eqnarray}$$
the summation of the SPLs can be obtained as
 $$\begin{eqnarray}\displaystyle L_{sum}=10\log (10^{L_{1}/10}+10^{L_{2}/10}+\cdots +10^{L_{n}/10}). & & \displaystyle\end{eqnarray}$$
First, the ambient noise level of SPL = 76.3 (dB) is characterized when the tunnel air flow and the acoustic source are OFF. Afterwards, the SPL levels due to the LA, MA and HA amplitudes are characterized as 79.1 (dB), 88.1 (dB) and 95.5 (dB) when the tunnel air flow and the acoustic source are ON. The tunnel-OFF SPL values are given in the left column of table 1. In order to obtain the SPL levels of the natural (NAT) jet, measurements conducted at the centre of the channel exit yield SPL = 91.2 (dB). In order to obtain the tunnel-ON values in the right column (
 $\text{SPL}_{R}$
) of table 1, the tunnel-OFF levels in the left column (
 $\text{SPL}_{L}$
) are added to the SPL of the natural case (
 $\text{SPL}_{NAT}=91.2$
(dB)) using the equation below:
 $$\begin{eqnarray}\displaystyle \text{SPL}_{R}=10\log (10^{\text{SPL}_{L}/10}+10^{\text{SPL}_{NAT}/10}). & & \displaystyle\end{eqnarray}$$
For example,
 $91.5~(\text{dB})=10\log (10^{79.11/10}+10^{91.2/10})$
is the SPL level of the LA excitation of the jet given in the right column of the second row of table 1.
Characterization of the sound pressure level (SPL) for the low (LA), mid- (MA) and high (HA) amplitudes for the acoustic excitations at the fundamental (
 $f_{n}$
) and subharmonic frequencies (
 $f_{n}/2$
).

Appendix C. Spatial analysis of the linear stability modes
In linear stability (LST) analysis, the hydrodynamic theory of stability treats the shear layer in terms of the dynamics of the group of waves which may propagate, amplify or decay in the space/time medium (Drazin & Reid Reference Drazin and Reid2004; Betchov Reference Betchov2012). The transport and dynamics of the waves are analysed in Fourier space instead of the conventional physical time/space. In order to predict the stability criteria, the Orr–Sommerfeld equation is solved, which can be derived from the incompressible Navier–Stokes equations (Schmid & Henningson Reference Schmid and Henningson2012):
 $$\begin{eqnarray}\displaystyle & \displaystyle \unicode[STIX]{x1D735}\boldsymbol{\cdot }\boldsymbol{V}=0, & \displaystyle\end{eqnarray}$$
 $$\begin{eqnarray}\displaystyle & \displaystyle \unicode[STIX]{x1D70C}\frac{\text{D}\boldsymbol{V}}{\text{D}t}=-\unicode[STIX]{x1D735}P+\unicode[STIX]{x1D707}\unicode[STIX]{x1D6FB}^{2}\boldsymbol{V}. & \displaystyle\end{eqnarray}$$
Here,
 $\boldsymbol{V}$
,
 $P$
,
 $\unicode[STIX]{x1D707}$
and
 $\unicode[STIX]{x1D70C}$
denote the velocity vector, pressure, dynamic viscosity and density, respectively. The velocity and pressure perturbations
 $V_{x}=U+u^{\prime }$
,
 $V_{y}=V+v^{\prime }$
and
 $p=P+p^{\prime }$
are introduced into the above continuity and momentum equations:
 $$\begin{eqnarray}\displaystyle & \displaystyle \frac{\unicode[STIX]{x2202}u^{\prime }}{\unicode[STIX]{x2202}x}+\frac{\unicode[STIX]{x2202}v^{\prime }}{\unicode[STIX]{x2202}x}=0, & \displaystyle\end{eqnarray}$$
 $$\begin{eqnarray}\displaystyle & \displaystyle \frac{\unicode[STIX]{x2202}u^{\prime }}{\unicode[STIX]{x2202}t}+U\frac{\unicode[STIX]{x2202}u^{\prime }}{\unicode[STIX]{x2202}x}+V\frac{\unicode[STIX]{x2202}u^{\prime }}{\unicode[STIX]{x2202}y}+u^{\prime }\frac{\unicode[STIX]{x2202}U}{\unicode[STIX]{x2202}x}+v^{\prime }\frac{\unicode[STIX]{x2202}U}{\unicode[STIX]{x2202}y}=-\frac{1}{\unicode[STIX]{x1D70C}}\frac{\unicode[STIX]{x2202}p^{\prime }}{\unicode[STIX]{x2202}x}+\frac{\unicode[STIX]{x1D707}}{\unicode[STIX]{x1D70C}}\left(\frac{\unicode[STIX]{x2202}^{2}u^{\prime }}{\unicode[STIX]{x2202}x^{2}}+\frac{\unicode[STIX]{x2202}^{2}u^{\prime }}{\unicode[STIX]{x2202}y^{2}}\right)\!, & \displaystyle\end{eqnarray}$$
 $$\begin{eqnarray}\displaystyle & \displaystyle \frac{\unicode[STIX]{x2202}v^{\prime }}{\unicode[STIX]{x2202}t}+U\frac{\unicode[STIX]{x2202}v^{\prime }}{\unicode[STIX]{x2202}x}+V\frac{\unicode[STIX]{x2202}v^{\prime }}{\unicode[STIX]{x2202}y}+u^{\prime }\frac{\unicode[STIX]{x2202}V}{\unicode[STIX]{x2202}x}+v^{\prime }\frac{\unicode[STIX]{x2202}V}{\unicode[STIX]{x2202}y}=-\frac{1}{\unicode[STIX]{x1D70C}}\frac{\unicode[STIX]{x2202}p^{\prime }}{\unicode[STIX]{x2202}y}+\frac{\unicode[STIX]{x1D707}}{\unicode[STIX]{x1D70C}}\left(\frac{\unicode[STIX]{x2202}^{2}v^{\prime }}{\unicode[STIX]{x2202}x^{2}}+\frac{\unicode[STIX]{x2202}^{2}v^{\prime }}{\unicode[STIX]{x2202}y^{2}}\right)\!. & \displaystyle\end{eqnarray}$$
Using the parallel flow assumption as
 $U=U(y)$
and
 $V=0$
, the above equations are reduced to
 $$\begin{eqnarray}\displaystyle & \displaystyle \frac{\unicode[STIX]{x2202}u^{\prime }}{\unicode[STIX]{x2202}x}+\frac{\unicode[STIX]{x2202}v^{\prime }}{\unicode[STIX]{x2202}x}=0, & \displaystyle\end{eqnarray}$$
 $$\begin{eqnarray}\displaystyle & \displaystyle \frac{\unicode[STIX]{x2202}u^{\prime }}{\unicode[STIX]{x2202}t}+U\frac{\unicode[STIX]{x2202}u^{\prime }}{\unicode[STIX]{x2202}x}+v^{\prime }\frac{\unicode[STIX]{x2202}U}{\unicode[STIX]{x2202}y}=-\frac{1}{\unicode[STIX]{x1D70C}}\frac{\unicode[STIX]{x2202}p^{\prime }}{\unicode[STIX]{x2202}x}+\frac{\unicode[STIX]{x1D707}}{\unicode[STIX]{x1D70C}}\left(\frac{\unicode[STIX]{x2202}^{2}u^{\prime }}{\unicode[STIX]{x2202}x^{2}}+\frac{\unicode[STIX]{x2202}^{2}u^{\prime }}{\unicode[STIX]{x2202}y^{2}}\right)\!, & \displaystyle\end{eqnarray}$$
 $$\begin{eqnarray}\displaystyle & \displaystyle \frac{\unicode[STIX]{x2202}v^{\prime }}{\unicode[STIX]{x2202}t}+U\frac{\unicode[STIX]{x2202}v^{\prime }}{\unicode[STIX]{x2202}x}=-\frac{1}{\unicode[STIX]{x1D70C}}\frac{\unicode[STIX]{x2202}p^{\prime }}{\unicode[STIX]{x2202}y}+\frac{\unicode[STIX]{x1D707}}{\unicode[STIX]{x1D70C}}\left(\frac{\unicode[STIX]{x2202}^{2}v^{\prime }}{\unicode[STIX]{x2202}x^{2}}+\frac{\unicode[STIX]{x2202}^{2}v^{\prime }}{\unicode[STIX]{x2202}y^{2}}\right)\!. & \displaystyle\end{eqnarray}$$
The following form of the normal instability modes can be introduced into the above perturbation equations (Schmid & Henningson Reference Schmid and Henningson2012):
 $$\begin{eqnarray}\displaystyle & \displaystyle \unicode[STIX]{x1D713}=\unicode[STIX]{x1D719}(y)\text{e}^{\text{i}(\unicode[STIX]{x1D6FC}x-\unicode[STIX]{x1D714}t)}, & \displaystyle\end{eqnarray}$$
 $$\begin{eqnarray}\displaystyle & \displaystyle u^{\prime }=\frac{\unicode[STIX]{x2202}\unicode[STIX]{x1D713}}{\unicode[STIX]{x2202}y}=\frac{\unicode[STIX]{x2202}\unicode[STIX]{x1D719}}{\unicode[STIX]{x2202}y}\text{e}^{\text{i}(\unicode[STIX]{x1D6FC}x-\unicode[STIX]{x1D714}t)}, & \displaystyle\end{eqnarray}$$
 $$\begin{eqnarray}\displaystyle & \displaystyle v^{\prime }=-\frac{\unicode[STIX]{x2202}\unicode[STIX]{x1D713}}{\unicode[STIX]{x2202}x}=-\text{i}\unicode[STIX]{x1D6FC}\unicode[STIX]{x1D719}\text{e}^{\text{i}(\unicode[STIX]{x1D6FC}x-\unicode[STIX]{x1D714}t)}. & \displaystyle\end{eqnarray}$$
In the spatial theory of the LST,
 $\unicode[STIX]{x1D6FC}$
is considered as a complex wavenumber to account for the exponential growth/decay of the perturbations in space (Michalke Reference Michalke1972; Schmid & Henningson Reference Schmid and Henningson2012). On the other hand,
 $\unicode[STIX]{x1D714}$
is a real frequency parameter to allow for the purely convective oscillations of the perturbations in time without any amplification/damping (Michalke Reference Michalke1972; Schmid & Henningson Reference Schmid and Henningson2012). After the calculation and substitution of the corresponding derivatives as well as the elimination of the pressure terms, we obtain:
 $$\begin{eqnarray}\displaystyle -\text{i}\unicode[STIX]{x1D714}\frac{\unicode[STIX]{x2202}^{2}\unicode[STIX]{x1D719}}{\unicode[STIX]{x2202}y^{2}}+\text{i}\unicode[STIX]{x1D6FC}U\frac{\unicode[STIX]{x2202}^{2}\unicode[STIX]{x1D719}}{\unicode[STIX]{x2202}y^{2}}-\text{i}\unicode[STIX]{x1D6FC}\unicode[STIX]{x1D719}\frac{\unicode[STIX]{x2202}^{2}U}{\unicode[STIX]{x2202}y^{2}}+\frac{\unicode[STIX]{x1D707}}{\unicode[STIX]{x1D70C}}\left(\!-\frac{\unicode[STIX]{x2202}^{4}\unicode[STIX]{x1D719}}{\unicode[STIX]{x2202}y^{4}}+2\unicode[STIX]{x1D6FC}^{2}\frac{\unicode[STIX]{x2202}^{2}\unicode[STIX]{x1D719}}{\unicode[STIX]{x2202}y^{2}}-\unicode[STIX]{x1D6FC}^{4}\unicode[STIX]{x1D719}\!\right)+\text{i}\unicode[STIX]{x1D6FC}^{2}\unicode[STIX]{x1D714}\unicode[STIX]{x1D719}-\text{i}\unicode[STIX]{x1D6FC}^{3}U\unicode[STIX]{x1D719}=0. & & \displaystyle \nonumber\\ \displaystyle & & \displaystyle\end{eqnarray}$$
Further simplifications result in a fourth-order linear differential equation which is known as the Orr–Sommerfeld equation and describes the linear two-dimensional modes of the perturbations in a viscous parallel flow (Schmid & Henningson Reference Schmid and Henningson2012):
 $$\begin{eqnarray}\displaystyle \left(U-\frac{\unicode[STIX]{x1D714}}{\unicode[STIX]{x1D6FC}}\right)\left(\frac{\unicode[STIX]{x2202}^{2}\unicode[STIX]{x1D719}}{\unicode[STIX]{x2202}y^{2}}-\unicode[STIX]{x1D6FC}^{2}\unicode[STIX]{x1D719}\right)-\unicode[STIX]{x1D719}\frac{\unicode[STIX]{x2202}^{2}U}{\unicode[STIX]{x2202}y^{2}}+\frac{\text{i}\unicode[STIX]{x1D708}}{\unicode[STIX]{x1D6FC}}\left(\frac{\unicode[STIX]{x2202}^{4}\unicode[STIX]{x1D719}}{\unicode[STIX]{x2202}y^{4}}-2\unicode[STIX]{x1D6FC}^{2}\frac{\unicode[STIX]{x2202}^{2}\unicode[STIX]{x1D719}}{\unicode[STIX]{x2202}y^{2}}+\unicode[STIX]{x1D6FC}^{4}\unicode[STIX]{x1D719}\right)=0. & & \displaystyle\end{eqnarray}$$
It should also be noted that the Orr–Sommerfeld equation can be simplified to the Rayleigh equation for inviscid flow (Schmid & Henningson Reference Schmid and Henningson2012). By defining the scaling variables below:
 $$\begin{eqnarray}\displaystyle c=\frac{\unicode[STIX]{x1D714}}{\unicode[STIX]{x1D6FC}},\quad \unicode[STIX]{x1D709}=\frac{y}{\unicode[STIX]{x1D6FF}},\quad \overline{\unicode[STIX]{x1D719}}=\frac{\unicode[STIX]{x1D719}}{\unicode[STIX]{x1D6FF}U_{\infty }},\quad \overline{c}=\frac{c}{U_{\infty }},\quad \overline{\unicode[STIX]{x1D6FC}}=\unicode[STIX]{x1D6FC}\unicode[STIX]{x1D6FF},\quad Re_{\unicode[STIX]{x1D6FF}}=\frac{U_{\infty }\unicode[STIX]{x1D6FF}}{\unicode[STIX]{x1D708}}, & & \displaystyle\end{eqnarray}$$
the dimensionless form of the Orr–Sommerfeld equation can be derived as
 $$\begin{eqnarray}\displaystyle (\overline{U}-\overline{c})(\overline{\unicode[STIX]{x1D719}}^{\prime \prime }-\overline{\unicode[STIX]{x1D6FC}}\overline{\unicode[STIX]{x1D719}})-\overline{U}^{\prime \prime }\overline{\unicode[STIX]{x1D719}}+\frac{i}{\overline{\unicode[STIX]{x1D6FC}}Re_{\unicode[STIX]{x1D6FF}}}(\overline{\unicode[STIX]{x1D719}}^{\prime \prime \prime \prime }-2\overline{\unicode[STIX]{x1D6FC}}^{2}\overline{\unicode[STIX]{x1D719}}^{\prime \prime }+\overline{\unicode[STIX]{x1D6FC}}^{4}\overline{\unicode[STIX]{x1D719}})=0, & & \displaystyle\end{eqnarray}$$
where
 $c=\unicode[STIX]{x1D714}/\unicode[STIX]{x1D6FC}$
,
 $\unicode[STIX]{x1D6FF}$
,
 $\unicode[STIX]{x1D6FC}$
,
 $\unicode[STIX]{x1D714}$
,
 $\unicode[STIX]{x1D708}$
and
 $Re_{\unicode[STIX]{x1D6FF}}$
denote the phase velocity, displacement thickness, complex wavenumber, real frequency, kinematic viscosity and the Reynolds number, respectively.
Since the coefficients are not constant, the exact solutions can only be obtained for very specific conditions, for instance, when the second spatial derivative of the velocity is zero, as seen in the case of the piecewise-linear profiles (Charru Reference Charru2011). Therefore, a numerical solution approach needs to be implemented for a more realistic base flow. Prior to the solution of the Orr–Sommerfeld equation, the base velocity
 $U(y)$
around which the flow is perturbed needs to be determined. For each of the natural or acoustically excited cases, different base flows are considered. To this end, the corresponding time-averaged velocity profiles obtained from the PIV measurements are extracted for different streamwise locations. It is worth mentioning that the spatial LST has previously been carried out for excited flows, namely the studies by Marxen et al. (Reference Marxen, Kotapati, Mittal and Zaki2015) and Yarusevych & Kotsonis (Reference Yarusevych and Kotsonis2017). For the convenience of the numerical implementations, the velocity profiles are fitted to the hyperbolic tangent (tanh) profile using the method of least squares (Dini et al.
Reference Dini, Seligt and Maughmert1992):
 $$\begin{eqnarray}\displaystyle U(y)=c_{5}\left\{\left(\frac{1-c_{1}}{2}\right)+\left(\frac{1+c_{1}}{2}\right)\tanh \left[c_{2}\left(\frac{y-c_{3}}{c_{4}}\right)\right]\right\}. & & \displaystyle\end{eqnarray}$$
For each of the downstream locations, using the time-averaged streamwise velocity profile as the base flow describes the local LST analysis of the spatial perturbations (Monkewitz & Huerre Reference Monkewitz and Huerre1982). The Orr–Sommerfeld equation defines an eigenvalue problem which is numerically solved by applying the proper homogeneous boundary conditions. The nonlinearity issue in the eigenvalue system is resolved by means of the companion matrix according to Bridges & Morris (Reference Bridges and Morris1984). In comparison to the conventional numerical techniques such as the finite difference schemes, spectral methods based on the expansion of the Chebyshev polynomials are preferred as they provide higher accuracy with less demanding computational resources. The eigenfunction
 $\unicode[STIX]{x1D719}(y)$
in the Orr–Sommerfeld equation is obtained by the spectral collocation solution method in which expansions in the form of the Chebyshev polynomial approximations are considered:
 $$\begin{eqnarray}\displaystyle \unicode[STIX]{x1D719}(y)=\mathop{\sum }_{n=0}^{\infty }a_{n}T_{n}(y). & & \displaystyle\end{eqnarray}$$
The
 $n$
th-degree Chebyshev polynomial of the first kind,
 $T_{n}(x)$
, is defined as
 $$\begin{eqnarray}\displaystyle T_{n}(\cos \unicode[STIX]{x1D703})=\cos (n\unicode[STIX]{x1D703}), & & \displaystyle\end{eqnarray}$$
where the positive integers
 $n=0,1,2,3,\ldots$
recursively yield
 $T_{0}(x)=1$
,
 $T_{1}(x)=x$
and
 $T_{n+1}(x)=2xT_{n}(x)-T_{n-1}(x)$
. The coefficients
 $a_{n}$
are obtained from the integration
 $$\begin{eqnarray}\displaystyle a_{n}=\frac{2}{\unicode[STIX]{x03C0}c_{n}}\int _{-1}^{1}v(y)T_{n}(y)(1-y^{2})^{-(1/2)}\,\text{d}y & & \displaystyle\end{eqnarray}$$
in which
 $c_{0}=2$
for
 $n=0$
and we have
 $c_{n}=1$
for
 $n>0$
. For further details on the numerical implementation see Lie & Riahi (Reference Lie and Riahi1988).



