I. INTRODUCTION
Organic–inorganic interface exists in many material systems that can be found broadly in natural and synthetic materials, such as mineral–protein interfaces seen in bone and epoxy–silica interfaces found in concrete buildings and bridges. The study of such interfaces has been the subject of investigations in various research fields, including biomechanical engineering, electrical engineering, materials science, and structural engineering because of its biological, scientific, and technological significance. Based on prior research on interfacial properties of bonded systems,Reference Au and Büyüköztürk1–Reference Tuakta and Buyukozturk4 it is known that the structural and mechanical integrity of the interface is highly affected by the physical and/or chemical interactions between the interface and the surrounding region at the nanoscale. With the development of molecular dynamics (MD) as a powerful method to describe the mechanics of interfaces from fundamental chemical principles upwards, information about the mechanical behavior of the interfacial region through the observation of atomic and molecular motions can be acquired.Reference Büyüköztürk, Buehler, Lau and Tuakta5, Reference Buehler6 In particular, the integrity of the bonded material system can be studied from a fundamental perspective by monitoring the interactions and the deformation mechanism between two materials along the interfacial region at a molecular level. More recently, there are several examples where mechanical properties from molecular simulations match reasonably well with those measured experimentally at larger scales (see, e.g., case studies discussed in Ref. Reference Buehler6). However, deformation mechanisms at the interface can be complicated and can change across different length scales. Besides the change of deformation mechanisms, the disparity in timescale and length scale also leads to the discrepancies between MD simulation and the experimental results. Hence, there is a need to connect the atomistic level to macroscale such that a prediction on mechanical properties using a bottom-up approach becomes feasible.
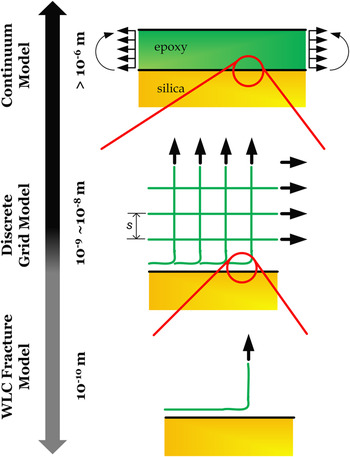
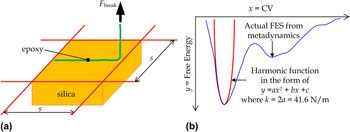
The underlying principle of this work is to understand the adhesion problem between an organic and an inorganic material, using epoxy–silica system as a simple example. Epoxy, bonded with silica in many engineering applications, is chosen as the representative of an organic material because of its extensive application as an adhesive. Also, its chain structure with cross-links can be found readily in many other polymers. Silica, commonly found material in nature in the form of sand or quartz, as well as in the cell walls of diatoms, is the most abundant mineral in the Earth’s crust,Reference Korzhinsky, Tkachenko, Shmulovich and Steinberg7 and is thus a good model for a mineral. The epoxy–silica interface serves as a representative system for an interface dominated by relatively weak and noncovalent chemical interactions. In many cases, the interatomic and intermolecular bonds at organic–inorganic interfaces are of noncovalent nature. We focus our study on studying the effect of the nonbonded interactions (van der Waals forces and Coulombic interactions) between polymer chains and a mineral surface, incorporating the effect of the spacing between polymer chains toward the structural behavior of the interface at the macroscale. Also, the proposed model should be able to describe the interfacial debonding mechanism, which is dominated by the sliding of the polymer chains on the substrate. With these considerations, our model is constructed at the nanoscale (∼2–3 nm) such that the adhesion between a small piece of crystalline silica and a single polymer chain can be carefully investigated. The effect of the spacing between polymer chains is studied at a larger length scale in which each polymer chain is connected through cross-linking, using a simplified symmetrical grid system with a spacing “s” as shown in Fig. 1. Even though this simplified model may not be able to describe all details in the vicinity of the interface (e.g., the variation of the partial charges, kinematic barriers, and changes during debonding, or alternative deformation mechanisms at larger scales), our model provides a basic description of interfacial properties of this system.
The continuum epoxy–silica interface can be represented by a discrete grid model when the length scale goes down to nanoscale. The adhesion between each epoxy chain and the silica substrate can be represented by the WLC-based fracture model. Our proposed multiscale analysis is to deliver the mechanical properties derived in the WLC-based fracture model to the continuum macroscale through the implementation of a finite element analysis.

In what follows, we will demonstrate the approach of developing this model starting from the atomistic scale. The result from the MD simulation will be interpreted as intrinsic strength of an individual epoxy chain by applying the rubber-like elasticity, which can then be converted to continuum interfacial properties through use of cohesive elements in finite element modeling. Our prediction at the macroscale will then be conducted through finite element model, and a comparison between our prediction and existing experimental results will be made.
II. MATERIALS AND METHODS
The multiscale approach used here involves a systematic determination of interfacial parameters, starting from the surface energy, a material property that characterizes the energy required to create new surface. The surface energy is characterized by deriving a free energy profile of our system that describes the free energy surface (FES) from an attached stage referring to the lowest free energy state to a detached stage when the separation between two materials is larger than 10 Å, which is the cutoff distance of the pair potential (the free energy is the energy that is convertible to work) used in our MD simulation. The difference in the free energy between the attached and detached stages, normalized by an associated area of molecular attachment (computed as the surface area of epoxy chain projected onto the silica substrate), yields an estimate of the upper bound of the surface energy between epoxy and silica. The identification of the FES is achieved using the metadynamics method.Reference Laio and Parrinello8, Reference Laio and Gervasio9
After obtaining the surface energy between epoxy and silica from MD simulation, a worm-like-chain (WLC)-based fracture modelReference Keten and Buehler10 is adopted to estimate the intrinsic strength at the interface. The WLC fracture model is based on the rubber elasticity concept and is used to describe the debonding mechanism at the molecular level as a molecular peeling process. The intrinsic strength at the epoxy–silica interface derived from the WLC fracture model is then used to determine the macroscale material interfacial behavior through the implementation of a cohesive zone model (CZM), which describes the debonding mechanism through the traction–separation relation. By using cohesive elements in finite element modeling, the behavior is represented at the continuum level to describe the macroscopic debonding mechanism at the interface. Our prediction is eventually compared with existing experimental data for demonstrating the applicability of our model in predicting the structural behavior in a macroscale based on the MD simulation results. We give more details into the methods used here in the following sections.
A. Atomistic model
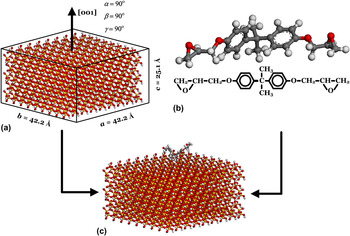
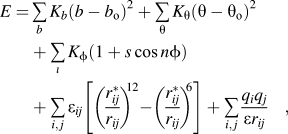
The atomistic model consists of a slab of crystalline silica (SiO2) and a single chain of epoxy. Figure 2 shows the atomistic model of the epoxy–silica system used in the MD simulation. The bulk silica crystal is cleaved in such a way that the normal vector of the cleaved surface (to be in contact with epoxy) is at the [001] direction. A nonperiodic boundary condition is applied on the SiO2 substrate, and thus, hydrogen atoms are used as the termination atoms at the boundary of the SiO2 substrate. The entire SiO2 substrate has dimensions a = 42.2 Å, b = 42.2 Å, c = 25.1 Å, with α = 90°, β = 90°, γ = 90° and consists of 4749 atoms. The epoxy used in this study is diglycidyl ether of bisphenol A. Typically, nonreactive force fields are fitted to thermodynamic properties and not to kinetic barriers. However, based on our prior work on epoxy–silica system in which Consistent Valance Force Field (CVFF) was used to govern the interaction between epoxy and silica, the applicability of using CVFF with the Bell model to quantify a reasonable energy barrier for the adhesion problem has been demonstrated.Reference Büyüköztürk, Buehler, Lau and Tuakta5 We emphasize that the breaking of bonds of interest here are weak bonds, not covalent, which can be described with CVFF. By using the nonreactive force field CVFF, it is understood that the partial charges in the system do not change in the entire MD simulation process. Although the partial charges along the interface may not be accurately described in the entire debonding process by using CVFF, we make the case based on our earlier work.Reference Büyüköztürk, Buehler, Lau and Tuakta5 Partial charges of all atoms in the simulation cell are calculated by the charge equilibrium (QEq) method.Reference Rappe and Goddard11 It has been demonstrated that the charge distributions from QEq lead to good agreement with experimental data and ab initio calculations.Reference Rappe and Goddard11 The QEq approach uses only readily available experimental data (ionization potential, electron affinity, and atomic radius) and thus can be applied to any combination of atoms. Based on our prior work on epoxy–silica system using the CVFF and the similar description of nonbonded interaction among various nonreactive force fields, we decided to choose CVFF for studying the adhesion between silica and epoxy and extended the application of CVFF to include epoxy–silica interaction, as this is not included in the original version. Besides for modeling the interaction between epoxy and silica, CVFF is also used to describe SiO2. The properties that are correctly captured by CVFF are the elastic constants, including the Young’s modulus. Here, the total potential function in CVFF is represented by the superposition of valance and nonbonded interactions. The valance terms are the bonded interactions consisting of bond stretch, bond angle bending, dihedral angle torsion terms, while nonbonded interactions consist of van der Waals and Coulombic terms. In this simulation, we use the CVFF potential energy function given in Refs. Reference Maple, Dinur and Hagler12 and Reference Dauber-Osguthorpe, Roberts, Osguthorpe, Wolff, Genest and Hagler13. This is a reduced form of CVFF potential function using harmonic form for bond stretching term, which is useful for simulating structures consisting of organic and inorganic phases.Reference Ritschla, Faitb, Fiedlera, JKohlerc, Kubiasb and Meisela14 In this reduced form, the CVFF potential function is described as:
(a) Atomistic model of the silica substrate in which the surface is cleaved in [001] crystallographic plane, (b) the epoxy chain with only one repeating unit, and (c) the epoxy chain is moved manually onto the silica substrate before carrying out the simulation.

where  ,
 , and
 are force constants, b o, θo, and
 are equilibrium bond length, equilibrium bond angle, and dihedral angle, respectively; b and θ are bond length and bond angle, rij is the distance between the ith and jth particles with charges qi and qj, respectively. The terms εij and rij* determine the minimum and zero values of the van der Waals terms, respectively. The CVFF has been parameterized against a wide range of experimental observables for amino acids, water, and a variety of other functional groups, as well as some inorganic materials including silica. The major parameters used in the atomistic model setup are shown in the Supplemental Appendix. Initiation and energy minimization of the simulation cell containing epoxy and silica are then performed. After constructing the atomistic models with the clear definition of the model geometry and the interaction among atoms, the model is equilibrated under a NVT ensemble at 300 K using the LAMMPS code.Reference Plimpton15
B. Metadynamics analysis for adhesion energy of a single epoxy chain
The FES of the epoxy–silica system from an attached stage to a detached stage is reconstructed by the metadynamics approach.Reference Laio and Parrinello8, Reference Laio and Gervasio9 This is a powerful algorithm that can be used for both reconstructing the free energy and for accelerating rare events in the system. The principle of this algorithm can be qualitatively understood by filling the actual FES by a series of Gaussians. By keeping track on the filled Gaussians, the FES can be calculated. Metadynamics requires the identification of a set of collective variables (CVs), which are assumed to be able to describe the process of interest. The dynamics in the space of the chosen CVs is enhanced by a history-dependent potential constructed as a sum of Gaussians centered along the trajectory followed by the CVs. In metadynamics, the sum of Gaussians is exploited to reconstruct iteratively an estimator of the free energy. The Gaussian potential (V G) acting on the system at time t is given by:

where s(t) = S(x(t)) is the value taken by the CV at time t. Three parameters are introduced in the definition of the V G, namely the Gaussian height (ω), the Gaussian width (δs), and the frequency ( ) at which the Gaussians are added. These parameters influence the accuracy and efficiency of the free energy reconstruction. Qualitatively, they define the amount of external energy being added to the actual FES. If the Gaussians are large, the FES will be explored in a fast pace, but the reconstructed profile will be affected by larger errors. Instead, if the Gaussians are small or are placed infrequently, the reconstruction will be accurate, but the trade-off is to take a longer time for achieving a uniform sampling. After careful adjustments of these parameters, we find that a Gaussian of height (ω) = 0.005 and width (δs) = 0.35 added every 100 steps is good in reconstructing a reliable FES of our system.
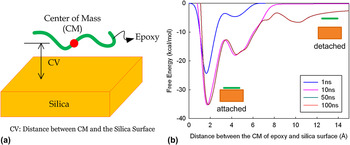
Besides the parameters in Gaussian potential, the reliability of metadynamics is strongly influenced by the choice of the CVs. Ideally, the CVs should be chosen such that they can clearly distinguish, as a special interest to us, the initial stage from the final stage. Meanwhile, they should describe all slow events that are relevant to the process of interest and the number of CVs should not be too large to avoid a long time for filling the FES. In our case, the distance between the center of mass of the epoxy chain and the silica surface is chosen to be the CV for this study as shown in Fig. 3(a). All metadynamics calculations are performed by using the PLUMED plug-in package.Reference Bonomi, Branduardi, Bussi, Camilloni, Provasi, Raiteri, Donadio, Marinelli, Pietrucci, Broglia and Parrinello16 The results are then interpreted by plotting with different simulation time until convergence is obtained (ensured when reconstructed free energy profiles overlap with each other).
(a) Schematic diagram showing the definition of CV in epoxy–silica system. (b) It shows the convergence of the FES in the epoxy–silica system under different processing times. The surface energy of the system can be calculated by taken the energy difference between the attached and detached stages.

The surface energy is obtained by dividing the free energy barrier (E b) between the attached and detached stages by the entire contour length of the epoxy chain (L o), i.e.:

C. WLC-based fracture model
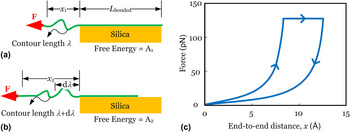
The method described in Sec. II. B. gives an estimate of the adhesion energy of the epoxy chain at the surface. In this calculation, the debonding mechanism of the bonded system is assumed to be homogenous. This mechanism, however, will likely not represent the detachment mechanism when a single epoxy chain is separated from the silica surface by mechanical load acting at the far end of the epoxy chain (see schematic in Fig. 1 for the boundary conditions at different scales). To address this issue, we extend the consideration by invoking a WLC-based fracture model that allows us to predict the force needed to detach an epoxy chain from the substrate. The intrinsic strength can in principle be found by applying a force at the end of the epoxy chain. However, the result predicted through this method is likely higher than the actual strength, and the discrepancy depends on the asymptotic nature between rupture force and the pulling speed for the material system at hand. The dependence on the pulling speed in MD studies has been widely investigated in the literature.Reference Büyüköztürk, Buehler, Lau and Tuakta5, Reference Ackbarow, Chen, Keten and Buehler17, Reference Sotomayor and Schulten18 To interpret the result from atomistic simulation with the experimental data, we need to overcome the difference in timescale between atomistic simulations and experiment such that the intrinsic strength limit, which corresponds to the limit of zero pulling speed, can be evaluated. Based on previous work, the intrinsic strength limit of hydrogen bond assemblies in protein has been investigated.Reference Keten and Buehler10 Here, we extend this work such that the intrinsic strength at the organic–inorganic interface governed by nondirectional and continuous interactions can be quantified. A simple model as shown in Fig. 4 is used to describe the rupture behavior of a single epoxy chain attached on a silica substrate.
(a) Single chain epoxy with a length L bonded bonded with the silica substrate by a continuous van der Waals and Coulombic interactions is strained at the free end under a constant force F, (b) at the onset of rupture, the contour length increases due to the detachment of a piece of chain, and (c) qualitative description of the force–displacement behavior before and after debonding, with an illustration of the dissipation energy. It is noted that the model does not require the applied force to be in the shear direction as shown in panels (a) and (b). In fact, it is valid for other loading angles (shear, tear, or mixed) as we only consider the free energy change in the overhang of the epoxy chain.

A combination of WLC modelReference Marko and Siggia19 and a fracture approachReference Keten and Buehler10 is an appropriate model that suits our purpose. Epoxy is a polymer and its elasticity is primarily due to entropic rather than energetic effects at low to intermediate force levels. This model is one of the most widely used expressions to predict the entropic elasticity of polymer chains and has been adopted here as the elastic description of the epoxy backbone. Previous studies provide substantial evidence that this model is a good model for the behavior of individual unconstrained polymer chains.Reference Rief, Gautel, Oesterhelt, Fernandez and Gaub20–Reference Bustamante, Smith, Liphardt and Smith24 By adopting the WLC model, we obtain energy release rate (G) through an expression of how the free energy changes as a function of detachment of the polymer from the substrate, and at the stage just before the onset of rupture, the critical energy release rate (G c) is equal to the surface energy between epoxy and silica ( ; determined as describe above), and hence,
 . The rupture force
 is then given as a function of
 and the persistence length (
 ), where
 is the ratio between the end-to-end chain length (x) and the contour length (λ) at the moment of fracture obtained from the condition
 . The intrinsic strength (F break) of the epoxy–silica interface can then be expressed as:

D. Upscaling
The surface energy ( ) and the nanoscale asymptotic force limit (F break) presented above can be used to quantify the relationship between the stress and the crack tip opening displacement at the interface, which acts as a bridge between the discrete atomistic model and the finite element model. The continuum epoxy–silica bilayer system can be visualized as a series of cross-linked polymer chains connected to the silica surface through the adhesion at the chain tail. Here, we try to simplify the cross-link network by imagining that it is a regular grid system with a grid size spacing equal to s as shown in Fig. 1. For each chain adhered to the silica surface, we can treat it as an individual WLC-based fracture model such that the mechanical properties of the single chain system can be evaluated. To predict the structural behavior of the bonded system in a larger length scale, these evaluated mechanical properties based on the single chain system are incorporated in the finite element model of epoxy–silica interface using the cohesive elements. These elements are formulated based on the concept of CZM, which was originally proposed by DugdaleReference Dugdale25 and Barenblatt.Reference Barenblatt, Dryden and Von Karman26 CZM was first introduced as a technique to study fracture or void nucleation in quasibrittle materials such as ceramic and concrete. CZM collectively describes all the mechanisms related to fracture, such as plastic deformation, void growth, and crack coalescence, in the process zone ahead of the crack tip; its structural behavior is governed by a given traction–separation relation. Conventionally, such a relation is calibrated with results from micromechanical modeling or experiments on fracture specimens of various configurations.Reference Au and Büyüköztürk1, Reference Elices, Guinea, Gomez and Planas27–Reference Qiao, Xu, Malla and Maji31 We provide an alternative approach for estimating the important parameters in defining a traction–separation relation based on the WLC-based fracture model from a nanoscale point of view that enables us to predict the global structural behavior of epoxy–silica interface (at the macroscale) using an appropriate finite element model.
The parameters characterizing the traction–separation relation include the initial stiffness, damage initiation threshold, and damage evolution properties. In general, the fracture toughness of a material system, which defines the damage evolution, can be measured experimentally in a reliable manner. However, the peak traction in the traction–separation relation and the initial stiffness of the cohesive element are usually hard to be determined and are adjusted by controlling the mesh density in the finite element model. Our WLC fracture model with parameters fed from the metadynamics approach enables us to determine the maximum debonding stress (σth), the fracture energy (Γs), and the Young’s Modulus (E) of the cohesive element. By considering the bonded area of each epoxy chain adhered onto the silica surface with the associated s value, σth can be predicted as F break/s.Reference Lau and Büyüköztürk2 Γs in this simplified grid system also depends on the parameter “s” and can be predicted by a theoretical one-dimensional fracture model as  , where H is the thickness of epoxy and G is the shear modulus of epoxy. Finally, E can be quantified by the equation
 , where k is the interfacial stiffness, which can be estimated by considering the second derivative of the FES with respect to the chosen CV, L is distance between the epoxy chain and the silica surface, and A o is the contacted area. After defining these three parameters, together with the linear assumption between stress and crack tip opening displacement at the interface, the traction–separation relation becomes well-defined and can be used in the finite element model accordingly.
III. RESULTS AND DISCUSSION
Figure 3(b) shows the FES of our system at different simulation times. By observing the free energy profiles, the well depth is getting deeper with convergence when the time of simulation is longer. Based on the simulation result shown in Fig. 3(b), the E b between the attached and the detached stages is 31.22 kcal/mol (21,688 × 10−23 J), which can be obtained using the above chosen Gaussian parameters using the simulation time of 100 ns. The parameter L o is measured as 21.44 Å. Based on the metadynamics approach, we obtain γs to be 101 pJ/m [1.46 kcal/(mol Å)] using Eq. (3), which is a material property for the epoxy–silica system. It is noted that in Eq. (4), there are only two model parameters, namely the surface energy at epoxy–silica interface (γs) and the persistence length of the epoxy chain ( ). Here, we choose
 = 0.5 nm, which is roughly half of the repeating unit length of the polymer chain, and T = 300 K (and a widely accepted good approximation). We find αcr = 0.873 and the corresponding asymptotic force limit is estimated to be F break = 134 pN. This force limit is comparable to that of hydrogen bond clusters as identified in earlier studies.Reference Keten and Buehler10 Under an assumed increase of the persistence length by a factor of four, the predicted rupture force only decreases by 14%. This implies that the dependence of rupture strength on the persistence length is weak, a phenomenon that has also been found in the study of other organic structures.Reference Keten and Buehler10
In the discrete grid model as shown in Fig. 1, we use a parameter s that defines the spacing of the grid system. The value of s depends on the distance between the two epoxide groups in one polymer chain that form cross-links as shown in Fig. 5(a). Here, we pick three different values of s for analysis, namely, 2, 4, and 8 nm, which are reasonable distances between two epoxide groups in an epoxy chain based on the reported cross-link density in several common types of epoxy.Reference Yarovsky and Evans32 By considering the bonded area of each epoxy chain adhered onto the silica surface with the associated s value, the corresponding maximum stress in the traction–separation relation can then be predicted as 33.5, 8.38, and 2.09 MPa, respectively, by σth = F break/s.Reference Lau and Büyüköztürk2 Before evaluating Γs, we need to know the thickness of the adhesive. Here, we use H to be 1 mm, which is a well-adopted thickness in civil engineering practices and G equals 1.923 GPa corresponding to the Young’s Modulus (E) = 5 GPa and the Poisson’s ratio (υ) = 0.3. The E value is taken from the MD result, which corresponds to the stiffness at the interface. In fact, it is noticed that the Young’s modulus of epoxy (from existing data, see, e.g., Ref. Reference May33) is very close to that of the interface predicted from the MD result. The corresponding fracture energies are 292, 18.2, 1.14 J/m2, respectively, with respect to the various chosen s values as shown above. The estimation of E requires the characterization of interfacial stiffness (k), which involves the second derivative of the FES with respect to the chosen CV. To avoid a large fluctuation of its second derivative due to a small variation in the FES, a harmonic function is used to fit the FES in the vicinity to the lowest free energy state, which corresponds to the attached stage as shown in Fig. 5(b). Based on the fitted harmonic curve, the second derivative of the FES with respect to the chosen CV is predicted to be 41.6 N/m. As mentioned previously, the debonding mechanism described by the FES refers to a homogenous debonding, which may not reflect the actual failure mechanism between epoxy polymer chain and silica. In view of this, we now study the sensitivity of our predicted strength to the variation of E. We perform a parametric study on E by considering that L changes from 1 to 5 Å with A o = 91.76 ÅReference Lau and Büyüköztürk2 (estimated from our atomistic model presented above). The calculated E ranges from 4.54 to 22.7 GPa, and it is noted that the predicted strength of our multiscale model is insensitive to the change of E within the above range.
(a) The derivation of the maximum stress in the traction–separation relation for the epoxy–silica interface by considering the tributary area (s × s) for a single epoxy chain and (b) the prediction of k by curve fitting from the MD data via a harmonic function.

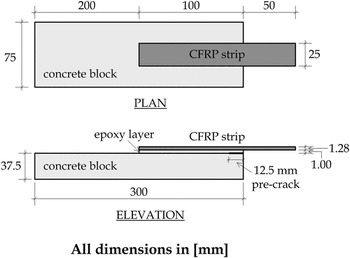
Our multiscale approach of modeling the epoxy–silica interface is then compared with the existing experiments. The experimental work involved epoxy-concrete interface. Since the research on atomic model of concrete is still ongoing, a reasonable and reliable atomic model should be chosen based on our best understanding. Concrete consists of cement, aggregates, and water and involves various crystallographic and amorphous materials inside. In this heterogeneous material system, silica is the major constituent material in concrete (about 40% by mass). The comparison between our simple epoxy–silica model and the complex epoxy–concrete system is believed to give us some key insights on complexity of a real interface problem. We set up a finite element model to describe an epoxy–concrete bonded specimen with the same dimensions and the same material properties of the constituent materials as reported in the literature.Reference Au and Büyüköztürk1 The finite element model is created based on the schematic diagram shown in Fig. 6. The interface between epoxy and concrete is modeled by two-dimensional cohesive elements and the corresponding traction–separation relation is characterized based on our predicted σth, Γs, and E from the above epoxy–silica bonded system. A linear softening in the traction–separation relation is adopted. The other constituent materials are modeled using plane strain elements and the assumption of perfect bonding between carbon fiber-reinforced polymer (CFRP) strip and epoxy is made since the CFRP–epoxy interface remained intact throughout that experiment. There are 10 cohesive elements per adjacent continuum element in the mesh according to the rule-of-thumb for choosing the size of cohesive elements.Reference Diehl34
Configuration of the interface fracture specimen that is tested by applying a peel load at the end of the CFRP strip.

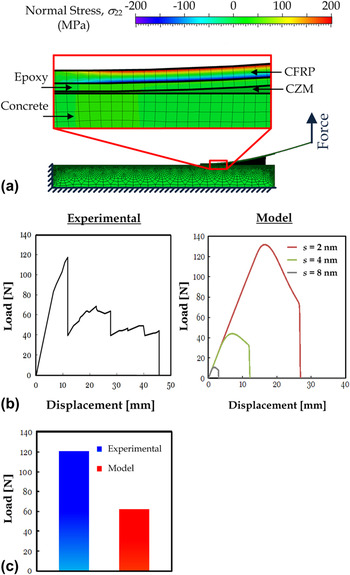
Figure 7(a) shows the stress distribution on the deformed bonded system and Fig. 7(b) shows the load–displacement curves from both the reported experimental data and our simulation result. Although there are variations of the predicted peak load from the three chosen s values, the agreement within the same order of magnitude implies that our model can be used as a preliminary prediction on mechanical properties of the epoxy–silica interface. The variation of predicted peak load implies that the macroscale strength at the interface is very sensitive to the density of the attached epoxy tail on the silica surface. It is an important observation, which can explain the general large deviation when characterizing the interfacial mechanical properties as the local effect of several polymer chains (spacing between them) may significantly affect the macroscale structural behavior. It should also be mentioned that there is no noticeable change in the predicted load–displacement curves within our concerned range of E values. The discrepancy between the experiment and modeling could potentially come from various reasons, including:
(i) The limitation of using a nonreactive force field CVFF, which may not be able to accurately describe the energy barrier for interface separation.
(ii) the difference in atomic structure between concrete and silica.
(iii) The possible defects at the material interface during the fabrication process.
(iv) The possible change of the material structures from nanoscale to macroscale.
(v) The effects of the mechanical interlock and the surface roughness, which are hard to be avoided in the macroscale experiment.
(vi) Plasticization that took place at and around the interface during to the bending process of FRP, cannot be represent in our model.Reference Au and Büyüköztürk2
Even though it is a rough comparison in view of the above reasons, the good agreement between our prediction and the experimental result with a difference in the peak load by a multiple of two as shown in Fig. 7(c) implies that the nanoscale rupture strength derived from the metadynamics approach, and the WLC-based fracture model is able to preliminarily predict to global structural behavior at a larger length scale. More importantly, such agreement indicates that the individual chain failure at the end of the epoxy chain attached on the silica surface is probably the origin leading to the global structural failure at the epoxy–silica interface. It also implies that the application of CVFF and the QEq method (i.e., insignificant change of partial charges during epoxy–silica interface separation) for describing the epoxy–silica interaction is feasible as a simplified approach. Table I summarizes the major predictions of the mechanical properties at the epoxy–silica interface based on our proposed approach.
(a) The stress (σyy) distribution of the specimen at the peak of the load–displacement curve. Separation between epoxy and the substrate can be captured by the deformation of the cohesive element as shown in the close-up. (b) The load–displacement curves from the predictive model and experiment [1] are shown. The peak of the load–displacement curve from the experiment is close to our prediction when s = 2 nm, which is a reasonable distance between adjacent cross-links for a fully cured epoxy. The good agreement between our prediction and the experimental result implies that our multiscale model of interface can provide a reasonable estimate of the global structural behavior of the epoxy–silica interface. (c) A quantitative comparison of between the maximum load measured from the experiment and the predicted average peak load based on the three chosen s values is shown using a bar plot.

Predictions of the material properties at epoxy–silica interface.

The applicability of our multiscale model has been demonstrated in epoxy–silica system. It is expected that our model can be applied to other polymer-mineral systems in which the simple grid system model can still describe the polymer network in the mesoscale. For a more robust modeling, the choice of force field and the calculation of partial charges should be studied carefully. Future studies could extend the theoretical framework reported here for capturing the effect of the surrounding (e.g., moisture) to the bonded system. The intrinsic strength presented here applies to the individual domains and can be linked up with the meso-, micro-, and macroscale levels with the capability to overcome both the timescale and length scale limitation in which our theoretical prediction may have interesting implications for designing mechanically strong material consisting organic–inorganic interfaces, such as the application in medical field including artificial bone and tissue.
IV. CONCLUSION
We have demonstrated the connection between atomistic and macroscale using epoxy–silica interface as an example. Our work outlines a possible approach using which the intrinsic strength of epoxy–silica interface derived from MD simulation can be used to predict the macroscale structural behavior at the interface. We found that the intrinsic strength at epoxy–silica interface is 134 pN at the single molecule level. This intrinsic strength was used to predict the global structural behavior of epoxy–silica interface by applying cohesive elements with an appropriate mesh in the finite element model and such an approach has been compared with the existing experimental data and a good agreement is obtained. The basic assumptions and the input parameters involved in the derivation are universal and may be used to explain the interfacial fracture phenomena in other organic–inorganic systems through a proper characterization of fracture energy and traction–separation relation at the interface. The use of metadynamics for reconstructing the FES of the system is an efficient method in finding the surface energy of an interfacial layer that can be broadly applied. Our predictive model may have interesting implications for designing mechanically strong interface consisting organic and inorganic materials, such as the application in medical field including artificial bone and tissue.
ACKNOWLEDGMENTS
This research was supported by the National Science Foundation through the Division of Civil and Mechanical Systems (CMS) Grant No. 0856325.