Introduction
In 2010, persons aged 60 years and over numbered 759 million worldwide and made up 11% of the global population (United Nations Department of Economic and Social Affairs, Population Division, 2010). By 2050, this age sector is expected to exceed two billion and to account for 21.8% of all people globally. Moreover, due to modernization-related declines in birth rate, rising life expectancy, and shifting patterns of migration, population aging is occurring most rapidly in developing countries (United Nations Fund for Population Activities (UNFPA) and AgeHelp International, 2012).
Mongolia, a still young but rapidly aging nation of about 3 million people, exemplifies this demographic transition. Between 2000 and 2010, the median age of the total population rose from 21.8 years to 25.4 years and the proportion of persons aged 60 years and over increased from 5.6% to 5.9%. The overall median age is projected to reach 30.6 years by 2025 and 35.2 years by 2050, and the share of persons aged 60 years and over now being 7%, will reach 10.0% and 20.1% respectively at these points. The primary reason for this trend is a precipitous drop in fertility rates from 7.0% in 1975 to 2.3% in 2000 – the largest decline in fertility in any country during the last quarter of 20th century. Net migration rates for the country are relatively low and stable, ranging from –1.2 during 2000–2005 to a projected –0.7 during 2050–2055 (United Nations High Commissioner for Human Rights, 2012).
Population dynamics are key factors as to how a country allocates resources to meet the needs of its citizens. In 2009, the government of Mongolia endorsed the National Strategy on Ageing, a multi-sectoral response to the needs of this expanding age group. The National Strategy reflects a growing concern that is seen in many developing countries, namely that rapid modernization has begun to erode the social status of older people and the longstanding protective and supportive functions of traditional family structures (Aboderin, Reference Aboderin2004). In Mongolia, for example, advanced age customarily confers high social status and older people are typically integrated with and cared for by their families. At present 64% of older Mongolians head a household and 87% of households that include an older adult are nuclear or extended. Yet the number of older adults who live alone increased by 72% between 2000 and 2010 (National Statistical Office of Mongolia, 2011).
The Office of the United Nations High Commissioner for Human Rights (2012) lists financial security as the main challenge faced by older Mongolians, whose usual sources of income have been their own earnings, family transfer of payments, and government grants in the form of social pensions and subsidies. Adult children and other kin do continue to support them, but this type of support is rapidly shrinking due to smaller family size, out-migration, and changing social norms. The Office of the United Nations High Commissioner goes on to note that these factors are central to the extent, integrity, and instrumental value of social networks. Widespread unemployment and underemployment make it difficult for older persons to find productive employment and earn their own income, and many are unable to enjoy decent livelihoods. A large number of older adults live in slum areas without clean water source, no central heating, and inadequate nutrition, while poor infrastructure and transport services impede participation in social life and active involvement in society.
These shifts echo the assertion of Berkman et al. (Reference Berkman, Glass, Brissette and Seeman2000) that social networks are embedded in and influenced by broader social and cultural contexts. Mongolia is the most sparsely populated of all independent nations in the world, and its ancient nomadic history was borne of and is sustained by high levels of interdependency. In the post-Soviet era, these norms and social practices have changed with rural-to-urban migration, as young people seek emerging economic opportunities, especially in the capital of Ulaanbaatar. Fully 41% of the country's population now lives in Ulaanbaatar, up from 36% in 2003. Another one-third of the population lives nomadic or semi-nomadic lives or else reside in aimag (provincial) centers or soums (aimag subsidiaries). The obvious geographic challenges of meeting the needs of older adults in this context are increasingly compounded by attenuated social networks (Tsogtsaikhan, Reference Tsogtsaikhan2008; Mujahid et al., Reference Mujahid, Namdaldagva and Banzragch2010).
Social networks are conceptualized as web of social relationships that surround an individual and the characteristics of those ties (Berkman et al., Reference Berkman, Glass, Brissette and Seeman2000). One of the most robust findings in social and behavioral science research with older adults is the strong association of social support networks with multiple types of health outcomes (for a review, see Umberson et al., Reference Umberson, Crosnoe and Reczek2010). The ability to assess and monitor changes in social networks within and across population groups and to establish important correlates and outcomes for research and clinical practice depends on appropriate measurement strategies. A search of English and Mongolian language social science and measurement literatures revealed no validated measures of social support networks, or any related constructs, for any age group in Mongolia. This study thus aims to identify, translate, and validate a suitable instrument for assessing the social support networks of older adults in Mongolia. All instruments, procedures, and protocols were approved by the appropriate institutional review board of the university.
Lubben Social Network Scale (LSNS-18)
The original Lubben Social Network Scale (LSNS; Lubben, Reference Lubben1988) was developed as a general measure of social ties to capture key features of an older adult's social network. There are now three versions of the scale (Lubben, Reference Lubben2012). A short version, the LSNS-6, measures the size, closeness, and frequency of contacts of a person's social network in terms of the perceived support they receive from family (three items) and friends (three items). The LSNS-R assesses the same perceptions of support, but has six items for family and six for friends. The LSNS-18 adds another six items that assess the same interactions, but with neighbors. Total scale scores are an equally weighted sum of all 18 items and range from 0 to 90.
We chose the LSNS-18 for several reasons. First, the LSNS was developed for use with older adults (Lubben, Reference Lubben1988) and a large body of literature has accumulated on its use with this population. Second, it is widely used to good effect in research and clinical settings within and beyond the United States (Lubben et al., Reference Lubben2006). We chose the 18-item version because it is preferred for social and health research (Lubben and Gironda, Reference Lubben, Gironda, Phillipson, Allan and Morgan2004; Sansoni et al., Reference Sansoni, Marosszeky, Sansoni and Fleming2010). Also, the LSNS-6, which is a more efficient screening tool, is a subset within the LSNS-18 (Lubben and Gironda, Reference Lubben, Gironda, Phillipson, Allan and Morgan2004). (Here we do not discuss the LSNS-6 except to note that its correlation with the Mongolian version of LSNS-18 is 0.81, p < 0.0001.) Lastly, to confirm the relevance of the neighbor subscale of the LSNS-18 in the Mongolian context, we asked respondents to define “neighbors.” Virtually all respondents described neighbors as the people who either “live next door” (in the ger district or countryside), “live near the same location” (saahalt-ail), or “live on, above, or below my floor.” We thus concluded that the LSNS-18 would be an appropriate choice for our purposes.
Methods
We used a two-stage process to develop a Mongolian version of the LSNS-18 (hereafter, LSNS-18-M; Appendix 1, available as supplementary material attached to the electronic version of this paper at www.journals.cambridge.org/jid_IPG). Using standard protocols for translating source language to target language, we first conducted English–Mongolian forward and back translations of the LSNS-18. We then field-tested the final Mongolian version in order to establish its psychometric properties.
Translation
Most standardized psychosocial instruments are developed in English-speaking, Western countries. Their use in multi-national research and clinical outcomes in other settings requires appropriate adaptations, including rigorous efforts to establish linguistic, conceptual, and metric equivalency (Guillemin et al., Reference Guillemin, Bombardier and Beaton1993). We discuss the metrics of the translated version below. To establish linguistic and conceptual equivalency, we followed Brislin's (Reference Brislin, Lonner and Berry1986) six-step translation model as follows:
1. Two professional bilingual translators independently translated the LSNS-18 from English to Mongolian.
2. A translation consensus committee of two new bilingual translators and one Mongolian researcher at the National University of Mongolia's School of Mongolian Language and Culture compared the two translations, reconciled discrepancies, and agreed on a target-language version that best reflected language and concepts of the source instrument.
3. A focus group comprising two geriatric specialists and four older adult volunteers from the community assessed the linguistic and cultural equivalency of the consensus version of the LSNS-18-M. This 90-minute discussion was audiotaped and a close review of the verbatim transcript led to a few minor changes in wording.
4. Two English-fluent translators who had social science research experience and were blind to the original English LSNS-18 back-translated the LSNS-18-M to English. The two versions were very similar, but a few items were changed slightly to reflect structural differences in the Mongolian language. Items 6, 12, and 18, for instance, were translated as “How often does one of your [relatives/neighbors/friends] consult when you make an important decision?” whereas the original stated “How often is one of your friends available for you when you have an important decision to make?”
5. The second translation consensus committee consisting of two bilingual translators and two Mongolian researchers from the Department of Foreign Language at the Health Sciences University of Mongolia compared the two translated versions of the instrument with the original version and reconciled minor inaccuracies in the Mongolian version.
6. The final version of the LSNS-18-M was piloted with 21 older adults at the community-based Gerontology Center in Ulaanbaatar. Trained interviewers used extensive probes to reach a final consensus on the meaning of each item. No additional modifications were required. The final version of the LSNS-18-M appears in Appendix 1.
Field study
Study site and sample
The Labor Law of the Mongolian People's Republic, enacted in 1973, mandates a retirement age of 55 years for women and 60 years for men. Referencing these thresholds, we recruited a convenience sample of 110 women aged ≥55 years and 88 men aged ≥60 years from the patient populations of six community hospitals in Ulaanbaatar in January and February 2012. Health professionals who referred the patients to the study judged them to be cognitively and physically capable of providing informed consent and participating in the study. Beyond this capacity, age was the sole inclusion criteria.
We aimed for a total sample size of 200 in order to achieve a subject to variable (STV) ratio within recommended guidelines of at least ten cases per item in the instrument (Arrindell and van der Ende, Reference Arrindell and van der Ende1985). We recruited 201 participants, but dropped three persons who did not meet the age criterion. The final 198 participants yielded an STV ratio of 11 for the 18-item scale. All individuals who were invited to join the study did so; none were compensated. Thirty patients were recruited from the study sample for a re-test of the LSNS-18-M either nine or ten days after the initial administration. Of this group, 28 patients completed the re-test.
With respect to the sample, the average age was 68.1 (SD = 8.1) to 66.4 (SD = 8.6) years for women, and 70.1 years (SD = 7.1) for men. About half of the participants were aged ≥65 years; about the same proportion were females, married, and had completed either vocational or university tertiary education. Although rural Mongolians often seek healthcare services in the capital, the large majority of the sample lived in Ulaanbaatar. These distributions essentially reflect the population of older Mongolians (National Statistical Office of Mongolia, 2011). There were no significant differences in the demographic characteristics of the overall sample and the subsample that completed the LSNS-18-M re-test. With respect to health status, participants tended to have been hospitalized for reasons associated with longstanding (10+ years duration) primary or secondary diagnoses of circulatory system diseases – 63% heart disease, 36% hypertension, and 5% stroke (not shown in table). These rates are similar to the rates of a recent epidemiological study of 1,207 older people from Ulaanbaatar and four other regions of the country in which 83% of community-dwelling older Mongolians had at least one circulatory system disease (Ragchaa, Reference Ragchaa2012).
Data collection
A trained research assistant conducted structured face-to-face interviews with study participants in the hospital. The research assistant collected data on sociodemographics, social support networks, health and functional status, depressive symptoms, and social isolation.
Measures
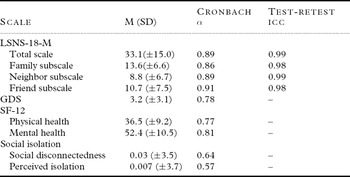
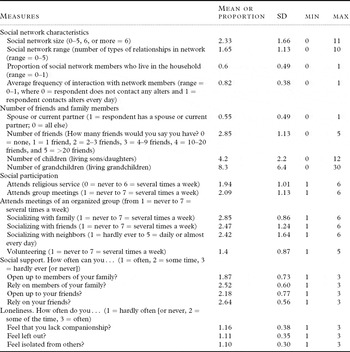
This section describes how measures were operationalized. We have selected measures which have performed consistently well with older adults across a wide range of cultural and language groups. Table 1 presents means, standard deviations, and Cronbach α coefficients for all measures except the overall and subscale statistics for social isolation, which are given in Table 2.
Key variables descriptive statistics (n = 198) and ICC for test-retest subsample (n = 27)

Summary statistics for indicators of social isolationa

aAdapted from National Social Life, Health and Aging Project (see Cornwell and Waite Reference Cornwell and Waite2009).
Lubben Social Network Scale-18 (LSNS-18; Lubben and Gironda, Reference Lubben, Gironda, Phillipson, Allan and Morgan2004):
The LSNS-18 has three subscales: family, friends, and neighbors. Six items in each subscale assess the respondent's network size, frequency of contact, and level of reciprocal support. As noted, the total score is an equally weighted sum of all 18 items (range = 0–90). Higher scores indicate stronger networks.
Geriatric Depression Scale (GDS-15; Sheikh and Yesavage, Reference Sheikh, Yesavage and Brink1986):
The GDS-15 is a brief version of the 30-item Geriatric Depression Scale, a widely used screening tool for depressive symptoms in older adults (Yesavage et al., Reference Yesavage1983). The GDS-15 has a yes/no response option; scores of 0–4 are considered normal; 5–8 indicate mild depression; 9–11 suggest moderate depression, and 12–15 indicate severe depression. Validity and reliability are well documented in practice and research settings, with sensitivity of 92% and specificity of 89% evaluated against International Classification of Diseases, Tenth Revision (ICD-10) and Diagnostic and Statistical Manual of Mental Disorders, 4th Edition (DSM-IV) criteria. The GDS-15 is widely used with healthy, medically ill, and mild-to-moderately impaired older adults in community, acute, and institutional settings. It has been used effectively in non-Western settings (e.g., Almeida and Almeida, Reference Almeida and Almeida1999), with rural and low-literacy populations (Ganguli et al., Reference Ganguli, Dube, Johnston, Pandav, Chandra and Dodge1999), and with older adult immigrants from a range of Asian-origin groups in the United States (Mui et al., Reference Mui, Kang, Chen and Domanski2003).
Short Form-12 (SF-12; Ware et al., Reference Ware, Kosinski and Keller1996):
The SF-12 is a subset of the Medical Outcome Study SF-36. The SF-12 has 12 items with varying Likert-type response formats, which yield a generic measure of health status. Respondents are asked to rate how they have felt in the previous week in the following eight domains: physical functioning (two items), role limitations due to physical health problems (two items), bodily pain (one item), general health (one item), vitality (energy/ fatigue; one item), social functioning (one item), role limitations due to emotional problems (two items), and mental health (psychological distress and psychological well-being; two items). Scoring algorithms for the SF-12 yield a Physical Health Component (PHC) and a Mental Health Component (MHC). Composite scores for PHC and MHC range from 0 (lowest) to 100 (highest) levels of health. The SF-12 is used worldwide and has excellent psychometric properties when employed with older adults (Resnick and Nahm, Reference Resnick and Nahm2001).
Social Isolation (Cornwell and Waite, Reference Cornwell and Waite2009):
Measures of social isolation should encompass both objective and subjective indicators. Using data from the National Social Life, Health and Aging Project, Cornwell and Waite developed a measure of social isolation that comprises subscales of these two categories of indicators. Objective isolation refers to social disconnectedness or physical separation from others. Eight items are used to assess two main dimensions of objective isolation, i.e., poor social networks and low participation in social activities. Four items are from the General Social Survey: social network size, social network range, proportion of alters living in the home, and average frequency of interaction with network members. The other four items are number of friends and three indicators of social participation: attend meetings of an organized group, socialize with family and friends, and volunteer. According to Cornwall and Waite, we standardized and averaged these items to create a scale, reverse-scoring original variables since they measured connectedness rather than isolation. Standardized scores on the social disconnectedness scale ranged from –1.9 to 1.16 with a weighted mean of 0.001 (SD = 0.62). Higher scores indicate greater isolation.
The subjective component of social isolation was assessed using a seven-item perceived isolation scale that also has two core dimensions, i.e., lack of social support and loneliness. Social support was measured with the following four items from the 2002 Health and Retirement Study: open up to family, rely on family, open up to friends, and rely on friends. Loneliness was evaluated by the following three items: feel that you lack companionship, feel isolated, and feel left out (see Hughes et al., Reference Hughes, Waite, Hawkley and Cacioppo2004). Perceived isolation scores ranged from –0.76 to 1.89, with a weighted Mean of 0.0 (SD = 0.47). Higher scores indicate greater perceived isolation.
Data analysis
Data were analyzed using SPSS 19.0 and Stata 12.0. Reliability of the LSNS-18-M was assessed in terms of internal consistency (Cronbach's α coefficient > 0.7; Streiner and Norman, Reference Streiner and Norman2003) and test-retest (intraclass correlation coefficient (ICC)) > 0.75 (Portney and Watkins, Reference Portney, Watkins, Portnoy and Watkins1993).
For construct validity, we used exploratory factor analysis and evaluated convergent validity and discriminant validity. We first performed a Kaiser–Meyer–Olkin (KMO) and Bartlett's test of sphericity to determine the adequacy of the data for factor analysis. A KMO of >0.9 is deemed excellent adequacy, 0.7–0.9 is common adequacy, and <0.5 is inadequacy (Pett et al., Reference Pett, Lackey and Sullivan2003). We then used principal component analysis with varimax rotation to examine the factor structure of the LSNS-18-M, basing number of factors extracted on the scree plot, eigenvalues > 1.0, percentage of explained variance, and factor interpretability.
To assess convergent validity, we examined Pearson's correlation coefficients for the LSNS-18-M and the following four variables that were expected to correlate with it: Social Disconnectedness, Perceived Isolation and GDS-15 scores (each negatively), and SF-12 PHC and MHC subscales (positively). To evaluate discriminant validity, we first divided scores of Social Disconnectedness and Perceived Isolation scales into low, medium, and high terciles. We then used one-way ANOVA with Tukey HSD post hoc tests to compare mean scores on the LSNS-18-M among the three levels of disconnectedness and the three levels of perceived isolation.
Lacking a gold standard measure of social integration against which to compare the LSNS-18-M, we were unable to establish the instrument's sensitivity and specificity. However, we explored potential cut points based on standards used in three previous studies. Lubben (Reference Lubben1988) proposed a cut point of 20 out of 50 possible points for the original ten-item LSNS. This point demarcated the lower quartile of scores and was associated with longer hospital stays for older adults in the study. In the second study, Rubinstein and colleagues (Reference Rubinstein, Lubben and Mintzer1994) estimated a 10–15% point prevalence of individuals at risk for social isolation using the LSNS-6 with a group of a community-dwelling older adults. Lastly, in a study designed to validate the LSNS-6 with a sample of community-dwelling older adults in three European countries, Lubben et al. (Reference Lubben2006) proposed a cut point based on the concept of “lack of redundancy in social ties.” This approach holds that risk stems from inadequacy in the structure of networks (too few people per network category, e.g., no one to call on for help), and in their function (more people concentrated in fewer categories, e.g., no family but many friends).
Redundancy is defined as at least two people in each of the three categories of family and at least two people in each of the three categories of friends – yielding a cut point of 12 out of 30 possible points. Following this logic, redundancy in the LSNS-18-M would require a minimum score of 2 for each item in family, friend, and neighbor categories. For example, for kin ties, a person would have to hear from at least two relatives at least once a month, see or hear from the relative with whom they have the most contact at least a few times a month, feel at ease talking with at least two relatives about private matters, etc. Drawing on the previous studies, we explored three possible cut points for the LSNS-18-M: the lower quartile of scores; a point prevalence of 10–15%; and the logic of redundancy in social ties.
Results
Reliability
The Cronbach's α coefficient was 0.89 for the total LSNS-18-M (subscales ranged from 0.86 to 0.91). The ICC for test-retest scores was 0.99, indicating very high reliability.
Construct validity
Exploratory factor analysis
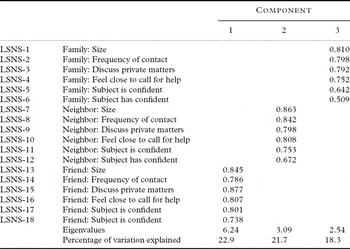
The KMO was 0.83 and the Bartlett test was significant (χ 2 = 2,327.58, df = 153, p < 0.0001). Table 3 presents factor loadings, eigenvalues, and percentage of explained variance for factor analysis. Items in the LSNS-18-M loaded cleanly on the same three factors as the original LSNS-18: relatives, neighbors, and friends. Inter-factor correlations ranged from 0.23 (family and neighbors) to 0.77 (family and friends), and all were significant at p < 0.01 level. All three factors also correlated with LSNS-18-M scores at p < 0.001 and together they accounted for almost two-thirds of the variance in total LSNS-18 scores.
Factor analysis of LSNS-18-M

Convergent validity
Scores on the LSNS-18-M were correlated in the expected direction with the Social Disconnectedness (r = –0.55, p < 0.001) and Perceived Isolation (r = –0.65, p < 0.001) scales and with the GDS-15 (r = –0.31, p < 0.001). The LSNS-18-M was not associated with the PHC or MHC subscales of the SF-12. It was inversely related to self-rated health (SRH) status, a widely used single item indicator of health (r = –27, p < 0.01). The family subscale was associated with the MHS (r = 0.17, p < 0.05), and the friend subscale was related to the PHS (r = 0.22, p < 0.01).
Discriminant validity
Mean scores on the LSNS-18-M differed significantly for the three levels of Social Disconnectedness scale (F (2, 190) = 20.25, p < 0.0001) and the three levels of Perceived Isolation scale (F (2, 196) = 49.15, p < 0.0001). With one exception, post hoc Tukey's HSD tests were significant (p < 0.01) for all pairwise comparisons for both scales. The difference between LSNS-18-M scores for the medium and high levels of disconnectedness was not significant (p = 0.07).
Cut point analysis
Explorations of a cut point for the LSNS-18-M to assess risk of social isolation among older Mongolians were inconclusive. Following Lubben et al. (Reference Lubben2006), summing minimum scores of 2 for all 18 items yielded a cut point of 36, or 40% of a possible 90 points. Although consistent with cut points for the original LSNS (20 out of 50) and the LSNS-6 (12 out of 30), these results were least satisfactory. Full 60% of the sample scored below 36 on the LSNS-18-M, meaning that three out of five participants would deemed to be at risk of isolation. The upper limit of the lowest quartile for LSNS-18-M scores was 22 and a point prevalence of 13.6 (the proportion between 10% and 15%) suggested a cut point of 16. One in five participants scored below 22 points and one in ten scored below 16 points. Independent samples’ t-tests used to explore mean differences on the Social Disconnectedness and Perceived Isolation scales by proposed cut point were significant and did not point to a preferred threshold.
Conclusions
The purpose of this study was to identify an appropriate standardized measure of social isolation and to translate and validate the measure for use in research and practice with older adults in Mongolia. We selected the LSNS-18, a widely used measure of social integration, followed standard translation protocols to establish linguistic and conceptual equivalency of English and Mongolian versions of the instrument, and evaluated the psychometric properties of the Mongolian version with 198 community-dwelling older adults who were hospitalized for chronic health conditions in Ulaanbaatar. The Mongolian version of the LSNS-18 appeared to be acceptable and well tolerated; all persons who were approached for the study agreed to participate, none dropped out, and less than 1% of data were missing.
The sample was demographically heterogeneous. Age of participants ranged from 55 years to 92 years, about half were males and half females, and the health status and chronic health conditions for which study participants were hospitalized were similar to those of the general older population. Prior studies show that socially isolated older people are at greater risk of being re-hospitalized within one year than those who have strong network ties (Mistry et al., Reference Mistry, Rosansky, McGuire, McDermott and Jarvik2001; Rodríguez-Artalejo et al., Reference Rodríguez-Artalejo2006). We thus cannot dismiss the possibility that the sample is unique in ways related to their hospitalization, nor can we surmise how the LSNS-18-M might perform among non-hospitalized older adults.
Likewise, the adequacy of the LSNS-18-M with older adults with lower levels of formal education and those in rural areas, including nomadic and semi-nomadic people, should be determined. Mongolia has near universal literacy, having benefited from compulsory primary education under the communist regime in the 20th century. However, levels of education vary, especially between urban and rural populations, and may well have diverged further since the Soviet era. One quarter of respondents in our sample had completed university and 30% had less than primary education; this compares with 11% and 54% respectively in a recent nationally representative sample of 1,207 older Mongolians (Ragchaa, Reference Ragchaa2012). In order to begin to address these questions, we have initiated a replication of the current study with a larger sample of non-hospitalized older persons in Ulaanbaatar and with those who reside in the rural countryside.
A rigorous translation process helped ensure the equivalence of English and Mongolian language versions of the LSNS-18 and the latter displayed excellent psychometric properties overall. The data suggested good construct validity. The LSNS-18-M items were loaded on the same three factors as the original scale, factors were significantly inter-correlated and associated with the overall scale, and accounted for two-thirds of the variance in total scale scores.
Tests for convergent validity were also favorable, but less clear. As expected, the LSNS-18-M scores were inversely associated with lower scores on the GDS-15 and the two social isolation subscales. The LSNS-18-M was also significantly correlated with a robust single-item measure of SRH status. Given the extensive body of research linking social support networks and health in later life, it was surprising that the LSNS-18-M was not associated with either physical or mental health subscales of the SF-12. Quality Metric (2012), which governs use of Short-Form measures from the Medical Outcomes Study, lists 80 countries and 130 languages for the SF-12. Mongolia is not among them and it is unclear how well the scale captures the physical and mental health dynamics of Mongolian older adults. We expect to gain greater clarity on these measurement issues in a larger replication study that is underway.
Significant correlations of the LSNS-18-M with SRH and the GDS-15 suggest that social networks are in fact related to physical and mental health status. SRH is used extensively in population health surveys to approximate clinical health status and to measure health-related quality of life, and numerous studies support its predictive validity for future health, functional decline, disability, and mortality in older populations (Arnadottir et al., Reference Arnadottir, Gunnarsdottir, Stenlund and Lundin-Olsson2011). On the other hand, a growing body of international research on the referents, which ethnically and nationally diverse groups of people use to assess their health, suggests that they differ in self-perceptions of health, conceptualizations of what constitutes health, and determinants that contribute to self-assessments of health (Chandola and Jenkinson, Reference Chandola and Jenkinson2010; Bombak and Bruce, Reference Bombak and Bruce2012).
Brief SF-12 may be too crude to account for complex cultural influences on the associations of social networks and well-being. Indeed, associations of the LSNS-18-M family subscale with the MHS, and that of the friend subscale with the PHS imply that domains of social support networks and well-being may be associated specifically rather than generically. To permit cross-national comparisons and to be in a position to use physical and mental health outcomes for planning and monitoring practice, policy and research requires validated standardized measures of physical and mental health status. One suggestion going forward is to explore the performance of the SF-36 alongside the SF-12 with older Mongolians.
With respect to discriminant validity, the LSNS-18-M successfully discriminated among high, medium, and low levels of Social Disconnectedness, and among three comparable levels of Perceived Isolation. All pair-wise comparisons were also significant, showing the scales’ ability to distinguish between finely adjacent levels and more spread out degrees of social isolation. Knowing that level of LSNS-18-M scores can be discerned by a standardized measure of isolation can help in clinical practice, especially in the absence of an established cut point.
Lack of a gold standard for measuring social integration among older adults precluded our use of standard procedures to establish sensitivity, specificity, and positive and negative predictive values. This remains a measurement challenge for researchers and clinicians in the area of social networks, but it need not negate the value of using a well-established scale such as the LSNS. The scale is a valuable tool for practitioners to assess and monitor the changing status of social isolation among individual older adults, and also among changing communities. The close association between the LSNS-18 scores and physical and mental health outcomes also make this scale a worthwhile instrument for prevention intervention strategies. Finally, although there is not a definitive cut point for the LSNS-18, clinicians can reasonably determine from the scale when older adults are in serious jeopardy of social isolation. Collecting systematic data on the scale's use will advance knowledge on the instrument and its performance in different contexts. Confirmatory factor analysis and advances in item response theory are promising for future studies (Carle et al., Reference Carle, Blumberg, Moore and Kassim2011).
Finally, it is important to reiterate that the sample was a hospitalized group of mainly urban older adults. Future studies should extend use and validation of the scale to non-hospitalized and rural older adults in Mongolia and to Mongolian speakers who live outside the country. Meanwhile, the LSNS-18-M has excellent reliability and satisfactory validity and holds significant promise for assessing social isolation among older adults in Mongolia.
Conflict of interest
None.
Description of authors’ roles
The two authors jointly formulated the research question, designed the study, and analyzed the data. Dr. Myagjarmav developed the data collection instrument and trained and supervised data collection and data processing. Burnette wrote the paper.