I. INTRODUCTION
Damage from crystallization of salt and/or ice inside porous materials is implicated in the sculpting of mountains (geomorphology), deterioration of monuments, civil buildings, underground constructions, and highways, as well as in frost heave in soil. The mechanisms of salt damage to porous materials have been extensively studied in recent years.Reference Evans1–Reference Espinosa-Marzal and Scherer15 The intensity of stress and damage depends strongly on salt type, environmental conditions, and material properties, such as porosity and mineralogy; however, the interactions between these factors are not fully understoodReference Goudie and Viles16, Reference Doehne, Siegesmund, Vollbrecht and Weiss17 and therefore prediction and prevention of salt damage are still not possible.
The thermodynamics of crystal growth has been studied since the 19th century,Reference Loewel18 and early experiments clearly demonstrated the potential of crystals to exert destructive stress.Reference Loewel18–Reference Taber21 In 1939, Correns and Steinborn proposed an equation to quantify the pressure exerted by the salt as a function of solution supersaturation.Reference Correns and Steinborn22–Reference Flatt, Steiger and Scherer24 Recently, several authors have extended the analysis to apply to hydrated salt crystallization in porous materials.Reference Flatt7, Reference Coussy9, Reference Steiger25, Reference Steiger26 For the pore size of interest in this work (>100 nm), the maximum crystallization pressure, ΔP c,Reference Steiger25 is given by

where V c is the molar volume of crystal in m3/mol, R is the gas constant in J/mol·K, T is the temperature in K, and β is the supersaturation ratio, which is the ratio between ion activity product and solubility product. In a non-equilibrium state, a high transient crystallization pressure can be exerted due to crystal growth in the presence of high supersaturation ratios.Reference Rodriguez-Navarro and Doehne5, Reference Scherer8, Reference Steiger and Asmussen12, Reference Espinosa, Franke and Deckelmann27 Growth of crystals consumes the supersaturation, and so the crystallization pressure decreases as equilibrium is established. However, as long as supersaturation exists between crystal and pore wall, the crystals can exert stresses on the pore walls.
Sodium sulfate has been investigated intensively due to its exceptional ability to cause damage to porous materials. The anhydrate (Na2SO4, thenardite, 53.1 cm3/mol) forms easily by dehydration of the hydrated phases. When water (ground water or rain water) comes into contact with thenardite, the salt dissolves. A solution saturated with thenardite is significantly supersaturated with respect to sodium sulfate decahydrate (Na2SO4·10H2O, mirabilite, 219.8 cm3/mol), high crystallization pressure is exerted as mirabilite precipitates, eventually resulting in damage.Reference Flatt7, Reference Steiger and Asmussen12, Reference Chatterji and Jensen28, Reference Tsui, Flatt and Scherer29 Wetting–drying cycles of sodium sulfate impregnated stones are frequently used in laboratory studies of salt decay of rocksReference Goudie3, Reference Cooke30 (and many other references summarized by EvansReference Evans1) and in durability tests of construction materials.31, 32
In this work, we investigate the stress evolution in two limestones with different pore structures: Indiana limestone (IL) and Cordova Cream limestone (CCL), during the crystallization of sodium sulfate. We use the theory of poromechanicsReference Coussy9, Reference Coussy33 to infer the crystallization pressure from the observed strain during crystallization of the salt.
II. MATERIALS AND METHODS
A. Material characterization
The pore size distribution was obtained by mercury intrusion porosimetry (Autopore 9420; Micromeritics, Norcross, GA), and the pore surface area was determined by nitrogen adsorption (Asap 2010, Micromeritics). The total pore volume accessible to water was measured from the weight gain of five samples of IL and CCL (13-mm height and 8-mm diameter) placed in a desiccator, which was evacuated and then filled with water. Weight gain was also measured following spontaneous saturation with water by capillary suction to evaluate the extent of air trapping during imbibition of salt solutions.
To justify the attribution of measured strains to crystallization pressure, we must insure that aqueous solutions do not cause spontaneous expansion (i.e., hygric swelling from clays presentReference van Olphen34) of the limestone. Hygric swelling upon saturation with water was measured with a linear variable differential transformer (LVDT, Macrosensors, Pennsauken, NJ) (with a tolerance of ±0.2 μm; GSA 750 series), a signal conditioner (LPC2100), and a data acquisition system [pDAQ (Iotech, Cleveland, OH) and the software DASYLab].
The tensile strength of the stones was measured by the splitting test performed on eight cylinders (5 cm in height × 2 cm in diameter) in a mechanical testing machine (INSTRON, Norwood, MA). The static Young’s modulus was measured by using a beam-bending apparatusReference Vichit-Vadakan and Scherer35 to apply a sawtooth deflection at a low frequency (0.05 Hz)Reference Scherer, Jiménez González and Turkington36 and a load smaller than 900 g to a dry plate (20 × 2 × 1 cm3) of stone. The measurement was repeated on a sample that was saturated by immersion in water for 24 h. The samples were then dried and impregnated with sodium sulfate solution (20 g Na2SO4 per 100 g water, abbreviated as 20% w/w = 16.7 wt% = 1.41 mol/kg water). After drying at 105 °C, the modulus of the thenardite-bearing stones was determined.
For the sorptivity test, samples were cut to 2.5 × 2.5 × 5 cm3, dried at 105 °C, and the four 2.5 × 5 cm2 surfaces were coated with epoxy to avoid evaporation during capillary uptake. The upper surface was left uncoated to allow air to escape. Through numerical modeling of this test, the permeability of the capillary saturated stones was obtained: the capillary pressure within the wet front was calculated by the Laplace equation with the average pore radius of each stone and the permeability was determined by fitting calculated and measured water uptake in the stone. After reaching a constant weight from capillary uptake of water, the bottom surface of the stone was also coated, such that evaporation could only take place through one surface (2.5 × 2.5 cm2). Drying proceeded at 30 ± 2% relative humidity and 22 ± 1.5 °C, and the weight loss was recorded with time.
To study pore clogging induced by thenardite in the warping samples, stone plates with dimensions 2.5 × 1 × 10 cm3 were saturated with sodium sulfate solution (20 and 40% w/w) and dried at 105 °C. The capillary uptake of both decane and water through the 2.5 × 10 cm2 surface was measured to mimic wetting during the warping experiment. Decane was used to avoid dissolving thenardite crystals and therefore to measure the influence of porosity reduction on liquid transport through the pore network. The difference between the capillary uptake of decane in the salt-contaminated sample and in the reference (salt-free) sample reveals the degree of pore clogging.Reference Espinosa-Marzal and Scherer15 When water is absorbed, thenardite dissolves and mirabilite forms in the pores, changing the pore filling and, consequently, the resistance to uptake of the solution.
B. Warping
The warping experiment involves measuring the deflection of a limestone–glass planar composite during the formation of mirabilite following thenardite dissolution. From the deflection, we can calculate the crystallization pressure exerted by the crystals confined in the pores. The glass plate reduces damage by inhibiting expansion and amplifies the sensitivity of the measurement by turning a small strain into a large deflection.
Plates (10 × 2.5 × 1 cm3) of CCL and IL were saturated with sodium sulfate solutions of concentration 12, 20, and 40% w/w. Mass of thenardite in the stone was measured gravimetrically after drying at 105 °C and expressed as the ratio between the volume of the precipitated salt and the total porosity. The percentage of the pore space filled with thenardite after drying was: φ = 4.71 ± 0.48, 5.28 ± 0.75, and 9.32 ± 0.75 vol% in CCL and φ = 3.91 ± 0.29, 5.02 ± 0.18, and 9.92 ± 0.47 vol% in IL, respectively. All warping experiments were performed at 22 ± 1.5 °C. Efflorescence after drying was insignificant, but the samples were brushed before further manipulation. The salt-bearing stone plates were glued to a plate of borosilicate glass (3-mm thickness) using epoxy (thickness ∼0.5 mm; Epoxy 907 Adhesive System, Miller-Stephenson Chemical Co., Sylmar, CA). The softening time of the epoxy in water was 15 h.
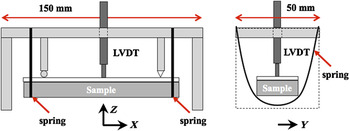
The sample was mounted in a frame and held against a knife-edge and ball bearing support by two springs, so that the glass was in contact with an LVDT (Fig. 1). The setup was placed in a desiccator and evacuated to avoid trapping gas during rewetting. Water or Na2SO4 solution (20% w/w) was then pumped into the desiccator until the bottom surface of the sample just touched the liquid. Although the solution was being absorbed into the stone by capillary suction, the LVDT measured the deflection of the sample as it warped.
Warping setup showing a typical sample mounted in a spring clip with a linear variable differential transformer positioned above the glass plate of the limestone–glass composite to measure deflection as the sample is exposed to aqueous solution. x, y, and z are the orthogonal directions used for synchrotron x-ray analysis.

The deformation of stone samples during drying-induced crystallization of thenardite was measured using a Dynamic Mechanical Analyzer (DMA 7e, Perkin Elmer, San Jose, CA). The goal was to evaluate the stress induced in the stone by crystallization of thenardite during preliminary drying at 105 °C, before the warping experiment. The description of this experiment and the measured deformation can be found in the supplement of this work. Access supplementary material online at http://journals.cambridge.org/jmr.
C. Analysis of salt distribution by synchrotron radiation
Synchrotron x-ray diffraction using hard x-rays was used to determine the spatial distribution of thenardite in dry samples and to identify the phases produced on rewetting. All work was carried out on beamline 16.4 at Daresbury Laboratory (United Kingdom) in energy dispersive mode using a three-element detector system for data collection and a polychromatic beam of energies in the range 20–90 keV. This gives a penetration depth of ∼25 mm of intact sedimentary rock. The samples examined were plates of IL with an average volume fraction of thenardite of 9.46 vol%. From the analysis of a series of calcite/thenardite mixtures, we found that 7.65 vol% thenardite was detectable. The x-ray station temperature was 21–22 °C.
The distribution of thenardite in a dry IL–glass composite was obtained from x-ray diffraction patterns by a two-dimensional scan along a 10-mm length of the sample (along x in Fig. 1) and through the entire 11-mm thickness (z). Patterns were collected in a row at 1-mm intervals along 10 mm in the x-direction and the row was repeated every 0.01 mm down the 11-mm sample thickness (in the z-direction). The 11 patterns collected along the sample were summed to achieve better sample statistics, as no sample rotation was possible, producing a sum pattern for every 0.01 mm of the 11-mm thickness. A remotely activated solenoid valve allowed the water level in the desiccator to rise to the bottom surface of the sample while patterns were collected. During wetting, patterns were collected every 1 mm along 10 mm of the sample (x-direction in Fig. 1), starting from 0.75 mm below the glass plate and moving down 0.48 mm in z-direction. This short travel in z-direction was intended to examine only a thenardite-rich area of the sample (just below the glass) as it was exposed to water. Patterns forming a row in x-direction were summed producing a summed pattern for each point in z-direction.
III. EXPERIMENTAL RESULTS
A. Material characterization
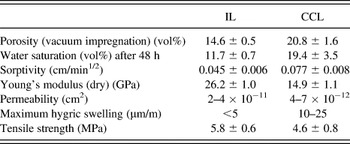
IL and CCL are both carbonate rocks, mainly composed of calcite (>97.3%). Table I shows that capillary saturation of IL is significantly smaller than that obtained by vacuum impregnation, because of trapped air. The lower water saturation of IL results in a lower salt content compared to CCL, when impregnated with the same solution. The scatter of the measured values is high, which is to be expected for rocks and other natural materials.
Material properties of Cordova Cream limestone (CCL) and Indiana limestone (IL).

CCL and IL have bimodal pore size distributions with peaks at 0.24 and 2.43 μm in CCL and 0.29 and 27 μm in IL. Despite the larger porosity of CCL, most pores in CCL are smaller than 10 μm, whereas in IL a significant fraction of the pores are larger.Reference Espinosa-Marzal and Scherer14 Capillary uptake and drying are slower in IL than in CCL, in spite of the smaller average pore size of CCL. Pore level simulations have shown that moisture transport is determined not only by the pore size distribution but also by the connectivity between pores of different sizes.Reference Metzger, Irawan and Tsotsas37 Thus, in the case of a bimodal pore size distribution, the presence of macropores connected to a continuous network of smaller pores leads to slower moisture transport than in a material with continuous macroporosity. This type of structure is consistent with the large amount of air trapped in IL and can explain the more efficient capillary uptake and drying of the CCL samples.
The results of the pore clogging test performed with decane for CCL and IL with a similar volume fraction of thenardite (φ ∼ 5.28 vol% in CCL and 5.02 vol% in IL) show that the uptake of decane in the stones is only slightly reduced by thenardite. In contrast, when water invades the pores, initially a slower liquid uptake is observed while thenardite dissolves in the pore liquid and mirabilite (see Sec. III. B.) precipitates concurrently. Mirabilite has a higher molar volume and consequently the pore filling increases. Mirabilite crystals accumulate gradually on the top surface of both stones, allowing pore space initially filled by salt to be gradually filled by water. This leads to the progressive increase in liquid uptake. As expected, samples with higher salt content (φ ∼ 9.9 vol% in IL and 9.3 vol% in CCL) show greater resistance to water uptake. The sorptivity of IL is more dramatically reduced by mirabilite formation than that of CCL, indicating more pore clogging in IL.
During water imbibition, the measured expansion (i.e., hygric strain) of IL samples is smaller than the resolution of the LVDT (<4 μm/m) and therefore negligible. In contrast, a significant hygric expansion of 10–25 μm/m is measured for CCL, which could not be attributed to the presence of clay (see supplementary materials).
The measured Young’s modulus E and the tensile strength σT of the salt-free stones are shown in Table I. The uniaxial tensile failure strain is εT = σT/E = 221 ± 23 μm/m for CCL and 308 ± 53 μm/m for IL. The bulk modulus, K, was calculated assuming linear elasticity, with Poisson’s ratio ν = 0.26 for both stonesReference Haimson38, Reference Katz, Rechesa and Roegiers39 leading to K = 10.3 GPa for CCL and 18.2 GPa for IL. Young’s modulus of the thenardite crystals is larger than that of the stones. We measured an increase of E, relative to the salt-free stone, of 5.4% in CCL with a volume fraction of thenardite, φ, equal to 4.71 vol%, and of 4.1% in IL with φ = 4.55%. These values are within the range of the moduli of the salt-free stones, and so the changes are negligible.
B. X-ray analysis using synchrotron radiation: Thenardite distribution and crystallization of mirabilite
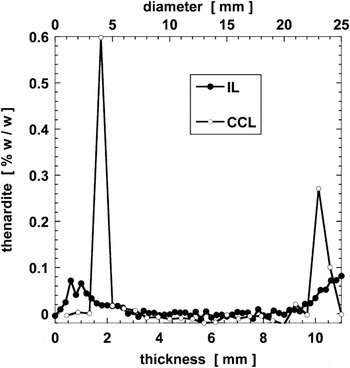
The distribution of thenardite was measured in two samples of different geometry by synchrotron x-ray diffraction: a plate with a thickness of 10 mm (IL) and a cylindrical sample with a diameter of 22 mm (CCL). The diffracting lozenge is centered inside the sample; therefore, any thenardite on the surfaces of the stone normal to the beam should not be detected. Figure 2 shows that thenardite is not uniformly distributed in IL but is concentrated close to the drying faces. Similar results were obtained for CCL despite the different sample geometry. Thus, a very nonuniform distribution of thenardite is obtained in both stones, independently of size and shape.
Profile, measured by synchrotron x-ray diffraction, of the volume fraction of pore space filled with thenardite through Indiana limestone (IL) based on known amount of salt in the sample (gravimetric data).

To investigate the precipitating hydrate and its spatial distribution, a one-dimensional (1D) scan in z-direction was run after the bottom face of the composite sample had been in contact with water for 1 h. Thenardite, initially close to the surface in contact with water, dissolves and the ions either diffuse into the reservoir solution or are advected to the top of the sample. At the end of the experiment, only mirabilite is present in a ∼2-mm zone at the glass–stone interface.
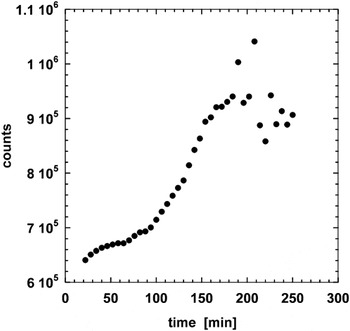
To examine hydrate formation with time, an in situ wetting experiment with water was carried out by placing the sample (IL with φ = 9.34 vol%) and warping rig in a vacuum desiccator in the path of the beam. An initial 1D scan in the z-direction was carried out on the top 3 mm of the dry sample directly below the glass plate which showed that thenardite, Na2SO4 III, and a possible trace of mirabilite were present, mainly in the top 2 mm. Na2SO4 III is a polymorph of anhydrous sodium sulfate, metastable at temperatures up to 180 °C.Reference Dharmasena and Frech40 During wetting, mirabilite was the only hydrate identified, and precipitation in the top face took place over 2.7 h as shown in Fig. 3. These results do not give the pure kinetics of crystallization of mirabilite but the result of the dissolution kinetics of thenardite and solute transport to the analyzed volume, where crystallization occurs. We see an increase in the amount of mirabilite forming before particle size effects (crystallite coarsening) become evident at ∼180 min. Larger crystals lead to poor powder averaging and fluctuating intensities, as seen in the latter part of Fig. 3, as fewer crystal orientations are visible to the beam. This suggests that the concentration of mirabilite crystals in the lozenge volume (27.1 mm3) is increasing up to 2.7 h, before Ostwald ripening results in larger crystals.
Mirabilite growth 0.75 mm below the glass–stone interface measured by synchrotron x-ray diffraction during an in-situ warping experiment in the path of the beam. The sample is an IL composite containing 1.6% w/w thenardite when dry. Water was kept in contact with the bottom surface for the duration of the experiment, which starts here 8 min after it first made contact with water. Symbols are scaled mirabilite diffraction peak areas for up to 11.

C. Warping experiment
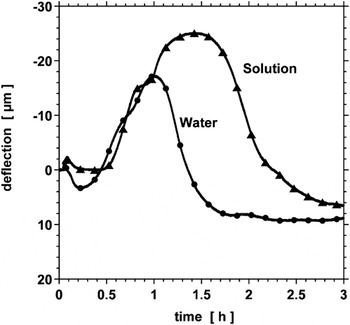
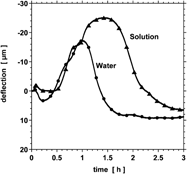
Figure 4 shows the deflection of the stone–glass composite during the uptake of water and of sodium sulfate solution (20% w/w) at 23 °C. The volume fraction of thenardite in both stone plates (CCL) is the same (φ = 4.71 vol%). A negative (downward) deflection (∆exp < 0) indicates that the warping sample becomes concave up due to the expansion of the stone partially hindered by the glass, and a positive (upward) deflection (∆exp > 0) means that the sample becomes convex up due to contraction of the stone. The measured deflection is the result of the hindered deformation of the stone during the recrystallization of thenardite into mirabilite. Characteristic of all the curves (see also Fig. 5) is the initial upward deflection followed by a more significant downward deflection and, finally, a progressive decrease of the deflection.
Measured deflection during the uptake of water and of sodium sulfate solution (20% w/w mol/kg) at 23 °C. The volume fraction of thenardite in both CCL samples was 4.71 vol%.

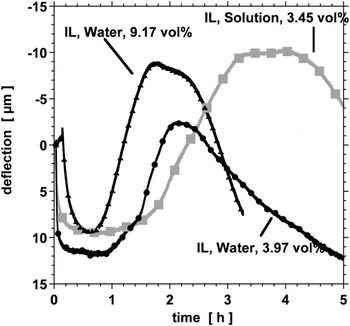
Measured deflection of IL during the uptake of water into stone containing 3.97 vol% thenardite (water, circles) and 9.17 vol% (water, triangles) and of sodium sulfate solution with concentration 20% w/w into stone containing 3.45 vol% thenardite (solution, squares).

Initially, the samples were impregnated with sodium sulfate solution and dried at 105 °C. As the DMA experiments have shown (see Supplement), when thenardite precipitates in the pores of the stone, the confined crystals exert pressure on the pore wall that causes expansion of the stone, but no visible damage under the conditions of our experiments. A residual stress (strain) remains in the stone. This explains partially the initial upward warping (contraction) experienced by the sample when rewetting: the dissolution of thenardite leads to the relaxation of the residual stress and therefore to a contraction of the stone. The hygric expansion, if present, also contributes to the initial deflection as hygric deflection is superimposed on that induced by salt dissolution–crystallization. The hygric contribution to the measured deflection of the bare CCL, ∆hyg, is 4.5 ± 0.5 μm, which must be subtracted from the measured deflection ∆exp. In the case of the bare IL, the measured deflection of the composite sample during the uptake of water is negligible, which is consistent with the results of the swelling test described in Sec. II. A.
The intensity of the initial contraction is influenced by the amount of thenardite in the sample and by the liquid used for rewetting. When pure water is absorbed, more thenardite dissolves before the solution becomes saturated with respect to thenardite, and so the contraction from the release of the residual stress is more significant. Crystallization of mirabilite reduces the solution concentration, which enhances dissolution of thenardite. The expansion due to mirabilite crystallization partially offsets the contraction linked to thenardite dissolution and hygric swelling, as shown in Fig. 4.
The simultaneous dissolution of thenardite and crystallization of mirabilite occur over a longer period of time during the uptake of solution, as compared to pure water, due to slower dissolution of thenardite at a higher concentration (Fig. 4). As long as thenardite crystals exist, the solution remains saturated with respect to thenardite and consequently highly supersaturated with respect to mirabilite, and so the mirabilite crystals can continue growing. The confined mirabilite crystals exert a pressure on the pore walls, producing an expansion in the stone plate that is hindered by the glass and results in a downward (negative) deflection, reaching a maximum at −16 μm by uptake of water and at −25 μm by uptake of solution in CCL.
In Fig. 5, the measured deflections of IL during uptake of water (φ = 3.97 vol% thenardite) and sodium sulfate solution (φ = 3.44 vol% thenardite) are compared. The negative deflection is more significant during the uptake of solution than during the uptake of water, as it was also for CCL shown in Fig. 4. The higher stress during the uptake of solution in both stones is attributed to the additional salt contributed by the solution. Figure 5 also shows the measured deflection during the uptake of water by IL with φ = 9.17 vol% of thenardite, showing that the deflection (i.e., the stress) increases with the amount of salt in the stone.
The sorptivity affects the crystallization pressure, as observed by comparing the deflection during the uptake of water by CCL (φ = 4.71 vol% thenardite; Fig. 4) and IL (φ = 3.97 vol% thenardite; Fig. 5). The forms of the curves are similar, but there is a significant difference in the absolute value of the deflection and in the time scale. The measured contraction (∼10 μm) in IL is much larger than in CCL, but the difference is attributable to hygric expansion of CCL (∆exp − ∆hyg ∼ 8.5 μm) and to its smaller absolute salt content (1.2 g of thenardite per 100 g of salt-free CCL and 1.6 g of thenardite per 100 g of salt-free IL). The contraction peaks are clearly visible in both stones when the wetting front reaches the glass–stone interface. The lower sorptivity of IL, exacerbated by pore clogging with mirabilite, impedes capillary transport, resulting in slower deformation in IL. The total deflection caused by the crystallization of mirabilite in CCL is around 25 μm, higher than in IL (∼18 μm), which contains more salt. However, equilibrium had not been reached in IL when the experiment was terminated (by equipment failure). Therefore, it is possible that the total deflection of 18 μm in IL is underestimated.
After reaching the maximal deflection, the decrease is faster in CCL. This relaxation depends on the dissolution kinetics of mirabilite, which is faster in more dilute solutions. Therefore, the concentration in the CCL samples must decrease faster, owing to faster ion transport into the water reservoir (Once the stone is saturated with water or solution, the advective transport is zero and the only relevant transport mechanism is ion diffusion.). This is qualitatively consistent with the different transport properties of the stones discussed before.
IV. ESTIMATION OF CRYSTALLIZATION PRESSURE AND STRESS
In this section, we estimate the crystallization pressure ∆P c from the deflection measured in the warping experiment. The linear elastic solution of the bending problem is given in Ref. Reference Scherer41. Its extension to in-pore crystallization can be found in the Supplement. The reactive transport model used to predict the location of the crystallization region of mirabilite is also briefly explained in the Supplement.
We define ε f as the linear strain that the stone would exhibit if it were not constrained by the glass. The bending deflection of the plate during mirabilite crystallization is analyzed to determine ε f, which is used to calculate ∆P c and the resulting stress in the stone by applying poroelasticity theory. According to Coussy,Reference Coussy9

where K is the bulk modulus of the drained stone, b = 1 − K/K m is the Biot coefficient (0.857 for CCL and 0.749 for IL), K m is the bulk modulus of the matrix (nonporous calcite), and S c is the local volume fraction of salt in the pores within the crystallization front (to be distinguished from the average volume fraction in the stone, φ). Equation (2) applies only for linear elastic materials, and so it can only be used before damage occurs. If damage results from crystallization, the reduced stiffness of the damaged stones permits a greater deflection (and seems to imply a larger stress) and the crystallization pressure calculated with Eq. (2) is overestimated.
The local crystallization pressure can be related to the macroscopic stress, σ*, byReference Coussy9, Reference Coussy33:

We assume an energy criterionReference Coussy9 that predicts failure when the strain energy imposed by the salt crystals exceeds the failure strain energy found in a uniaxial tensile strength test. As shown in the Supplement, failure is predicted when

where σ T is the tensile strength measured in a uniaxial test and ν is the Poisson’s ratio. In terms of strain, the tensile strain at failure is:

where ε T is the failure strain measured in a uniaxial tensile test of the sort used in our study.
V. DISCUSSION OF THE RESULTS
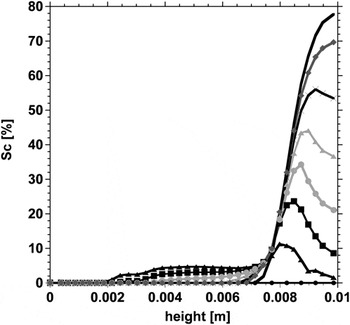
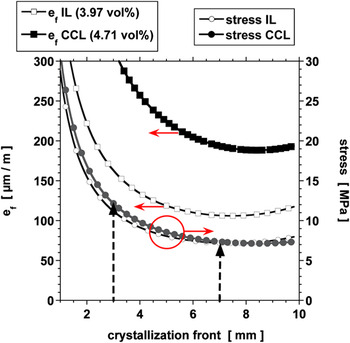
The simulation shows that the crystallization region of mirabilite moves to the glass–stone interface during the rewetting process, resulting in an accumulation of mirabilite close to the interface, as shown in Fig. 6. While the uptake of the liquid takes less than 15 min in salt-free CCL, when salts are involved, the uptake is slowed by clogged pores and the enhanced viscosity of the solution. The faster capillary flux of the solution in CCL leads to advection of the salt from the wetted surface toward the interior. The dissolved salt is advected with the liquid toward the glass–stone interface, which results in the main crystallization region being close to the interface with the glass. We simulated water uptake by IL and CCL with average salt contents φ = 3.97 vol% and 4.71 vol%, for which the synchrotron experiments showed thenardite distributed close to the top and bottom surfaces, leading to local volume fractions of S c ∼8.3% and 10%, respectively. The slower flow in IL leads to a wider crystallization region of salt (∼7 mm) than in CCL (∼3 mm), at the point of maximal deflection. Figure 7 shows ε f and σ* calculated by assuming different depths for the crystallization region of mirabilite (z s2 − z s1) in IL and CCL during the uptake of water for this case. Stress and strain are least when the mirabilite distribution is uniform within the plate (depth of the crystallization region ∼10 mm), and they increase when the salt is localized in narrower regions (with corresponding increase in S c).
Simulation of the mirabilite distribution through CCL plate initially with 4.71 vol% thenardite during the uptake of water. The curves give the content of mirabilite along the thickness of the sample. The interface of stone–glass is situated at a height of 0.01 m.

Estimated maximal deformation of IL and CCL and resulting uniaxial tensile stress during the recrystallization from thenardite to mirabilite by uptake of water as a function of the depth of crystallization region z s2 − z s1. Arrows indicate the values of the stress at the estimated depth of the crystallization region (3 and 7 mm for CCL and IL, respectively).

It follows from Fig. 7 that ε f and σ* are expected to be larger in CCL than in IL: at the estimated depth of the crystallization front, σ* ∼ 7 MPa with S c = 8.3% thenardite in IL versus 11 MPa in CCL with S c = 10% (see arrows). Note that the calculated ε f and σ* depicted in Fig. 7 would result from recrystallization in stone not glued to the glass plate (i.e., if the expansion were not hindered).
The deformation ε f is larger than the failure strain of IL (ε f* = 88.5 μm/m) and CCL (ε f* = 124 μm/m) for any possible distribution of the salt within the stone plate. From this, we conclude that rewetting with water of stones contaminated with a small amount of thenardite would cause damage from precipitation of mirabilite. No damage is observed in the warping experiments because the expansion of the stone is hindered by the glass. Similarly, an underlying mass of salt-free stone (in a wall or cliff face) would inhibit damage to a surface layer contaminated with salt; however, damage could occur near defects or in projections where the constraint is reduced. When crystallization pressure is limited to a thin layer on a substrate, damage could occur by a buckling mechanism, such as that described in Ref. Reference Wangler, Stratulat, Duffus, Prévost and Scherer42.
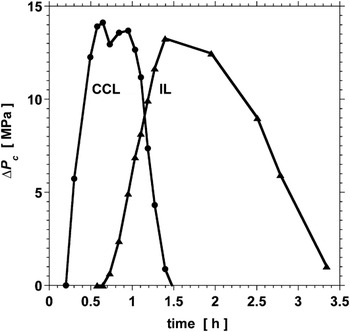
Figure 8 shows the calculated crystallization pressure exerted by mirabilite in the pores of IL and CCL initially impregnated with thenardite (φ = 9.17 vol% in IL and 4.71 vol% in CCL, i.e., local volume fractions Sc ∼19.2% and 10%, respectively), according to Eq. (5). The corresponding measured deflection is depicted in Figs. 4 and 5, respectively. The location of the crystallization region and the degree of pore filling were determined by numerical simulation of the rewetting experiment. Thus, the crystallization pressure of the confined mirabilite crystals in IL reaches a maximal value of ∼13 MPa and a similar magnitude (∼14 MPa) in CCL. The different time scales result mainly from the different transport rates.
Computed crystallization pressure in CCL with 4.71 vol% of thenardite (circles) and in IL with 9.17 vol% of thenardite (triangles) during rewetting with water.

The maximal concentration of the solution is given by the solubility of thenardite at each temperature. The corresponding supersaturation with respect to mirabilite is β = 3.15 at 21 °C, so Eq. (1) indicates that ΔP c ≤ 12.8 MPa at 21 °C. Therefore, the maximal crystallization pressure estimated by applying the reactive transport model coupled with poroelasticity (13–14 MPa) is in good agreement with the upper bound predicted by thermodynamics.
Temperature appears explicitly in Eq. (1), but it also affects ΔP c through the strong temperature dependence of the solubility of mirabilite.Reference Hartley, Jones and Hutchinson43 Thus, at 23.5 °C and a concentration of 3.65 mol/kg, β = 2.44 and the maximal crystallization pressure is 10 MPa, which is smaller than the expected value at 21 °C. Since rewetting at lower temperatures leads to higher crystallization pressure and stresses, weathering in cold environments is expected to be greater, unless sodium sulfate heptahydrate forms during water uptake, which can take place at lower temperatures.Reference Genkinger and Putnis44 The solubility of this salt is much larger than that of mirabilite, and so the crystallization pressure according to Eq. (1) is much lower.
Equations (2) and (3) predict that a larger salt content (S c) in a given porous material leads to higher deformation and stress, which is in agreement with the results shown in Figs. 4 and 5. Let S c,mirab be the pore filling with mirabilite within the crystallization front, which is larger than S c for thenardite due to the larger molar volume of mirabilite. If ∆P c = 12.8 MPa at 21 °C, damage will occur in CCL when S c,mirab > 36% and in IL (owing to its higher stiffness) when S c,mirab ≥ 52%.
In our experiment, the glass is an obstacle for the redistribution of salt, so salt might be carried farther into the stone in natural situations. During wetting (e.g., heavy rain), salts might be transported farther into highly permeable stones, such as CCL, enhancing subflorescence; in contrast, in less permeable stone, such as IL, more superficial damage is expected. Damage due to the dissolution–crystallization reaction by rewetting is not only relevant for sodium sulfate but also for other salts with multiple hydrates, such as MgSO4 which is very often linked to rock weathering on EarthReference Balboni, Espinosa-Marzal, Doehne and Scherer45 and on Mars.Reference Malin46
The calculated stresses and strains are consistent with the experiments. Nevertheless, this work shows the complexity of the interacting processes even in a simple case. We have neglected the influence of pore size distribution on σ* by assuming that S c is uniform within the crystallization front. Equation (2) is based on the assumption that all pores dilate equally, but IL has much larger pores than CCL and, as shown by Espinosa et al.,Reference Espinosa, Franke and Deckelmann27 at a given S c, the presence of smaller pores leads to larger mechanical stresses. Larger pores require larger crystals of salt to form before the salt comes into contact with the pore wall and stress is exerted. The stress would be more precisely determined by taking account of the salt distribution in pores of different sizes.Reference Coussy and Brisard47 Moreover, moisture and salt distribution are strongly affected by the pore connectivity, which changes as salt dissolves and reprecipitates. These factors should be also taken into account to evaluate the susceptibility of rocks and building stones to salt weathering, and this will be the objective of future investigation.
VI. CONCLUSIONS
A warping test was performed on two limestones (CCL and IL) to determine the stress exerted during dissolution of thenardite (Na2SO4) and crystallization of mirabilite (Na2SO4·10H2O). Crystallization of both salts from a supersaturated solution can cause expansion and damage in both limestones, even at low thenardite contents. A synchrotron x-ray diffraction study found that in this case mirabilite formed after the dissolution of thenardite at 21–22 °C. Deformation and stress during crystallization of mirabilite are higher in CCL than in IL at a similar degree of pore filling with thenardite, CCL being the stone with the smaller pores. However, the pore size is not the only reason for the enhanced stress. The rate of solution transport through the pore network and the kinetics of the dissolution–crystallization reaction determine the salt distribution, pore filling, and the evolution of the stress, and therefore must be taken into account when comparing the susceptibility of two stones to damage by crystallization. The complexity of the model reflects that of the salt weathering mechanism and indicates the need for a computational tool that considers the interaction of all these phenomena. Despite the simplifications we have introduced, the pore pressure inferred from our experiment is consistent with the crystallization pressure predicted by Eq. (1), which is the thermodynamic upper bound.
Numerical simulation of the liquid uptake shows that a redistribution of salt takes place and is enhanced in porous materials with high permeability. This has important consequences for salt weathering in the field since uptake of rainwater by salt-bearing stones with larger permeability enhances the formation of subflorescence deeper inside the material, which might be more damaging. Clogging of pores by salt also influences permeability, and therefore the salt distribution. Our experiments suggest that pore clogging affects the evolution of stress (and damage) but a better understanding and quantification is still necessary.
Prediction and prevention of salt damage is possible only if the interaction between rock properties, environmental conditions, and composition of the solid (minerals) and fluid phases are considered. We showed that even in an experiment as simple as the rewetting of thenardite, the interacting phenomena can only be evaluated by numerical modeling. This makes it difficult to characterize materials as to their susceptibility to salt damage, since under particular conditions (and history) they might all become susceptible. All the components of the theory needed for the numerical modeling are available, but the model parameters are only known for specific scenarios. To generalize these models for predictions in nature, more knowledge is needed regarding the kinetics of crystallization and dissolution of crystals within the pore network, the influence of pore clogging on the transport of the solution, and the properties of the solution confined between the surfaces exerting pressure.
ACKNOWLEDGMENTS
The authors thank Prof. Chris Hall for helpful advice. The authors also thank the Deutsche Forschungsgemeinschaft, the Getty Conservation Institute, the National Center for Preservation Technology & Training (NCPTT) (Grant MT-2210-09-NC-03), and the United Kingdom Engineering and Physical Sciences Research Council for financial support.