I. INTRODUCTION
Solder interconnections still remain the predominant method to form electrical and mechanical connections between electronic components. Solder interconnection reliability has received an increasing attention during the recent years due to the miniaturization trend of electronic devices as well as the adoption of the lead-free solder alloys.Reference Zeng and Tu1–Reference Lee, Nguyen and Selvaduray6 Numerous studies have been carried out to identify the root causes of failures in electronic devices under different operation conditions. Most often electrical failures are caused by the mismatch in the coefficient of thermal expansion (CTE) between adjoining materials as a consequence of changes of the device temperature due to either internally generated heat dissipation of integrated circuits or chances of external operation temperature. The evolution and growth of interfacial intermetallic compound (IMC) layers during operation has often been assumed to dictate the performance of solder interconnections due to their inherently brittle nature and tendency to form defects. However, conditions under which strains are concentrated on them are quite limited; cracking of intermetallic layers appears primarily under mechanical shock loading or fast, high-amplitude bending/vibration. However, under thermal cycling conditions, the solder interconnections undergo continuous cyclic plastic deformation that leads to cracking of the solder bulk instead of in the interfacial IMC layers of solder interconnections, see, e.g., Refs. Reference Mattila, Vuorinen and Kivilahti7–Reference Mattila, Laurila, Kivilahti, Suhir, Wong and Lee15. Therefore, to have a better understanding of the failure mechanism of the solder interconnections, emphasis should be placed, in addition to the interfacial IMC layers, on (i) thorough microstructural characterization of “bulk” solder interconnections, (ii) the investigation of changes of microstructures during operation, and (iii) the associated changes of mechanical properties of the solder bulk.
From microstructural perspective, damage of solder interconnections is a result of the accumulation of internal energy in the form of increased dislocation densities in the plastically deformed regions of the solder interconnections. The fact that the common operation temperatures of electronic devices are relatively high with respect to the melting temperature ranges of most Sn-rich alloys [for Sn the homologous temperature (T/T mp in K) at room temperature is about 0.6] makes the time-dependent plastic deformation (i.e., creep) of solder interconnections significant even at low stress levels, such as those produced under commonly used accelerated thermal cycling test conditions. The internal energy stored in the solder interconnections during plastic deformation provides the driving force for the restoration processes, namely the recovery and recrystallization. However, the mechanisms by which the internal energy is decreased by the two processes are different, and the activation energy of recovery is lower than that of recrystallization. Recovery is the annihilation of lattice defects, mainly dislocations, by their movement to the grain boundaries where they disappear and their rearrangement to form subgrain networks by polygonization. Recovery takes place effectively in materials that have high stacking fault energy, such as pure Sn,Reference Hardwick, Sellars and Tegart12, Reference McLean and Farmer13 but the efficiency of recovery is diminished by impurities, second phase particles, and tangling of dislocations in the regions of high dislocation density. Therefore, in principle, recovery can decrease the driving force so that the recrystallization is initiated only under restricted conditions. Our recent investigations have shown that SnAgCu solder slabs compressed up to 50% of the original height do not recrystallize when annealed at 100 °C immediately after the deformation.Reference Miettinen14 However, several investigations have demonstrated that near-eutectic SnAgCu interconnections do undergo a discontinuous change of microstructures under thermal cycling as well as power cycling conditions.Reference Mattila, Vuorinen and Kivilahti7–Reference Sundelin, Nurimi and Lepistö11, Reference McLean and Farmer13–Reference Mattila and Kivilahti21 Cracks are very often observed to propagate in the regions where the recrystallization has most significantly changed the microstructure.Reference Mattila, Vuorinen and Kivilahti7, Reference Henderson, Woods, Gosselin, Bartelo, King, Korhonen, Korhonen, Lehman, Cotts, Kang, Lauro, Shih, Goldsmith and Puttlitz9, Reference Sundelin, Nurimi and Lepistö11, Reference Mattila, Laurila, Kivilahti, Suhir, Wong and Lee15, Reference Mattila and Kivilahti21
In this article, the failure modes and mechanisms of Sn-rich solder interconnections under thermal cycling conditions are investigated. Particular attention is paid on the microstructural changes preceding and taking place during the crack initiation and propagation. The development of solder interconnections microstructures and the formation of the cracks under the thermal cycling conditions are studied by component boards with different solder interconnection metallurgies.
II. MATERIALS AND METHODS
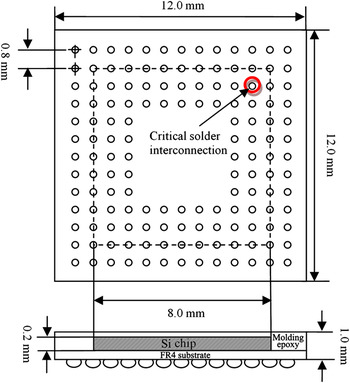
Figure 1 shows the structure and dimensions of the Integrated Circuit (IC) package used in the study. The package was a FR4-based chip scale packaged (CSP) Ball Grid Array with 12 mm × 12 mm × 1 mm package dimensions, 144 Sn3.0Ag0.5Cu or Sn1.2Ag0.5Cu 0.05Ni bumps with the pitch of 0.8 mm and the bump diameter of 0.5 mm. No underbump metallization was applied on the copper bump pads of the component. Electroless Ni with immersion Au (Ni(P)|Au) or organic solderability preservative (Cu|OSP) was coated on the copper pads of the printed wiring boards (PWBs). Three after-reflow compositions of solder interconnections, Sn3.1Ag0.5Cu (SnAgCu), Sn3.1Ag0.52Cu0.24Bi (SnAgCuBi), and Sn-1.1Ag-0.52Cu-0.1Ni (SnAgCuNi), were formed by reflow soldering the packages with different commercial solder pastes (“SnAgCu”: Sn3.0Ag0.5Cu bumps and Sn3.8Ag0.7Cu solder paste, “SnAgCuBi”: Sn3.0Ag0.5Cu bumps and Sn3.0Ag0.7Cu3.0Bi solder paste, and “SnAgCuNi”: Sn1.2Ag0.5Cu 0.05Ni bumps and Sn0.7Cu0.1Ni solder paste). It should be noted that the above-reported compositions are calculated approximations determined based on the nominal compositions of the solder bump and paste alloys, volume ratios calculated from the nominal bump dimensions and paste particle contents, and the assumption of perfect mixing of the alloys. It should also be noted that the compositions of the interconnections changes slightly during the reflow soldering because of the dissolution of Cu or Ni from the soldering pads of the PWB (for estimation of the effects of dissolution, see, e.g., Ref. Reference Mattila, Vuorinen and Kivilahti7).
Dimensional drawing of the component.

Reflow soldering of the assembled component boards was carried out in a commercial in-line forced convection reflow soldering oven (EWOS 5.1 N2, EPM/Heraeus, Hanau, Germany) under air atmosphere. The temperature on the top of the PWB underneath the CSP component was measured with thermocouples (Super M.O.L.E. Gold, ECD, Milwaukie, OR). The peak temperatures varied between 240 and 245 °C, and the time above 217 °C was about 40–43 s depending on the location of the package on the board.
The component boards were thermally cycled (ENX12-7.5CWL, ESPEC, Hudsonville, MI) between −40 °C and +125 °C by allowing 15 min dwell times at each temperature extreme and adjusting the temperature ramp time to 7 min in both directions. Samples were removed from the oven every 10 days to observe the microstructural evolution.
Cross sections of the thermally cycled samples were prepared along the diagonal of the component. The samples were first cut further away from the diagonal line with the help of a water-cooled, low-speed diamond saw to be sure that the cutting would not disturb the material to be inspected. The diagonal cross section of the interconnections was reached by careful grinding. To reveal the microstructure of the critical solder interconnections, the cross-sections were polished by standard metallographic methods. In the minimum 30 samples of each material combination were inspected. Each sample included 8−12 cross sections of the interconnections depending on the orientation of the cross section with respect to the package. Optical microscopy with cross-polarized light (BX60, Olympus, Center Valley, PA) was used to inspect differences in crystal orientations. Crystal orientations and relative misorientations were quantified with the help of orientation imaging microscopy (OIM) by employing the electron backscatter diffraction (EBSD). The scanning electron microscopy (SEM, JEOL6330F, JEOL, Tokyo, Japan) was used to study the distributions of the IMC particles of the bulk solder.
Nanoindentation measurements were performed on the polished cross sections of the solder interconnection with the help of the TriboIndenter (Hysitron Inc., Minneapolis, MN) nanomechanical testing instrument. With an ultrahigh-resolution load and displacement control, the device is able to determine various material properties, such as hardness and elastic modulus, from surfaces in submicron scales. Each indentation cycle included a 15-s holding period before unloading to reduce the effects of viscoplasticity on the measured properties. The Berkovich indenter with a 130-nm tip curvature was used in the measurement.
Stress–strain analysis of the solder interconnections was carried out with the help of the commercial finite element software ANSYS v. 11.0. The symmetrical structure of the component assembly allowed the employment of the quarter model. The model composed of a global model with coarse meshes and a local model with fine meshes. The constraint equations were used to tie together the meshes in the global and local models, and the displacements were transferred along the boundary between the two models. Each solder interconnection was roughly meshed with 96 elements in the global model, while the finer meshes with 3060 elements were applied for the diagonal solder interconnections in the local model. The local model had realistic shape of the solder interconnection and detailed pad design (solder-masked-defined pad on the component side and non-solder-masked-defined pad on the PWB side).
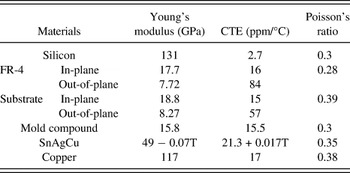
The elastic material properties for thermomechanical simulation are listed in Table I.22–Reference Coombs24 The solder material was modeled as viscoplastic using Anand’s constitutive equations with parameters provided by Reinikainen.Reference Anand25, Reference Reinikainen, Marjamäki and Kivilahti26 The Anand constitutive model is composed of a flow equation and three evolution equations that describe strain hardening or softening during the primary and secondary creep stages.Reference Anand25
Elastic material properties for thermal-mechanical simulation.

The PWB and the interposer layer of the package were orthotropic. All the other materials in the model, including solder, were assumed isotropic. The three-dimensional element type SOLID45 was assigned to all the materials except the solder interconnections. The solder interconnections were modeled with the element type VISCO107, which is a viscoplastic solid element for the Anand constitutive model and is designed to solve rate-dependent large strain plasticity problems. The symmetry boundary conditions were applied as mechanical constraints, and the center node at the bottom of PWB was fixed to prevent free rigid body motion.
III. RESULTS AND DISCUSSION
The finite element method was used to characterize the strain and stress concentrations in different interconnections of the package as well as in the interconnections with the highest stress and strain. The results were correlated with the observations from the physical failure analyses.
A. FEM results and analysis
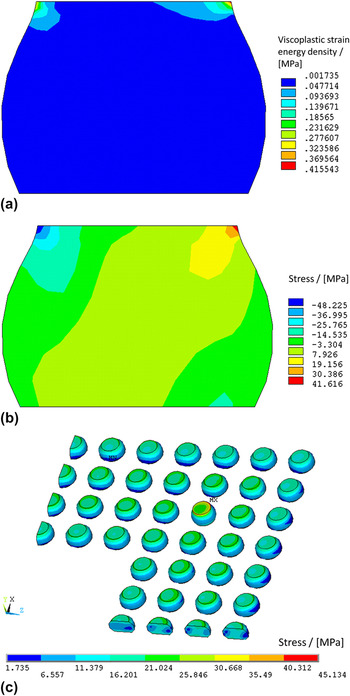
The simulation results of the global model showed that the solder interconnections with highest strains are located at the corner locations of the inner periphery underneath the Si chip instead of the corner most interconnections of the package (Fig. 1). This result is in agreement with the observations from the physical failure analyses, and similar results have been presented in Ref. Reference Dudek, Faust, Ratchev, Roellig, Albrecht and Michel27. Compared with the corner most solder interconnections of the package, the critical solder interconnections have higher viscoplastic strain energy densities and stresses. A possible reason for this distribution of strains and stresses is related to the structure of the package and the choice of its materials. The fact that the silicon chip, whose CTE is low (Table I), is attached to the FR4 interposer of the package (with relatively high CTE) influences the total CTE of this area and causes a mismatch in thermal expansion between component and PWB. While the solder joints in the center region underneath the die may assumingly experience lower stress than the corner most interconnections of the package, the strains and stresses increase toward the edges of the rigid Si die. The strains/stresses in the interconnections along the outermost periphery of the package (which is not covered by the die) remain low due to the diminished influence of the silicon chip. In the edge region of the package, the CTE mismatch is dictated by the interposer/mold compound against the PWB. The maximum viscoplastic strain energy density, the von Mises stress, and the normal stress of the critical solder interconnections are 0.415, 45.13, and 41.73 MPa, respectively. The corresponding values of the corner most interconnections of the package are 0.034, 20.49, and 17.95 MPa, respectively. Figure 2 shows the contour plots of the viscoplastic strain energy density and the normal stress on the diagonal cross section of the critical interconnections at the low-temperature portion of the thermal cycle. The von Mises stress has similar distribution as the viscoplastic strain energy density. As shown in Figs. 2(a) and 2(b), the maximum normal stress and the maximum viscoplastic strain energy density are highly localized at the outer corner regions on the component side of the solder interconnections.
The left-hand side edge of the interconnection faces the center, and the right faces the corner of the package: (a) viscoplastic strain energy density distribution in the local model, (b) normal stress distribution in y-direction in the local model, and (c) quarter view of the interconnections of the package shows the distribution of von Mises stresses in different interconnections.

B. Observations on the evolution of microstructures during thermal cycling
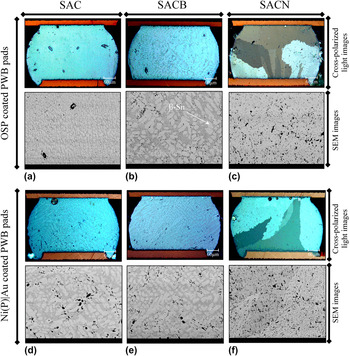
The inspections of the as-soldered microstructures of the interconnections revealed differences in microstructures between the compositions under investigations. Figure 3 shows the microstructures of all the combinations of experimental variables as inspected with the help of the cross-polarized light microscopy and SEM. As inspected under the cross-polarized light, differences in the number of crystal orientations were observed between the compositions of the interconnections but not between the interconnections formed on the different protective coatings. In principle, the primary phase of solidification in near-eutectic SnAgCu solder alloys can be β-Sn, Cu6Sn5, or Ag3Sn depending on the composition, but the nominal after-reflow compositions of the interconnections in this study are in the primary β-Sn phase region. Thus, the solidification structures of the interconnections are dictated by the solidification of β-Sn. High degree of undercooling as caused by the suppressed nucleation of primary Sn during solidification has been reported in the literature.Reference Moon, Boettinger, Kattner, Biancaniello and Handwerker28 The high undercooling results in a cellular (or dendritic) structure of the SnAgCu solder joints.
Scanning electron microscopy (SEM) (top row) and polarized light (bottom row) images of the as-solidified solder interconnections with different PWB protective coatings: (a) SnAgCu (SAC)/OSP, (b) SnAgCuBi (SACB)/OSP, (c) SnAgCuNi (SACN)/OSP, (d) SAC/Ni(P)|Au, (e) SACB/Ni(P)|Au, and (f) SACN/Ni(P)|Au.

In the as-reflowed conditions, the solder interconnections are composed of relatively few solidification colonies that enclose the uniformly oriented Sn cells. (The term “solidification colony” is used here to emphasize the fact that under the reflow conditions employed, a cellular structure is generated in which the difference of crystal orientations between individual cells is very small, below 3°. The difference in crystal orientation between the colonies is high, above about 10–15°. The use of this term helps us also to make a verbal distinction between the as-solidified microstructures and the recrystallized grains.) The cellular structure of the β-Sn is clearly distinguishable as they are surrounded by regions composed of small Cu6Sn5 and Ag3Sn IMC particles uniformly dispersed in β-Sn. The top images in Fig. 3 show an example of a cross section of each interconnection composition in the as-reflowed state as imaged by employing the cross-polarized microscopy. In the after reflow conditions, the interconnections consist of relatively few solidification colonies of uniformly oriented β-Sn cells distinguished by high-angle boundaries. The cross sections of the SnAgCu and the SnAgCuBi interconnections showed distinctly fewer number of crystal orientations (typically only one or two) than the SnAgCuNi interconnections (typically three to eight). Similar results have been reported in other studies.Reference Terashima, Kohno, Mizusawa, AraiI, Okada, Wakabayash, Tanaka and Tatsumi29, Reference Terashima and Tanaka30 The larger number of crystal orientations in SnAgCuNi interconnections is most likely a consequence of the low Ag content in the solder bulk, which is also shown in the comparison of the binary SnAg and SnCu solder interconnections on different underbump metallization reported in the literature.Reference Panchenko, Mueller, Wiese, Schindler and Wolter31, Reference Seo, Kang, Cho, Shih and Lee32
As inspected with the help of the SEM with higher magnification, differences were observed also between the interconnections on the soldering pads with different protective coatings, namely in the amount and distributions of Cu6Sn5 and Ag3Sn intermetallic phases. The SEM images in Fig. 3 illustrate that the cellular structure of the β-Sn in the SnAgCu and the SnAgCuBi interconnections was clearly distinguishable [as they were surrounded by thick regions composed of uniformly distributed Cu6Sn5 and Ag3Sn in the β-Sn matrix; Figs. 3(a), 3(b), 3(c), 3(d), and 3(e)]. However, the SnAgCuNi interconnections did not show a clear cellular structure and the intermetallic particles were much more evenly distributed over the whole volume of the solder interconnections [Figs. 3(c) and 3(f)]. This difference is most likely a consequence of lower Ag content of the SnAgCuNi interconnections compared to the Ag content of the SnAgCu and the SnAgCuBi compositions. Furthermore, the microstructures of the interconnections on the Cu|OSP-coated soldering pads were more heterogeneous than those of the interconnections on the Ni(P)|Au due to the larger amounts of primary Cu6Sn5 particles. This is caused by the several orders of magnitude higher dissolution rate of Cu into the molten Sn compared with that of Ni and the increased Cu content of the melt of the Cu|OSP interconnections.Reference Bader33 In one of our earlier studies, the dissolution rate of Cu in Sn0.5Ag0.5Cu (wt%) was found to be about 0.07 μm/s (at ∼250 °C), whereas that of Ni is only 0.003 μm/s.Reference Mattila, Vuorinen and Kivilahti7
The development of microstructures was studied from samples that were taken out in the course of the thermal cycling test and cross sectioned for inspection. During the test, the as-solidified microstructures transformed into more or less equiaxed grain structures. Typically only a fraction of the solder interconnection cross section participates in cyclic deformation because the stress/strain distribution inside the barrel-shaped solder interconnections concentrated on the edges of the solder interconnections close to both interfacial regions as indicated by the results of the finite element analysis.
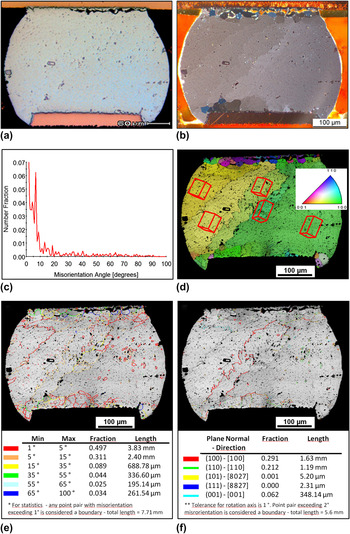
Figure 4 shows a typical example of a failed interconnection, where cracking of the solder interconnection is accompanied by the distinct change of microstructures by recrystallization. The changes of microstructures were first observed in the strain concentration regions and, after the initiation of recrystallization, the recrystallized volume gradually expanded from the edges toward the center, across the interconnections in the interfacial regions of the interconnections. Comparison of the images shows that the propagation path of the crack [Fig. 4(a)] is enclosed entirely within the recrystallized region of the interconnection [Fig. 4(b)]. The incubation time of recrystallization varied significantly from one interconnection to another. The first indications of recrystallization were observed in the samples that were taken out after 500 thermal cycles, but it took about 2000 cycles until recrystallization was consistently observed in every interconnection on the corner regions of the packages. The incubation time of recrystallization in the SnAgCuNi interconnections was the shortest. They began to recrystallize after about 500 cycles. The incubation time of the SnAgCu was in the range of 1000–1500 cycles and that of the SnAgCuBi interconnections was about 1000–2000 cycles. Differences between the incubation times can be attributed to the fact that the strength of the SnAgCuNi alloy is lower as compared with the SnAgCu and SnAgCuBi alloys. Due to the lower amount of Ag, higher amount of plastic work per thermal cycle is stored in the material and the accumulation of the stored energy in the low-silver SnAgCuNi interconnections is therefore faster. Furthermore, the onset of recrystallization on the interconnections on the Cu|OSP-coated PWBs was faster than that on the interconnections on the Ni(P)|Au regardless of the solder composition.
(a) The bright light micrograph shows the crack path of a failed solder interconnection during thermal cycling, (b) a cross-polarized light image of the same interconnection shows the change of grain structure as caused by the cyclic deformation, (c) orientation imaging microscopy misorientation distribution between adjoining β-Sn grains found in the solder joint, (d) inverse pole figure [001] showing the orientation in normal direction, (e) electron backscatter diffraction map of the cross section showing the misorientations and distribution of grain boundaries, and (f) grain boundaries by rotations around certain directions (note that boundaries where red [100] and green [110] lines overlap appear olive green).

Figures 4(c)–4(f) show the OIM results obtained from the EBSD measurement of the cross section in Figs. 4(a) and 4(b). Figure 4(d) shows the orientation in normal direction ([001] inverse pole figure) and allows a comparison with the cross-polarized light micrograph in Fig. 4(b). Both pictures are in good agreement, and the majority of the β-Sn grains were already observable with cross-polarized light microscopy. The misorientation between adjoining β-Sn grains is shown in Figs. 4(c) and 4(e). Both figures show that most of the misorientations are below 5°. It is likely that those boundaries are subgrains or low-angle grain boundaries formed by dislocations. The misorientation distribution in Fig. 4(c) also shows only a small amount of high-angle grain boundaries that are mostly gathered in the crack area [Figs. 4(e) and 5(a)]. No special boundaries such as twins (57.2° and 62.8° rotation around [100] axis with twin planes K1 {101} and {301}, respectively) have been found in the present solder interconnections. This result differs from the findings of Lehman et al.Reference Lehman, Xing, Bieler and Cotts34 This finding points out that there may be significant differences in the microstructures of solder interconnections from one component board to another. At the time of writing, the reasons for these differences are not fully understood but it is well known that solder composition, choice of PWB protective coating, choice of underbump metallization, and the temperature–time profile of the reflow soldering process all influence the microstructures of solder interconnections. Because of such differences in the microstructures, it is also possible that the failure modes and lifetimes differ from one board assembly to another.
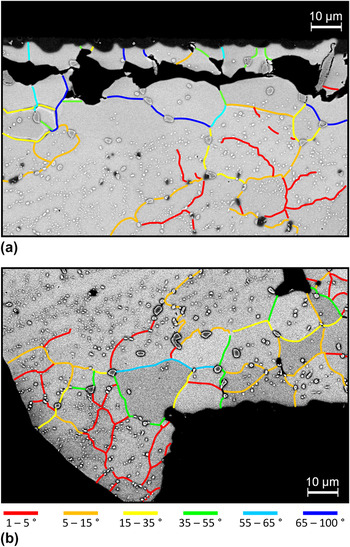
Higher magnification backscatter scanning electron micrographs of the cross section shown in Fig. 4: (a) cracked region on the package side and (b) left corner on the PWB side (black particles are Cu6Sn5 intermetallics, bright and grey particles are Ag3Sn). The grain boundaries have been inserted manually by superposition of the EBSD results.

Figure 4(d) shows that the center region of the solder joint consists of several larger grains with gradual change in orientation, which is indicated by the inserted unit cells. Those grain boundaries correlate in general with the misorientation peaks at 4°, 7°, and 9° [Figs. 4(c) and 4(e)]. Since this area experiences the lowest stress and strain during the thermal cycling test, it is reasonable that the grain structure in the center of the solder joint still represents the as-solidified state. The areas close to both interfaces experienced higher strain and, therefore, more significant changes in grain structure. The cracked region on the package side interface of the solder interconnections shows primarily high misorientations of the grains. Figure 4(e) illustrates well that the high-angle grain boundaries are located very close to the crack path, while the misorientation becomes smaller the larger the distance from the crack region is. Figure 4(f) shows all grain boundaries between adjoining grains that are formed by a rotation around a certain axis. It shows that a large amount of low-angle boundaries of the interconnection are formed by rotations around [100], [110], and [001], while most high-angle grain boundaries in the cracked region and in the strain concentration region on the PWB side interface do not have this relationship. A very narrow tolerance (1°) of the rotation axis was chosen in the analysis to distinguish between the different rotations causing the low-angle grain boundaries (when a higher tolerance, e.g., 5°, was chosen, more low misorientation boundaries were highlighted and all three rotations around [100], [110], and [001] overlapped). These three rotations and the mentioned overlap could be explained by the simultaneous activation of different slip systems which could form dislocation walls and create rotating subgrains. It is remarkable that rotations around [101] and [111] are not affected significantly by this tolerance change. Independent from the chosen tolerance, it was shown that high-angle grain boundaries above 15° do not show this relationship.
Figure 5(b) shows a higher magnification of the microstructures on the PWB side of the interconnection, where cracking has not yet taken place but similar coarsening of the intermetallic particles and formation of grain boundaries can be identified. A closer inspection of the region shows that primarily low-angle misorientations are formed on the PWB side region, where the recrystallization has not yet progressed as far as in the vicinity of the crack path on the package side interfacial regions of the solder interconnections. It seems that the formation of the low-angle boundaries is a preliminary stage before recrystallization. A similar observation has been reported also in Ref. Reference Zhou, Bieler, Lee and Liu35.
A correlation of the microstructures on the PWB [Fig. 5(b)] and the package side regions [Fig. 5(a)] indicates that the Sn cells begin to rearrange by the gradual coalescence of the Sn cells, during which the cellular structure disappears and the low-angle boundaries emerge. The regions surrounding the Sn cells formed during solidification disappear as the small intermetallic particles coalesce and distribute sparsely mainly on the formed grain boundaries. These experimental findings indicate that there are in fact two different mechanisms that cause the observed changes of microstructures. The first to take place is the gradual rotation of small volumes in the stress-concentration regions. The mechanism following this stage is the discontinuous change of microstructures by recrystallization.
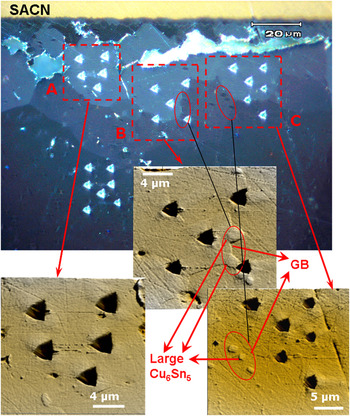
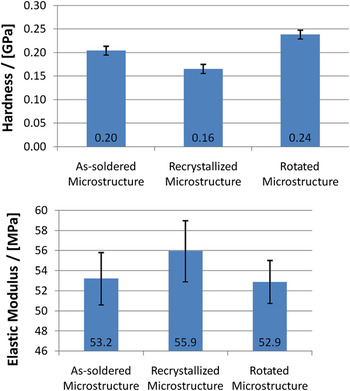
It is well known from the microstructural perspective that damage of solder interconnections is a result of the accumulation of internal energy in the form of increased dislocation densities in the plastically deformed regions of the solder interconnections (i.e., where strain hardening takes place). The stored energy is released through recovery (annihilation of lattice defects and the formation of low-angle grain boundaries due to a rearrangement of dislocations in deformed materials with a high dislocation density) and recrystallization (the nucleation and growth of new defect-free grains). Thus, in principle hardness of the strain-hardened regions of the solder interconnections should be higher compared with the solidification colonies in the center regions of the solder interconnections, while the hardness of the recrystallized grains should be lower than that of the strain-hardened regions. To characterize the different regions, hardness and elastic modulus of the as-soldered, recrystallized, and the rotated colonies were measured with the help of the nanoindentation test. Figure 6 shows a cross-polarized micrograph of the SnAgCuNi solder interconnection in which the indents are clearly visible. The high-resolution scanning probe microscopy (SPM) images show that some of the grains boundaries were made visible by the stress field of the indentation tip during the measurements. The measured values of hardness of the three different regions are presented in Fig. 7. The values are averages from 12 to 18 indents, and the indicated range is the standard deviation of the measurements. The hardness of the rotated regions is about 17% higher than that of the as-soldered regions, and the hardness of the recrystallized regions is about 30% lower than the rotated regions. It should also be noted that standard deviation of the hardness measurements from the recrystallized regions is only about 8% of the average while that of the as-solidified regions is about 15%. It is suggested that the microstructural changes shown in Fig. 4(b) are caused by increased dislocation densities in the regions of stress–strain concentration and the subsequent rotation of the solidification colonies (by recovery) to reduce the internal stresses.
Image under optical microscope with cross-polarized light after indentation test.

Measured hardness and elastic modules of as-soldered, recrystallized, and rotated microstructures (with standard deviations).

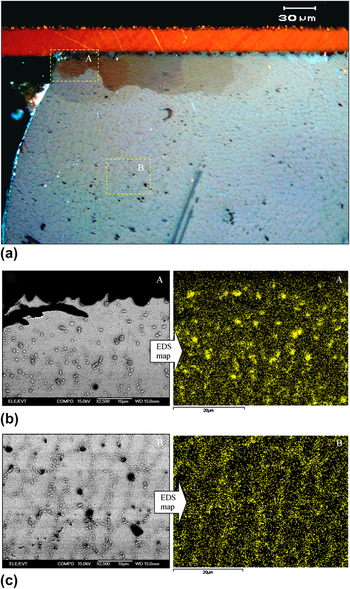
It is particularly noteworthy in Figs. 5(a) and 5(b) that the coarsening of intermetallic particles is strong in the heavily deformed corner regions of the interconnections, and the coarsened intermetallic particles have (often) been left at the boundaries of recrystallized Sn grains. The element mapping results show that the coarsened intermetallic particles are mostly Ag3Sn. Similar results have been reported in Refs. Reference Vianco, Rejent and Kilgo36–Reference Dutta, Kumar and Subbarayan38. Compared to solder interconnections with high Ag content (Sn3.1Ag0.5Cu, Sn3.1Ag0.52Cu0.24Bi), the coarsening of Ag3Sn in low Ag content interconnections (Sn–1.1Ag0.52Cu0.1Ni) was not as obvious as it was in the higher Ag content SnAgCu and SnAgCuBi interconnections. Furthermore, similar coarsening of the Cu6Sn5 or (Cu,Ni)6Sn5 particles was not observed, most likely due to the low concentration of Cu and Ni (about 0.5 wt% and less than 0.1 wt%, respectively). The difference in the coarsening rate of the Ag3Sn particles between the “as-soldered” midsections of the interconnections and the regions undergoing cyclic deformation was significant. Thus, the primary reason for the coarsening seems to be the increased diffusion rates caused by the cyclic deformation rather than the cyclically increased temperature.
There is a similarity between the recrystallized microstructures and the rotated regions, namely that the edges of the different crystal orientations are clearly distinguishable, but the disappearance of the cell boundaries is not as obvious in the rotated regions as in the recrystallized regions. Differences in the number, size, and distribution of the intermetallic particles between the changed [Fig. 8(b)] and the as-soldered regions [Fig. 8(c)] of the interconnections are distinguishable. The boundaries composed of the small Cu6Sn5 and Ag3Sn intermetallic particles around the Sn cells have faded and the Ag3Sn intermetallic particles have coalesced and became sparsely distributed.
Cross-polarized and SEM images of SACB|OSP solder interconnections after thermal cycling for 90 days: (a) cross-polarized image, (b) a SEM micrograph and an element map of Ag of the area A, and (c) a SEM micrograph and an element map of Ag of the area B.

The nucleation mechanism of the recrystallized grains is yet uncertain, however. Based on what is being said above it is likely that the high-angle grain boundaries formed by the rotation and coalescence of the subgrains act as a nucleation sites of recrystallizing grains. However, nucleation can also take place at the grain boundaries (preferable at triple points) of the Sn matrix and the intermetallic particles. The stable nuclei, formed by either of the mechanisms, then gradually grow at the expense of the neighboring grains and consume all the deformed volume of the interconnections. The final outcome is an equiaxed microstructure (high-angle misorientations between crystals in random orientation), where cracks nucleate and propagate intergranularly through the solder interconnections along the continuous network of high-angle grain boundaries.
C. Nucleation and propagation of cracks
It is particularly noteworthy that even though there was considerable variance in the incubation period of recrystallization, the nucleation of cracks took place within relatively narrow range between about 1000 and 1500 thermal cycles. Thus, nucleation of cracks can take place before the change of microstructures by recrystallization, but the propagation of cracks without the influence of recrystallization seemed sluggish judging by the measured crack lengths of samples that were taken out of the test chamber at the same point of time. Furthermore, recrystallization had initiated eventually in all failed solder interconnections, and the networks of grain boundaries had influenced the propagation of cracks in all electrically failed interconnections observed in this study.
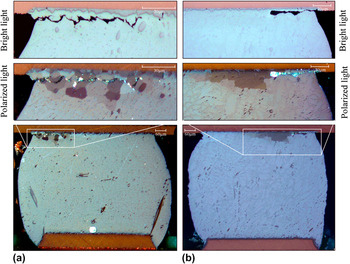
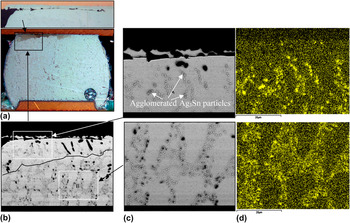
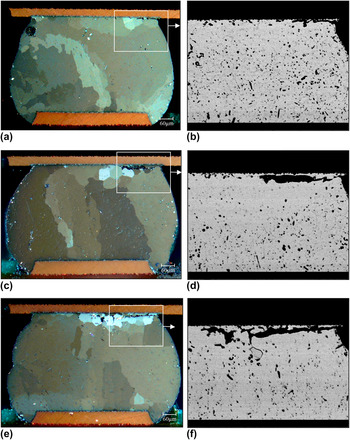
The failure analyses showed that the crack had commonly propagated on the package side of the solder interconnections in the proximity of the intermetallic layers. Inspection of the samples that were removed from the cycling chamber sequentially after the start of the test revealed that the cracks sometimes nucleated before distinct recrystallization could be observed [Fig. 9(b)]. However, the propagation of cracks was influenced by the formation of the networks of grain boundaries by recrystallization [as shown in Fig. 9(a)] in all electrically failed interconnections. As illustrated in Figs. 9(b) and 10(a), cracks can occasionally propagate relatively far without distinguishable recrystallization (rotation of solidification colonies are visible, however), but they were not observed to have propagated entirely through the interconnections without its influence. After the initiation of recrystallization of solder interconnections, the recrystallized volume gradually expanded over the diameter of the interconnections as the cycling was continued as illustrated in Fig. 11. After the recrystallization had initiated, cracks were not observed to have propagated further than the recrystallized region. Thus, it seems evident that the networks of the newly formed grain boundaries provide favorable sites for cracks to propagate intergranularly with less energy than in the solidification colonies.
Cross-polarized images of solder interconnections after thermal cycling for 90 days: (a) SAC interconnections on Cu|OSP and (b) SAC interconnections on Ni(P)|Au.

Cross-polarized and SEM images of SnAgCuBi solder interconnections after thermal cycling for 90 days: (a) cross-polarized image, (b) SEM image, (c) higher magnification of A and B areas in (b), and (d) Ag mapping of (c).

Microstructure of a SnAgCuNi interconnection after thermal cycling for 60 days: (a) cross-polarized and (b) SEM micrographs; 80 days: (c) cross-polarized and (d) SEM micrographs; 90 days: (e) cross-polarized and (f) SEM micrographs.

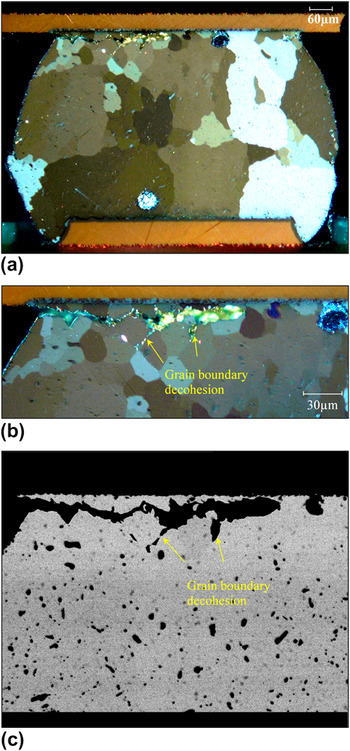
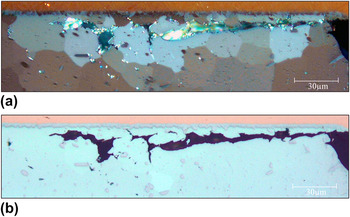
Decohesions of the grain boundaries were frequently observed as shown in Fig. 12. It is highly likely that the cohesion between the recrystallized Sn grains is low due to the fact that impurities as well as the intermetallic particles are expelled from the growing recrystallized grains and pushed into the grain boundaries. Furthermore, the formation of new grain boundaries by recrystallization also provides good preconditions for plastic deformation by grain boundary sliding. The recrystallized regions are therefore more easily deformed plastically than the surrounding regions and the damage accumulation in the recrystallized regions is increased. Significant grain boundary sliding can cause cavitation along the grain boundaries and thereby enhance the propagation of cracks through the recrystallized regions. Finally, the thermomechanical anisotropy of the (recrystallized) Sn grains can also enhance the nucleation and propagation of microcracks along their boundaries as the value of the CTE of Sn single crystal in the [001] directions is about two times that in the [100] = [010] direction.Reference Pearson39 Occasionally, when the recrystallized grain size was larger, cracks were found to propagate also transgranularly (Fig. 13). It seems that the cracks tend to propagate transgranuarly only when the stress state, orientation, and geometry of the grains are not in favor of cracking along the grain boundaries.
(a, b) Cross-polarized and (c) SEM micrographs of the SACN interconnections on the Ni(P)|Au after thermal cycling for 90 days.

(a) Higher magnification cross-polarized and (b) bright-field micrographs of the recrystallized region in Fig. 6.

IV. CONCLUSIONS
(1) The critical solder interconnections of the BGA packages were under the chip corners, and the stress concentration areas were on the component side corner regions on the package edge side of the diagonal cross sections of the solder interconnections.
(2) No significant differences were found between the microstructures with Ni(P)|Au and OSP protective coatings, except that the Cu6Sn5 particles were more numerous in the interconnections soldered on the Cu|OSP PWB pads.
(3) Higher numbers of solidification colonies were found in the as-solidified microstructures of the SnAgCuNi solder interconnections compared with those of the SnAgCu and SnAgCuBi solder interconnections, which typically were composed of only one or two solidification colonies with different crystal orientations. Within solidification colony there is a cellular structure of β-Sn (cells surrounded by small Ag3Sn and Cu6Sn5 particles) in which the difference in crystal orientations between individual cells is small (below 3°). The difference in crystal orientation between the colonies is high (above about 15°).
(4) Two different types of changes of the as-solidified microstructures were identified, and both changes were highly localized at the strain concentration regions of the solder interconnections.
(i) Formation and rotation of the subgrains by recovery.
(ii) The discontinuous change of microstructures into more or less equiaxed grain structure by recrystallization.
(5) Nanoindentation test showed decreased hardness in the recrystallized regions compared with the nonrecrystallized regions of the same cross section.
(6) Nucleation of cracks was observed to take place before the change of microstructures by recrystallization, but the propagation of cracks was influenced by the formation of the networks of grain boundaries by recrystallization in all electrically failed interconnections.
ACKNOWLEDGMENTS
The authors would like to thank Prof. Emer. Jorma Kivilahti for his inextinguishable enthusiasm for the topics discussed in this article. The author would like to thank Dr. V. Vuorinen for his valuable discussion and help in the SEM studies. The authors would also like to thank Mr. Jussi Hokka for his help in sample preparation and managing the thermal cycling tests. The Academy of Finland is acknowledged for funding this work.