Introduction
Economic and environmental costs are associated with the use of inorganic phosphorus (P) fertilizers, which are manufactured by reacting insoluble phosphate rock (PR) with sulfuric acid to produce water-soluble phosphoric acid (PA). Owing to be the major P source, PR is presently consumed at 170 million tons per annum in the world for the manufacture of commercial P fertilizers (Cordell et al., Reference Cordell, Drangert and White2009; Gilbert, Reference Gilbert2009). This huge consumption of nonrenewable resource is posing a threat to the exploitable reserves.
In P-deficient soil, crop requirement is generally fulfilled by applying inorganic P fertilizers. However, the soluble P fertilizers suffer from various physicochemical reactions which lead to low (<20%) P-use efficiency (PUE) in alkaline calcareous soils (Akhtar et al., Reference Akhtar, Tahir, Ashraf, Akhter and Alam2011). The fertilizer-induced increase in concentration of orthophosphates (H2PO4 −/HPO4 2−) in soil solution (Cp) is short lived due to conversion of P ions into insoluble precipitates and/or adsorption on soil solids. The adsorbed portion can take part in maintaining the concentration of P ions in the soil solution for plant uptake. An efficient release from soil solids to replenish the decline in solution phase generally maintains optimum P supply during the crop growth and ensures better yields. This transformation of P ions in soil can be measured by sorption studies and process-based models (involving 32P labeling) that are able to assess both immediately available pool (Cp) and total availability or exchangeable P ions (E-value) present at soil solid solution interfaces. The Freundlich model illustrates P sorption phenomena in soil as a function of Cp at steady-state condition (Hashmi et al., Reference Hashmi, Khan, Akhtar, Sarwar and Khan2017), whereas E-value describes the total sum of Cp and diffusible P ions present in soil solids (Hussain et al., Reference Hussain, Ghafoor, Anwar-Ul-Haq and Nawaz2003).
In case of assessing plant uptake from applied fertilizer, the 32P labeling technique is deemed as the most accurate tool to differentiate between the portion of P ions derived from applied fertilizer (Pdff) and that from native soil (Pdfs). This technique also quantifies the amount of P actually taken up by plants, commonly referred as the L-value. The indirect isotope labeling can be employed for quantifying P uptake from applied sources without disturbing their physical and chemical nature (Nanzer et al., Reference Nanzer, Oberson, Berger, Berset, Hermann and Frossard2014). In this method, the P ions present in soil solids are labeled with 32P [(½ life = 14.3 days) or 33P (½ life = 25.3 days)] to distinguish the fraction of P from the applied fertilizer (Hashmi et al., Reference Hashmi, Khan, Akhtar, Sarwar and Khan2017).
Previous research revealed that placement of PA near root zone resulted in higher P uptake and crop yield as compared to conventional broadcast application of diammonium phosphate (DAP) (Hashmi et al., Reference Hashmi, Khan, Akhtar, Sarwar and Khan2017). The higher efficiency of localized P application was attributed to lower reactivity of the applied fertilizer with soil colloids indicating that higher plant availability could be achieved by confining exposure of soluble P fertilizer to soil particles. As inorganic phosphate application along with animal manure also reduces its direct contact with soil colloids, it could enhance availability of inorganic fertilizers. Besides increasing soil fertility and crop productivity due to presence of essential nutrients, farmyard manure (FYM) is well known to improve efficiency of the inorganic fertilizer when applied in association (Abril et al., Reference Abril, Baleani, Casado-Murillo and Noe2007). The integrated use of organic and inorganic fertilizers is valuable in many ways as it maintains nutrient supply, provides organic carbon to soil microbes, and mobilizes soil-bound nutrients on decomposition through the release of organic acids (Sharma et al., Reference Sharma, Sayyed, Trivedi and Gobi2013). The oxalate present in the decomposition products may precipitate free Ca2+ and hence reduces its activity for further reaction with soluble P in soil (Rosling et al., Reference Rosling, Suttle, Johansson, van Hees and Banfield2007).
The present study was carried out to elucidate whether FYM and inorganic P would influence sorption reactions, modifying plant-available P ions in soil, and consequently improving the PUE and productivity of wheat crop. Both applied and mechanistic approaches (i.e., using 32P labeling technique and P transformations in soil) were used to study the influence of inorganic P fertilizer as sole and in combination with FYM on P supply in soil and on productivity of wheat grown in an alkaline calcareous soil.
Materials and Methods
Soil description
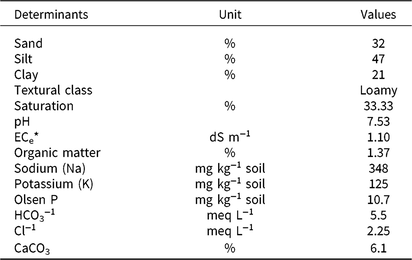
The surface soil (0–20 cm) was collected from the experimental farm of Agricultural Mechanization Research Institute (AMRI), Faisalabad, Pakistan. The soil was used for laboratory and greenhouse experiments. The soil was air-dried, sieved (<2 mm), and analyzed for physicochemical properties: pH; electrical conductivity of saturated soil-paste extract (ECe); calcium carbonate; soil texture; potassium (K); Olsen P; and organic matter, following the standard procedures described by Hashmi et al. (Reference Hashmi, Khan, Akhtar, Sarwar and Khan2017). Soil properties are shown in Table 1.
Main soil properties

* ECe = electrical conductivity of saturated soil-paste extract; HCO3−1 = bicarbonates; Cl−1 = chloride ions; CaCO3 = calcium carbonate.
The composition of inorganic P fertilizers used during incubation and greenhouse experiments was also determined. The DAP is a compound fertilizer and alkaline in nature with initial pH of 8.1 in saturated fertilizer extracts. It contained 20% P and 18% N. The PA (purity, 75%) had an initial pH of 1.0 and contained 23.6% P. The FYM contained 0.71% N, 0.10% P, and 0.47% K on dry weight basis.
Experimental treatments
The study consisted of five fertilizer treatments: (1) Control, without P and FYM; (2) DAP+FYM; (3) PA+FYM; (4) sole DAP; and (5) sole PA. In combined treatments, P fertilizer (DAP or PA) and FYM were combined in 1:2 ratio (1-g P fertilizer mixed with 2-g FYM) and applied to the corresponding pots. All P fertilizer treatments were maintained at 36 mg P kg−1 soil. The FYM was ground and passed through a 2-mm sieve. Mixing of P fertilizer and FYM was carried out in a blender for homogenous mixture and water was sprayed to keep the moisture content at 15% and avoid dust. Treatments were replicated three times and there were 15 experimental units (5 treatments × 3 replicates) in total. In treatments receiving sole P fertilizers (PA or DAP), a similar amount of FYM (as added by combined treatments) was applied and mixed thoroughly in the bulk soil during soil preparation to balance organic matter and nutrient content. The P fertilizer mixing with manure was intended to overlap the inorganic P ions, restricting sorption reaction of soluble fertilizer in soil and thus improving its mobility/availability to plant (Moradi et al., Reference Moradi, Sadaghiani, Sepehr and Mandoulakani2012).
Experiment 1: assessing P uptake by wheat seedling
In this experiment, indirect labeling technique was employed by tagging native P in soil with 32P radioisotope to distinguish the proportion of P taken up by plant and derived from soil (Pdfs) and/or fertilizer (Pdff). In this method, P ions present on soil solid were labeled instead of fertilizer. The experiment was conducted for 45 days due to short half-life (14.3 days) of 32P, using 2 kg soil pot−1 on oven dry basis. To label the native soil P before application of fertilizer treatments, a solution (2 mL) containing known initial radioactivity (R = 0.37 M Bq) as carrier-free 32P labeled ions was applied to each soil and mixed thoroughly in a plastic tray (to ensure homogenous labeling of the native soil P). Four plants of wheat cv. Galaxy 2013 were grown in early November 2016 to have sufficient biomass for P fractionation studies. Plants were harvested after 45 days (at base of the stalk) and fresh weight recorded. Plant material was oven dried at 70 °C for 48 h and weighed. Plant material was digested using sulfuric acid and H2O2 (Chapman and Pratt, Reference Chapman and Pratt1961). The digested samples were analyzed for radioactivity using Liquid Scintillation Counter (Cerenkov counting, Rackbeta II Wallac®, Turku, Finland), and total P content in the extract was determined using Barton’s reagent yellow color method.
Determination of L-value
The labile P pool (L-value), i.e., the isotopically available P taken up by plant (Kvarnström et al., Reference Kvarnström, Morel and Krogstad2004), was calculated using 32P and total P uptake (Pt) by plants. These calculations are based on the assumption that the radioactivity introduced (R) is diluted homogeneously in the isotopically available pool in which all P fractions have the same isotopic composition. The radioactivity remaining in soil solution (r) was measured using liquid scintillation counter (Packard TR 1100, Packard Instrument Company, Meriden, CT, USA), following empirical equations:
 $${{\rm{R}} \over {\rm{L}}} = {\rm{}}{{\rm{r}} \over {{\rm{Pt}}}}$$
(1)
 $${\rm{L}} = {\rm{Pt}} \times {\rm{}}{{\rm{R}} \over {\rm{r}}}{\rm{}}$$
(2)
Radioactivity in plant samples at harvest or plant activity (r/R) was determined to calculate the specific activity (SA) by using the following equation (Achat et al. Reference Achat, Sperandio, Daumer, Santellani, Prud’Homme, Akhtar and Morel2014):
 $${\rm{SA}}\left( {{\rm{m}}{{\rm{g}}^{ - 1}}} \right) = {{{\rm{Plant \ activity}}\left( {{\rm{kBq}}} \right)} \over {{\rm{Pt}}\left( {{\rm{mg}}} \right){\rm{}}}}$$
(3)
When applying fertilizer treatments to a soil wherein native fraction has already been labeled (indirect method) (Nanzer et al., Reference Nanzer, Oberson, Berger, Berset, Hermann and Frossard2014), plant P derived from soil (Ps), from the applied fertilizer (Pf), and the fraction of total P (Pt) derived from applied fertilizer (Pdff, %) and soil (Pdfs, %) were calculated as follows (Achat et al. Reference Achat, Sperandio, Daumer, Santellani, Prud’Homme, Akhtar and Morel2014):
 $${\rm{Ps}} = {\rm{}}{{{\rm{Pt}}\left( {{\rm{control}}} \right) \times {\rm{r}}\left( {{\rm{fertilized}}} \right)} \over {{\rm{r}}\left( {{\rm{control}}} \right)}}$$
(4)
 $${\rm{Pf}} = {\rm{Pt}} - {\rm{Ps}}$$
(5)
 $${\rm{Pdff}}\left( {\rm{\% }} \right) = {{{\rm{Pf}}} \over {{\rm{Pt}}}} \times {\rm{}}100$$
(6)
 $${\rm{Pdfs}}\left( {\rm{\% }} \right) = 100 - {\rm{Pdff}}$$
(7)
Experiment 2: assessing soil P fluxes
Before applying fertilizer treatments (as described for Experiment 1), the soil was conditioned for 7 weeks at 70% water-holding capacity. Soil samples (500 g) were treated (in triplicate) in plastic containers arranged in a completely randomized design (CRD). The treated soil was again incubated at 25±1 °C and maintained at 70% water-holding capacity, replenishing water loss twice a week. After incubation for further 7 weeks, 2 g of soil were removed (another sample was used to determine moisture content) and mixed with 20-mL solution with increasing P concentrations from 0 to 100 μg mL−1, supplied as KH2PO4. The soil solutions were shaken for 24 h to achieve equilibrium and filtered through Whatman #42 filter paper. Phosphorus concentration in the filtrate was determined following the standard method (Olsen, Reference Olsen1954). The Freundlich sorption isotherms were evaluated as proposed by LeMare (Reference LeMare1982), which represent the nonlinear adsorption of P ions on soil solid with increasing P concentration in soil solution as shown in the empirical equation:
 $${\rm{Psd}}\; = \;{\rm{aC}}{{\rm{p}}^{b/a}}$$
(8)
The above equation is a typical Freundlich model equation, where Psd is the amount of P adsorbed (μg g−1 soil); Cp is the concentration of P in soil solution (μg mL−1) at steady-state condition; and a and b are constants, which denote the amount of P initially adsorbed and the buffering capacities, respectively. The constants a and b were determined by linear regression (Figure S1 in Supplementary Material), while the theoretical P rates were determined using the fitted model equation as done by Hashmi et al. (Reference Hashmi, Khan, Akhtar, Sarwar and Khan2017).
Similarly, a second set of soil solution suspension in 1:10 ratio (1 g soil: 10 mL solution) with increasing P concentration (0–100 µg mL−1, as KH2PO4) was equilibrated to determine the exchangeable P ions (E-value) at the soil solid–solution interface. The E-value includes both the P ions present in soil solution and soil solid as diffusible one (Frossard and Sinaj, Reference Frossard and Sinaj1997). The soil suspension was shaken gently at 60 rpm for 40 h to reach equilibrium. The P ions in the soil solution were labeled by introducing known amount of radioactivity (0.1 mL solution of 32P ions present in soil suspension, containing approximately 0.02 MBq of initial radioactivity, called as R) (Achat et al., Reference Achat, Sperandio, Daumer, Santellani, Prud’Homme, Akhtar and Morel2014). At desired time intervals (3, 30, and 300 min), 2-mL suspension were filtered through a 0.2-µm disposable syringe filter and the filtrate analyzed for Cp by ascorbic acid blue color method (Murphy and Riley, Reference Murphy and Riley1962). The radioactivity remaining in the solution (r) was measured by the liquid scintillation counter (Packard TR 1100, Packard Instrument Company, Meriden, CT, USA). The E-value was calculated after the three elapsed times of isotopic dilution, assuming that R is diluted to E and that all P fractions have the same isotopic composition:
 $${{\rm{R}} \over {\rm{E}}} = {\rm{}}{{\rm{r}} \over {{\rm{Qw}}}}$$
(9)
 $${\rm{E}} = {\rm{Qw}} \times {\rm{}}{{\rm{R}} \over {\rm{r}}} = {\rm{}}{{{\rm{Qw}}} \over {\left( {{{\rm{r}} \over {\rm{R}}}} \right)}}$$
(10)
where r/R reaches to maximum possible dilution when all inorganic P from soil solid takes part in the isotopic dilution (r/R = Qw). Simulated extrapolation in r/R values were subsequently used to calculate the amounts of isotopically exchangeable P ions at the desired time (for 45 days) by using the following equation (Achat et al. Reference Achat, Sperandio, Daumer, Santellani, Prud’Homme, Akhtar and Morel2014):
 $${{\rm{r}} \over {\rm{R}}} = {\rm{}}{{{\rm{r}}\left( {1{\rm{min}}} \right)} \over {{\rm{Qw}}}}{\rm{}} \times {\rm{time}}$$
(11)
Experiment 3: assessing wheat yield and P-use efficiency
The effects of different P fertilizer sources applied as sole and in combination with FYM were also evaluated for yield, P uptake, and PUE by wheat plants. All the growth conditions were similar to those of Experiment 1. Both Experiments 1 and 3 were started during the fall cropping season (sowing in early November 2016); Experiment 1 was harvested 45 days after emergence, while Experiment 3 was harvested at crop maturity (May 2017). Moreover, 5 kg of the sieved soil per pot was mixed thoroughly after application of fertilizer treatments. Eight wheat seeds cv. Galaxy 2013 were sown per pot and then thinned to four seedlings 5 days after germination. All the five experimental treatments were laid out in CRD and replicated three times. The recommended doses of potassium (potassium sulfate) and zinc (zinc sulfate) were also applied to each pot at the time of sowing, with exception of nitrogen. Nitrogen was applied in two equal splits at sowing and tillering stages.
Plants were harvested at maturity, oven dried (70 °C, 48 h), separated into straw and grain components, and weighed to determine grain yield and biomass (grain + straw) yield. Harvest index (%) was calculated as follows:
 $${\rm{Harvest \ index}}\ \left( {\rm{\% }} \right) = {\rm{}}{{{\rm{Grain \ yield}}} \over {{\rm{Biomass \ yield}}}} \times {\rm{}}100{\rm{}}$$
(12)
Phosphorus uptake (grain + straw) and PUE by wheat are determined by using the following equations (Hashmi et al., Reference Hashmi, Khan, Akhtar, Sarwar and Khan2017):
 $${\rm{P \ uptake}}\ \left( {{\rm{g}}/{\rm{plant}}} \right) = {\rm{}}{{{\rm{Yield}}\left( {{\rm{g}}/{\rm{plant}}} \right){\rm{}} \times {\rm{plant \ P}}\left( {\rm{\% }} \right)} \over {100}}{\rm{}}$$
(13)
 $${\rm{PUE}}\left( {\rm{\% }} \right) = {\rm{}}{{{\rm{P \ uptake}}\left( {{\rm{fertilized}}} \right) - {\rm{P \ uptake}}\left( {{\rm{control}}} \right)} \over {{\rm{P \ applied}}\left( {{\rm{mg}}/{\rm{kg}}} \right){\rm{}}}} \times 100$$
(14)
Statistical analysis
Data were subjected to the analysis of variance using Statistix 8.1 software (Analytical Software, Tallahassee, FL, USA) and treatments were compared by the Tukey’s HSD test. The Pearson’s correlation coefficients were employed to analyze the relationships between labile P (L-value) and the crop parameters including PUE, grain, and biomass yields.
Results
Phosphorus uptake by wheat seedling
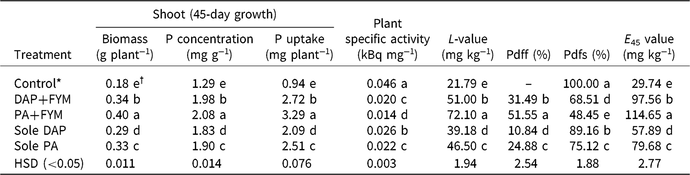
The results of isotopic tracer technique showed significant effects of fertilizer amendments on P uptake and on biomass production during the vegetative growth of wheat seedlings. The lowest biomass (0.18 g plant−1) was produced under control conditions, whereas a significant improvement was recorded due to P application (Table 2). Application of PA and DAP in combination with FYM produced higher biomass than their sole applications. Among fertilizer treatments, PA+FYM caused the highest biomass (0.40 g plant−1) followed by DAP+FYM, whereas the lowest biomass production (0.29 g plant−1) was recorded with sole DAP (Table 2). A similar trend was also observed for P uptake by wheat seedling.
Wheat seedling biomass, phosphorus uptake, portion of P derived from native soil or applied fertilizer and change in E-value and L-value by manure-amended phosphate fertilizers

* Control = zero P applied; PA = phosphoric acid; DAP = diammonium phosphate; FYM = farmyard manure; Pdff = P derived from fertilizer;Pdfs = P derived from soil; HSD = honest significant difference.
† Numbers in columns sharing the same letter(s) do not differ significantly at P<0.05.
The isotopic exchange occurred between exchangeable 31P ions present in soil solid and 32P (radioisotope) ions present in soil solution. This exchange caused reduction in the SA of the fertilized plant. The highest SA (0.046 kBq mg−1) was observed in control treatment, while the lowest one (0.014 kBq mg−1) in PA+FYM treatment (Table 2). The contribution of P derived from applied fertilizers (Pdff) to the plant P uptake was lower in sole P application (Table 2). The minimum Pdff by wheat seedling was observed in sole DAP treatment (11%). Combining the P fertilizer with FYM improved Pdff (+52%) in PA+FYM treatment. The increase in Pdff values also increased the L-value while decreased the portion of P derived from soil (Pdfs) in total P uptake. The results clearly showed that combined application of PA or DAP along with FYM increased P accumulation during early growth stage of wheat seedlings. In general, PA applied as sole or in combination with FYM was better than the corresponding DAP treatments in improving crop growth.
Soil P fluxes
Phosphorus sorption assay described treatment-induced variation in P sorption as a function of P concentration in soil solution (Figure S1 in Supplementary Material). The parameters of fitted sorption equation exhibited higher values for unfertilized control as compared to the soils receiving fertilizer treatments (Table 3). The fitted regression equation showed an exponential increase in the P sorption with increasing P concentration in soil solution. The fitted model equation showed good fitness for all treatments, with R 2 values ranging from 0.81 to 0.89 (Table 3). The fitted equations exhibited that relatively lower P application to FYM-amended fertilizer soils was required for producing desired P concentration (i.e., 0.2 μg P mL−1) in soil solution (Table 3). Relatively higher P adsorption in the unfertilized soil and sole fertilizer-P treatments was found as compared to FYM-amended soils. This can be attributed to the presence of higher unsaturated adsorption sites in control or sole P treatments, whereas to the presence of lower unfilled sites in manure-amended treatments. Hence, to attain the desired P concentration (0.2 μg P mL−1) in solution, the soil amended with sole DAP required higher P (7.07 mg kg−1) than that of DAP+FYM (3.84 mg P kg−1). However, the PA+FYM treatment required the lowest P (2.97 mg kg−1) to produce the similar P concentration (0.2 μg P mL−1) in soil solution (Table 3). These findings indicate better efficiency of FYM-amended P fertilizer as compared to their sole application while acidic fertilizer such as PA depicted even higher efficiency as compared to DAP in the alkaline calcareous soil.
Fitted Freundlich equation, its parameters (a and b) and the amount of P (mg kg−1) required to achieve desired solution P concentration (0.2 μg mL−1) for amended soils

* Control = zero phosphorus applied; FYM = farmyard manure; DAP = diammonium phosphate; PA = phosphoric acid.
† Phosphorus required to achieve desired P concentration (0.2 μg mL−1) of soil solution; a parameter = initial P sorption; b parameter = buffering capacity (mL g−1).
‡ Means ± standard error.
The data on gross fluxes of P ions (by involving 32P isotope to the equilibrated soil suspension) have demonstrated the ability of P-treated soils to modify the components of readily available P ions present in soil solution and slowly diffusible P ions at soil solid phase, collectively denoted as exchangeable P value or simply E-value (Achat et al., Reference Achat, Sperandio, Daumer, Santellani, Prud’Homme, Akhtar and Morel2014). The E-value was calculated for 45 days, as considered for L-value. The highest E-value (114.65 mg kg−1) was obtained in PA+FYM treatment while the lowest E-value (29.74 mg kg−1) was observed in unfertilized control. The change in E-value followed the similar trend as obtained for L-value (Table 2).
Wheat yield and P-use efficiency
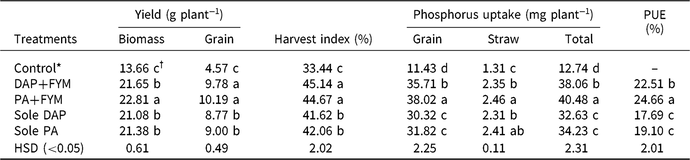
Results of greenhouse studies generally showed higher efficiency of FYM-amended P fertilizers (i.e., PA and DAP) as compared to their sole application (Table 4). The PA+FYM produced significantly higher biomass yield (22.81 g plant−1), while sole DAP and sole PA produced lower biomass (21.08 and 21.38 g plant−1, respectively), although it was still significantly higher than that produced by control (13.66 g plant−1). Among P-fertilized treatments, the PA+FYM produced significantly higher grain yield (10.19 g plant−1); however, it was statistically at par with that of DAP+FYM treatment (9.78 g plant−1). The lower grain yield was produced by sole DAP (8.77 g plant−1), which was statistically similar to one found in sole PA treatment (9.00 g plant−1); the yields in P fertilized treatments were significantly higher than that of control (4.57 g plant−1).
Wheat yield components, P uptake, and P-use efficiency as affected by the fertilizer treatments

* Control = zero phosphorus applied; FYM = farmyard manure; DAP = diammonium phosphate; PA = phosphoric acid; PUE = phosphorus use efficiency; HSD = honest significant difference.
† Numbers in columns sharing the same letter(s) do not differ significantly at P< 0.05.
Total P uptake by straw and grain of wheat was improved by P fertilizers, whereas the highest total P uptake (40.48 mg plant−1) was recorded in PA+FYM treatment, followed by DAP+FYM (38.06 mg plant−1). The sole DAP and sole PA treatments showed lower accumulation of total P (32.63 and 34.23 mg plant−1), respectively. As compared to sole fertilizer-P application, FYM-amended PA and DAP accumulated 18 and 17% higher total P in wheat, respectively.
In general, both inorganic P fertilizer sources caused higher PUE when applied in combination with FYM (Table 4). The highest PUE (24.6%) was recorded in PA+FYM treatment, followed by DAP+FYM (22.5%), whereas lower PUE (17.7 and 19.1%) was observed in sole DAP and sole PA treatments, respectively.
Regression analysis of L-value vs. crop components
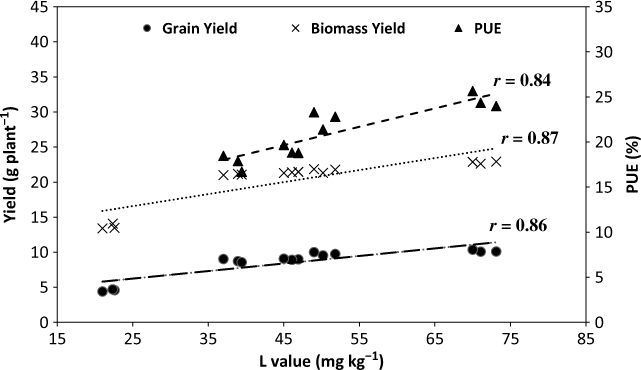
The L-value indicates the fraction of labile P that is actually available for plant uptake during active growth phase. The L-value calculated by isotopic labeling technique showed strong correlation with grain yield (Figure 1).
Pearson correlation (r) of Labile P (L-value) with grain yield (g plant−1), biomass yield (g plant−1), and P-use efficiency (PUE, %) in wheat crop.

Discussion
Plants can take up P from native soil pool and/or from applied fertilizer and this study was carried out to (i) elucidate the reason whether FYM-amended P fertilizer can improve P uptake and biomass production of wheat during vegetative stage and to (ii) reveal the relative contribution of native soil P and the applied fertilizer-P in P uptake and yield of wheat grown in alkaline calcareous soil. As evident from our results, co-application of animal manure with the inorganic phosphate fertilizer was found to induce higher P uptake and yield of wheat as compared to sole application of the inorganic P fertilizer. The DAP+FYM and PA+FYM caused higher P uptake (30 and 31%, respectively) and higher biomass yield (17.2 and 21.2%, respectively) of wheat seedlings after 45-day of emergence, as compared to sole application of respective fertilizers (Table 2). In manure-amended P treatments, the higher P uptake and biomass yield could be attributed to higher P supply in soil as evident from higher E-values in DAP+FYM (97.56 mg kg−1) and PA+FYM (114.65 mg kg−1) than that of sole DAP (57.89 mg kg−1) and sole PA (79.68 mg kg−1). Through the isotopic labeling technique it is possible to evaluate exchange between the P ions present in soil solid phase (31P) and those present in soil solution (32P), which causes a decline in radioactivity in soil solution due to entry of unlabeled P ions from soil solid (McLaughlin et al., Reference McLaughlin, Alston and Martin1987). Similarly, the higher contribution of native P in soil apparently increases the proportion of P derived from the soil (Pdfs) and decreases the portion of P derived from fertilizer (Pdff), and vice versa (Bertrand et al., Reference Bertrand, McLaughlin, Holloway, Armstrong and McBeath2006). In earlier studies, the relative efficiency of different P sources was evaluated in wheat grown on calcareous soils wherein PA was found more efficient than DAP in improving P uptake and yield parameters (Akhtar et al., Reference Akhtar, Yaqub, Naeem, Ashraf and Hernandez2016). Earlier studies also reported higher efficiency of acidic P source, i.e., single superphosphate over that of alkaline one (DAP) in improving the biomass yield of wheat in alkaline calcareous soil (Lu et al., Reference Lu, Chien, Henao and Sompongse1987).
In calcareous soil, high P availability from acidic P fertilizer (PA) has been attributed to low fixation of the acidic source compared to the alkaline P source, i.e., DAP (Akhtar et al., Reference Akhtar, Yaqub, Naeem, Ashraf and Hernandez2016; Hashmi et al., Reference Hashmi, Khan, Akhtar, Sarwar and Khan2017). While manure mixing with fertilizer restricts direct exposure of inorganic P to soil, thus decreasing sorption reactions and increasing P availability to plant (Moradi et al., Reference Moradi, Sadaghiani, Sepehr and Mandoulakani2012), the formation of protective layer around fertilizer particles by physically overlapping of P ions or exchange sites thus inhibits their reactivity to some extent (Von Wandruszka, Reference Von Wandruszka2006). The effectiveness of inorganic fertilizers increases because of partial saturation of adsorbing sites by the organic anions produced through organic matter decomposition (Moradi et al., Reference Moradi, Sadaghiani, Sepehr and Mandoulakani2012). Such release of organic compounds enhances P availability in soil either by keeping applied P in soluble form or by mobilizing soil-bound P due to ligand exchange reactions (Wang et al., Reference Wang, Whalen, Chen, Cao, Huang, Lu and Shi2016). Organic anions such as oxalate, malate, and citrate produced by mineralization of FYM compete for sorption sites and thus reduce the phosphate adsorption in soil, which otherwise could be precipitated as calcium phosphate minerals in alkaline calcareous soils. Organic anions as oxalates react with free Ca2+ ions in soil and convert it to precipitate of calcium oxalate (CaC2O4), thus suppressing the activity of Ca2+ in soil and increasing P availability for plant uptake (Ström et al., Reference Ström, Owen, Godbold and Jones2001). Together, these mechanisms lower down the P fixation process and maintain higher P availability to plant in calcareous soils (Ma and Xu, Reference Ma and Xu2010).
Herein, L-value assessed by 32P labeling technique in greenhouse depicts P ions actually taken up by wheat plant, whereas E-value determines exchangeable (i.e., plant available) P ions present in soil (Achat et al., Reference Achat, Sperandio, Daumer, Santellani, Prud’Homme, Akhtar and Morel2014). Interestingly, the results obtained either from laboratory or greenhouse conditions showed strong correlation; an increase in E-value from 29.74 to 114.65 mg kg−1 caused a corresponding increase in L-value (range: 21.79–72.10 mg kg−1) (Table 2). Previous studies have also found positive and significant relationships between L- and E-values (Achat et al., Reference Achat, Sperandio, Daumer, Santellani, Prud’Homme, Akhtar and Morel2014; Frossard et al., Reference Frossard, Morel, Fardeau and Brossard1994). However, there were no strict relationships (1:1) observed between L- and E-values for similar time periods. The deviation from the ideal relationship was probably due to different experimental conditions in both laboratory and greenhouse studies. The strong positive relationship between the L-value and crop variables (yield and PUE) showed that the L-value measured at vegetative growth was consistent with the overall yield components (grain and biomass yields) and PUE in wheat. Our findings revealed the importance of collateral studies, where the laboratory observations (e.g., P availability in soil) may be used as an indicator of the crop responses (e.g., biomass production) under greenhouse condition (Achat et al., Reference Achat, Sperandio, Daumer, Santellani, Prud’Homme, Akhtar and Morel2014; Nanzer et al., Reference Nanzer, Oberson, Berger, Berset, Hermann and Frossard2014).
Conclusion
Our results clearly suggest integrated use of inorganic P fertilizer with FYM as an efficient technique to improve P supply and plant P uptake, boosting early growth and yield of wheat. As there is low efficiency of P fertilizers in alkaline calcareous soil, the co-application of DAP or PA with FYM is recommended for enhancing PUE and wheat productivity.
Supplementary Materials
For supplementary material for this article, please visit https://doi.org/10.1017/S0014479719000097
Author ORCIDs
Wasiq Ikram 0000-0003-1066-4778
Acknowledgments
The authors are thankful to Abdul Jabbar and Iftikhar Anjum of Pakistan Institute of Nuclear Science and Technology, Islamabad for facilitating analysis of radioactivity in soil and plant samples. We are also grateful to Nasim Akhtar for extending their support in keeping safety measures during experimentation. The financial/logistic supports from Pakistan Institute of Engineering and Applied Sciences and Pakistan Agriculture Research Board are also sincerely acknowledged.
Financial support
None.