I. INTRODUCTION
Fabrication of nanostructured magnetic materials represents one of the most promising fields of applied nanotechnology. Reference Hadfield1–Reference Siegel4 Magnetite nanocrystals find application in many important areas of technology and nanoscience, from ferrofluidic devices, Reference Sahoo, Goodarzi, Swihart, Ohulchanskyy, Kaur, Furlani and Prasad5 electromagnetic shielding, Reference Azadmanjiri, Hojati-Talemi, Simon, Suzuki and Selomulya6 spintronics, Reference McKenna, Hofer, Gilks, Lazarov, Chen, Wang and Ikuhara7 quantum computing, Reference Berdunov, Mariotto, Balakrishnan, Murphy and Shvets8 and high-density data storage, Reference Bird, Galloway, Rawlings, Bramble and Staniland9 to diagnostic medicine and targeted drug delivery. Reference Sun, Zeng, Robinson, Raoux, Rice, Wang and Li10–Reference Prozorov, Bazylinski, Mallapragada and Prozorov14 While the synthetic production of monodisperse, magnetic nanocrystals with narrow size distribution at ambient temperature remains challenging, many microorganisms such as magnetotactic bacteria have found a way to master this process and biomineralize structurally perfect magnetite nanocrystals at physiological conditions. Reference Bazylinski and Frankel15–Reference McKay, Friedmann, Frankel and Bazylinski19 As mentioned several times in this special edition, biomineralization is the process of the production of minerals by living organisms, Reference Mann20,Reference Lowenstam and Weiner21 and magnetite can be found as biomineral precipitate in four out of the five kingdoms of living organisms (Monera, Proctista, Animalia, and Plantae). Reference Prozorov22 Magnetotactic bacteria produce intracellular nanometer-sized magnetic crystals surrounded by a phospholipid bilayer membrane, called magnetosomes, typically organized in chains. Reference Bazylinski and Frankel15,Reference Faivre16,Reference Gorby, Beveridge and Blakemore23,Reference Faivre and Godec24 Magnetosome magnetite nanocrystals exhibit nearly perfect crystal structures with narrow size distribution and species-specific morphologies, leading to well-defined magnetic properties, which are often superior to their synthetic counterparts. Reference Prozorov, Bazylinski, Mallapragada and Prozorov14,Reference Frankel17,Reference Arakaki, Nakazawa, Nemoto, Mori and Matsunaga25,Reference Bazylinski and Frankel26 As a result, the magnetite biomineralization in these microorganisms is of fundamental interest to diverse disciplines, from biotechnology to astrobiology. Reference Prozorov, Bazylinski, Mallapragada and Prozorov14,Reference McKay, Friedmann, Frankel and Bazylinski19,Reference McKay, Gibson, Thomas-Keprta, Vali, Romanek, Clemett, Chillier, Maechling and Zare27–Reference Klem, Young and Douglas33 However, the potential use of magnetosomes in nanotechnology is limited by the difficulty in producing large quantities of magnetite, mostly due to the tedious growth of magnetotactic bacteria. Reference Prozorov, Bazylinski, Mallapragada and Prozorov14,Reference Heyen and Schüler34–Reference Valverde-Tercedor, Montalban-Lopez, Perez-Gonzalez, Sanchez-Quesada, Prozorov, Pineda-Molina, Fernandez-Vivas, Rodriguez-Navarro, Trubitsyn, Bazylinski and Jimenez-Lopez36 Understanding the magnetite biomineralization in these organisms in terms of crystal formation, as well as the involvement of biological macromolecules and cellular processes, is of fundamental interest to scientists, because similar principles can be used to develop synthetic nanomaterials with desired morphological and structural control. If the intricate pathways used by bacteria to build complex intracellular structures can be revealed, the findings could be ultimately applied to rational design of synthetic nanomagnetics for specific applications. Reference Prozorov, Bazylinski, Mallapragada and Prozorov14,Reference Valverde-Tercedor, Montalban-Lopez, Perez-Gonzalez, Sanchez-Quesada, Prozorov, Pineda-Molina, Fernandez-Vivas, Rodriguez-Navarro, Trubitsyn, Bazylinski and Jimenez-Lopez36–Reference Kolinko, Lohsse, Borg, Raschdorf, Jogler, Tu, Posfai, Tompa, Plitzko, Brachmann, Wanner, Mueller, Zhang and Schueler40
Several models of magnetosome magnetite biomineralization were presented in the literature. Early reports by Frankel et al., based on Mössbauer spectroscopy, suggested that during the magnetosome biomineralization in Aquaspirillum magnetotacticum, the as-formed low-density hydrous ferric oxide dehydrates to form high-density ferric oxide, i.e., ferrihydrite. Conversion to magnetosome magnetite then proceeds by the partial reduction of Fe3+ of ferrihydrite. Reference Frankel, Papaefthymiou, Blakemore and O'Brien18 Schüler and coauthors proposed that in Magnetospirillum gryphiswaldense, following the uptake of ferric iron thorough a reduction step, magnetite forms via reoxidation of Fe2+ and partial reduction of Fe3+. Reference Schuler41 Faivre et al. used Mössbauer spectroscopy to monitor the iron uptake by the M. gryphiswaldense and proposed that iron is taken by the cells as a membrane-associated bacterial ferritin, as a separate mechanism, temporarily followed by coprecipitation of the internalized ferric and ferrous iron and formation of magnetite. Reference Faivre, Bottger, Matzanke and Schuler42 Staniland and coworkers discussed rapid direct biomineralization of structurally perfect magnetosome magnetite within 30 min, albeit without clearly evidencing the absence of magnetosome particles at the initial stage. Reference Staniland, Ward, Harrison, van der Laan and Telling43 The acquired data provided valuable insights into the magnetosome magnetite biomineralization process; however, the majority of the analytical techniques used by these groups relied on signal acquired from a large number of particles, lacking the single-particle precision, and, therefore, could not provide spatially resolved data. The high-resolution transmission electron microscopy, high angle annular dark field scanning transmission electron microscopy (HAADF-STEM), and energy dispersive x-ray spectroscopy (EDS) utilized by Baumgartner et al. to analyze involved individual magnetosomes Reference Baumgartner, Morin, Menguy, Perez Gonzalez, Widdrat, Cosmidis and Faivre44 were supplemented by the x-ray absorption spectroscopy (XAS) to probe the oxidation state of iron in large number of particles.
In this study, we investigated the biomineralization pathway of magnetite and followed the evolution of mineral phases leading to magnetite within magnetosomes of a model magnetotactic bacterium, Magnetospirillium magneticum, strain AMB-1. The biomineralization experiment was performed to single bacterial cells from cultures sampled at 0 and 30 min, and 1 day after the introduction of iron-replete growth medium. We used advanced analytical microscopy techniques to investigate the solid phases within single bacterial cells exposed to iron-rich solutions. To this end, we analyzed the sizes and crystalline structures of the magnetosome particles and probed the chemical environment of iron and oxygen in formed magnetosomes via the combination of HAADF-STEM imaging, selected area electron diffraction (SAED) and STEM-electron energy loss spectroscopy (EELS) on Fe L3 and O K-edges. The chemical and structural information obtained from the newly formed and mature magnetosomes were compared with the previously reported data. Reference Colliex, Manoubi and Ortiz45–Reference Bischoff and Motta50 Our findings provide important information on the magnetosome formation in M. magneticum, strain AMB-1, and will also aid in validation of in vitro magnetite formation and for optimization of the parameters of biomimetic magnetite synthesis.
II. RESULTS AND DISCUSSION
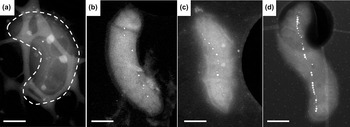
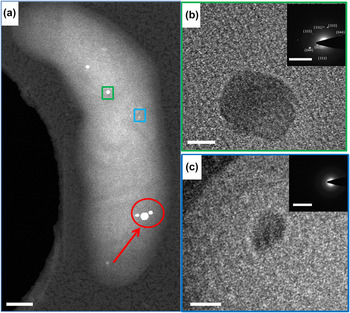
Figure 1 shows HAADF-STEM images of individual nonmagnetic bacterial cells acquired before and after exposing the bacterial culture to the iron-replete growth medium, confirming the absence of magnetosome nanocrystals before the induction of biomineralization. While the cultures used in this study are nonmagnetic, occasional, rare magnetosomes could be detected at the initial time point [Fig. 1(a)]. Exposure of nonmagnetic culture to the iron-replete growth medium leads to rapid formation of several magnetosome particles in Figs. 1(b) and 1(c). A bacterium from the culture grown under regular conditions is shown in Fig. 1(d) for comparison. Figure 2(a) shows HAADF-STEM image of a bacterial cell acquired from the sample collected 30 min after the injection of iron-replete growth medium. The larger and strongly scattering magnetosome nanocrystals in the area marked with arrow, are, most likely, present in the cell before the biomineralization induction, as they appear dense and structurally perfect. By comparison, the rest of the nanoparticles in the same bacterial cell, which appear significantly smaller and less ordered, are attributed to the onset of the biomineralization process. The large and small magnetosomes selected for the structural analysis are shown in green and blue rectangles, respectively. The SAED pattern of the larger particle in Fig. 2(b) reveals crystalline lattice with {400}, {220}, and {422} planes indexed to magnetite, while the SAED of the smaller particle in Fig. 2(c) is consistent with an amorphous structure. The plane indexed to {331} in large magnetosome was reported as a structural defect earlier by Taylor et al. Reference Taylor, Barry and Webb51
HAADF-STEM images of individual bacterial cells of M. magneticum, strain AMB-1 grown under the low-iron conditions, sampled (a) before, (b) 30 min after and (c) 1 day after the Fe-replete growth medium injection. Bacterial cell in (d) was grown under regular conditions. Scale bars: 500 nm.

(a) HAADF-STEM image of a bacterial cell obtained from the sample 30 min after induction. The bright field transmission electron microscopy (BF-TEM) images of large (green rectangle) and small (blue rectangle) magnetosomes are given in the upper and lower insets, respectively. The larger magnetosomes in the area marked with arrow are likely present in this cell before the biomineralization induction; (b) the large magnetosome is observed to be crystalline as shown in SAED with planes {004}, {220}, and {224}, indexed to magnetite; (c) SAED of the small magnetosome shows continuous diffuse rings, consistent with lack of crystalline order. Scale bars: (a) 200 nm; (b and c) 10 nm; insets: 10 nm−1.

HAADF-STEM in conjunction with EDS was previously used by Baumgartner and coworkers to produce spatially-resolved elemental maps of iron and phosphorus in localized phosphate-rich ferric hydroxide. Reference Baumgartner, Morin, Menguy, Perez Gonzalez, Widdrat, Cosmidis and Faivre44 Notably, while the EDS provides the resolution necessary for the identification of chemical makeup of the formed biominerals, it does not distinguish the oxidation states of their individual constituents, prompting the use of additional analytical techniques. As a result, probing the chemical environment of iron was therefore carried out in their case, which was identified by XAS. Reference Baumgartner, Morin, Menguy, Perez Gonzalez, Widdrat, Cosmidis and Faivre44 However this technique provides a bulk signal, and as such is not applicable to analysis of individual particles. According to the x-ray absorption near-edge spectroscopy (XANES) and extended x-ray absorption fine structure, the three components reported by the coauthors along the induction series were phosphate-rich ferric hydroxide-like and oxyhydroxide-like phases detected 10 and 30 min after induction, respectively, in addition to the growing magnetite phase. This finding was confirmed by the independent study from Fdez-Gubieda and coworkers, who also used XANES to probe the biomineralizaion pathway for M. gryphiswaldense, and reported on this proceeding via the formation of ferrihydrite with high phosphorus content, followed by its conversion to magnetite. Reference Fdez-Gubieda, Muela, Alonso, Garcia-Prieto, Olivi, Fernandez-Pacheco and Barandiaran52 The fast magnetosome magnetite biomineralization, reported by Staniland and coworkers, Reference Staniland, Ward, Harrison, van der Laan and Telling43 is in contrast to the previously proposed slow multistep formation mechanism. Reference Frankel, Papaefthymiou, Blakemore and O'Brien18,Reference Arakaki, Webb and Matsunaga37,Reference Schüler and Baeuerlein53–Reference Pearce, Henderson, Pattrick, van der Laan and Vaughan62
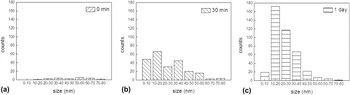
In our study, the particles with sizes <10 nm appeared to be amorphous (n = 4), and with sizes >15 nm appeared to be crystalline. Based on the analysis of the crystalline biomineral phases formed for magnetosomes of varying sizes, particles of 10 nm < size < 15 nm exhibited mixed amorphous (n = 3) and crystalline (n = 2) structures. When dealing with small particles in large bacterial cells, detailed characterization of small nanoparticles is challenging, as in addition to the diminished contrast, there is an increased likelihood of triggering the beam-induced amorphous-to-crystalline transition associated with the accumulation of high electron dose over a very short period of time, as well as the change in electronic configuration of iron. To minimize the ambiguity, we (i) reported here only the results obtained on the magnetosomes residing inside the body of the bacterial cell and (ii) omitted the measurements acquired on the smallest magnetosome particles. Doing so resulted in a relatively small number of samples. The reported results, however, are consistent and representative of most small magnetosomes. Notably, the crystalline magnetosome particles in this transition range could not be indexed directly to just one mineral: based on the interplanar spacings measured in the particles, these particles may consist of ferrihydrite, Reference Stevens, Khasanov, Mabe, Mercader, Gancedo, Cabral Prieto and Baggio-Saitovitch63 magnetite, Reference Swanson, McMurdie, Morris and Evans64 maghemite Reference López-Walle, Reyes-Melo and Rakotondrabe65 and/or hematite. Reference Morris, McMurdie, Evans, Paretzkin, Parker and Panagiotopoulos66 The planes were first indexed to magnetite, and the remaining unmatched peaks were attributed to the mixed mineral phase. Interplanar spacings of 1.51 and 3.41 Å are attributed to 2-line ferrihydrite and maghemite, and those of 1.84, 2.70, and 3.68 Å are attributed to hematite, respectively. The lattice parameter for these magnetosomes was calculated as 8.38 ± 0.08 Å, which is approximately 0.2% off of the lattice parameter of AMB-1 magnetosome magnetite nanocrystals (8.3958 Å) reported by Fischer et al. Reference Fischer, Schmitz, Aichmayer, Fratzl and Faivre67 The lattice parameter for the particles in the transition range is 8.38 ± 0.07 Å. Details of the SAED patterns of the two particles in this transition size range are given in Table SI. SAED analysis of the magnetosomes revealed, in addition to the magnetite, the presence of maghemite, 2-line ferrihydrite, and the occasional hematite in the particles with sizes above 10 nm. Based on the Gibbs Free Energy calculations, we have attributed this result to the oxidation of magnetosome magnetite to maghemite, which could undergo the conversion to hematite under the electron beam. Reference Lagoeiro68 The presence of trace amounts of ferrihydrite in magnetosomes with sizes above 10 nm may also be feasible according to the SAED, as further discussed in the Fe L3 EELS analysis. Size distribution of magnetosome particles was examined using the cultures sampled at the point of induction, 30 min, and 1 day after the biomineralization induction via the HAADF-STEM imaging. Figure 3 reveals that the sub-10 nm particles were mostly present in the culture collected 30 min after the injection of iron-replete growth medium, which is indicative of this particular time frame including the biomineralization onset. Reference Staniland, Ward, Harrison, van der Laan and Telling43 As the formation of the magnetosomes is a continuous process, the presence of these small particles is expected at all time frames. Even though the samples collected at all three time frames showed magnetosomes with sizes from 0 to 80 nm, the higher sub-10 nm particle content was consistent with the magnetosome formation in the sample collected 30 min after the injection. Moreover, we surveyed size-dependent crystallinity of the magnetosome particles formed during the first 30 min of the induced biomineralization. These results are in good agreement with the reported formation of the nascent 8 ± 4 nm biominerals within the first 10 min after induction, which were identified as a mixture of poorly crystalline iron oxyhydroxide and ferrihydrite, magnetite, and hematite, while magnetite was the major mineral phase 30 min after the induction. Reference Baumgartner, Morin, Menguy, Perez Gonzalez, Widdrat, Cosmidis and Faivre44 However, direct conversion of hematite to magnetite is thermodynamically unfavorable, and under mild conditions oxidation of magnetite proceeds via the formation of maghemite. Reference Lagoeiro68 Here, the detected hematite is likely to form as a result of beam-induced conversion of preoxidized magnetite nanocrystals.
Size distribution of magnetosome particles for 0 and 30 min and 1 day after the introduction of iron-replete growth medium shows the highest population of sub-10 nm particles present in the sample collected after 30 min of growth medium. The largest number of magnetosome per bacterium is seen in the sample collected after one day, [n (bacteria for each time frame): 30].

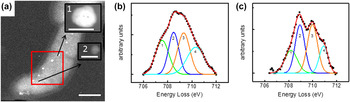
The chemical environment of iron in magnetosomes was probed via Fe L3 EELS. To determine the nature of minerals formed in this alleged transition range and in the sub-10 nm range, EELS was carried out on both Fe L3 and O K-edges and compared with that obtained from the magnetosomes with sizes larger than 15 nm. The reference HAADF-STEM image of selected magnetosomes and analysis of Fe L3 peaks are shown in Fig. 4. The EEL spectra from large magnetosome in Fig. 4(a) (52 nm) marked with green square, and small magnetosome (10 nm) marked with blue circle, are shown in Figs. 4(b) and 4(c), respectively. To mitigate the low signal-to-noise ratio associated with small particles embedded in the bacterial matrix, we used 3-channel intensity smoothing. After that, the acquired Fe L3-edge spectra were fitted with four different reference peaks corresponding to different oxidation states and coordination numbers of iron. For the large magnetosome, the fitting peaks have positions (and %area under the fitting peaks) at 707.5 eV (24%), 708.5 eV (23%), and 709.3 eV (27%) [Fig. 4(b)], which correspond to octahedral Fe2+, tetrahedral Fe3+, and octahedral Fe3+, and an additional peak at 710.3 eV (25%), which was attributed to FeO(OH). Reference Ochoa, Bello, Sancristóbal, Balsamo, Albornoz and Brito49 Similarly, the experimental spectrum of the sub-10 nm magnetosome was fitted with peaks at 708.2 eV (19%), 708.9 eV (31%), 710.0 eV (33%), and 710.9 eV (16%) corresponding to the same environment as above [Fig. 4(c)]. The shift of approximately 0.7 eV between these two experimental spectra [Figs. 4(b) and 4(c)] was attributed to the instrument drift during the consecutive EELS acquisition. The interpeak positions between first three peaks were around 0.9 eV for both cases. The ratio of peak 1 to peaks (2 + 3), corresponds to the relative concentrations of Fe2+ to Fe3+, which are 1:2.1 (matching the ratio expected for Fe3O4) and 1:3.3 (1:2.9 for n = 2, Fig. S1, Table SII) for these large and small magnetosome particles, respectively. For the particles in the transition region, this ratio is 1:3.4 (n = 2, Fig. S1, Table SII). This indicates that the chemical environment of the iron in amorphous particles is dissimilar to that of iron in magnetite, and tends toward a more ferric-rich situation instead. The relative ratio of the areas under the tetrahedral Fe3+ and octahedral Fe3+ peaks in the amorphous to crystalline transition range and sub-10 nm range varies, which can be attributed to continuous conversion of Fe3+ to Fe2+ during the biomineralization. The Fe2+ and Fe3+ concentrations in Magnetovibrio blakemorei strain MV-1 was described by Kalirai et al. in terms of formed premagnetosomes, magnetosomes, and gaps along the magnetosome chains, and while observed in a different microorganism, this could be indicative of the relevant magnetosome biomineralization pathway. Reference Kalirai, Bazylinski and Hitchcock69 The presence of FeO(OH) peak in this fitting was attributed to the presence of ferric oxyhydroxide, specifically ferrihydrite, which was observed previously both in case of small Reference Baumgartner, Morin, Menguy, Perez Gonzalez, Widdrat, Cosmidis and Faivre44 and large magnetosome nanocrystals. Reference Frankel, Papaefthymiou, Blakemore and O'Brien18 Trace amount of ferrihydrite detected in some of the large particles was attributed to the incomplete conversion of nascent ferrihydrite precursor to magnetite, in addition to the newly formed magnetite. Fe L3 edge EEL spectrum outside the magnetosome region in the bacterium did not reveal any iron signal in the bacterium, which eliminates the possible presence of iron outside the magnetosome (Fig. S2).
(a) HAADF-STEM image of a bacterial cell obtained from the sample 30 min after induction. Magnified images of the magnetosomes in the red rectangle are shown in the insets. Fe L3 core EEL spectra of the particles shown in the inset 1 with size: 52 nm and in the inset 2 with size: 10 nm are given in (b) and (c), respectively. The ratio of the areas of peak 1 to peaks (2 + 3), corresponding to Fe2+ (octahedral) to Fe3+ (tetrahedral + octahedral) ratio, is around 1:2.1 for large particle and 1:3.3 for small particle. Peak 4 is attributed to the FeO(OH). [Scale bars: (a): 500 nm, inset 1 and 2: 20 nm.]

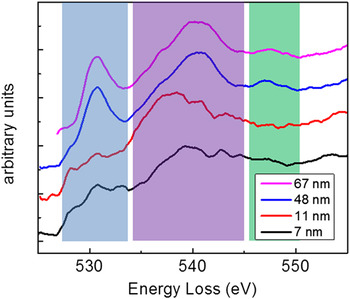
Qualitative comparison of the acquired O K-edge EEL spectra of magnetosomes with sizes of 7, 11, 48, and 67 nm in Fig. 5 focused on the evolution of distinct spectral features as a function of the magnetosome size. This analysis involved 10-channel intensity smoothing to mitigate the high noise level of smaller particles. The peaks at 531 eV (blue area) and 540 eV (purple area) correspond to the transition of electrons of O 1s to unoccupied hybridization peaks of O 2p with Fe 3d and Fe 4s/4p, respectively. Reference Bischoff and Motta50 It was suggested by Colliex et al. that the peak around 548 eV (green area) can serve as fingerprint for iron oxides. Reference Colliex, Manoubi and Ortiz45 The presence of this peak indicates that the structure resembles either γ-Fe2O3 or Fe3O4, while its deficiency indicates that the structure is either α-Fe2O3 or FeO. As the size of the magnetosome increases, the initially broad and noisy peaks at 531, 540, and 548 eV appear clearly defined and become better resolved. Moreover, the peak at 540 eV becomes narrower, and the peaks at 531 and 548 eV are more pronounced in larger particles. The presence of characteristic 548 eV peak, along with the peak around 531 eV in larger particles, is in an agreement with the presence of fully developed magnetite structure, while the lack of these two peaks for smaller particles is consistent with the absence of magnetite. Considering the observed ratios of spectral peaks attributed to Fe(II) and Fe(III) discussed above, the smallest magnetosome particles cannot be magnetite, but as explained above, it is also known that ferric oxyhydroxides, specifically ferrihydrite, can be present during the early stages of biomineralization. Reference Baumgartner, Morin, Menguy, Perez Gonzalez, Widdrat, Cosmidis and Faivre44 The O K-edge EEL spectrum of the smallest particle in this work resembles to that of 2-line ferrihydrite, FeOOH·0.4H2O. Reference Gloter, Zbinden, Guyot, Gaill and Colliex48
O K-edge core EEL spectra of magnetosomes of sizes 7, 11, 48, and 67 nm. The peaks at 531 eV (blue area), 540 eV (purple area), and 548 eV (green area) are the fingerprints for the determination of the type of iron oxide. The spectra become noisier as particle size decreases. The peaks at 531 and 548 eV are more pronounced in large particles. The width of the 540 eV peak decreases as the particle grows.

The structures up to 10 nm are viewed as disordered ferric hydroxide with the Fe3+/Fe2+ ratio higher than 2.0 and the presence of the peak in Fe L3 EEL spectra is assigned to FeO(OH). The particles in the 10–15 nm range are partially crystalline and the planes in their SAED analyzed cannot be directly indexed to one specific mineral because they are single crystals distributed in the bacteria with different zone axes parallel to the electron beam, which inhibits visualization of some characteristic planes of these minerals in SAED. Thus, the planes of these minerals are indexed to a combination of 2-line ferrihydrite, magnetite, maghemite, and hematite suggesting the transformation of amorphous ferric hydroxide to crystalline 2-line ferrihydrite and magnetite in this range. In this region, too, the Fe3+/Fe2+ ratio remained higher than 2.0, and the presence of all these four minerals was detected via SAED. Above 15 nm, through SAED analyses, the structures were again indexed to 2-line ferrihydrite, magnetite, and maghemite, but the Fe3+/Fe2+ ratio of 2.0 indicates that the structure is mostly magnetite with trace amounts of both 2-line ferrihydrite and maghemite. Furthermore, the O K-edge EEL spectrum of the large particle verifies the magnetite mineral in magnetosomes, while the lack of the high intensity 531 and 548 eV indicates that the structure resembles that of 2-line ferrihydrite for sub-15 nm particles.
Based on the detailed analysis, we outline the following pathway to the induced magnetite magnetosome biomineralization in AMB-1. Upon the exposure of the bacterial culture grown under the low-iron conditions to the iron-replete growth medium, the magnetosome biomineralization proceeds via the formation of small and amorphous ferric oxyhydroxide nanoparticles. These particles grow and transform to more ordered 2-line ferrihydrite and to magnetite, possibly via the intermediate maghemite. While we are unable to follow the evolution of the crystalline structure in a specific particle, we note that the increase in particle size of the biomineral phase with time is strongly correlated with its ordering, and that the underlying phase transformation, from amorphous (ferric hydroxide) to poorly crystalline (ferrihydrite) to ordered, crystalline (maghemite, magnetite), is, most likely, linked to the particle growth. The observed change in the Fe2+:Fe3+ concentration ratio, from 1:3 in the initial disordered phase to 1:2 in the intermediate ferrihydrite phase, points to the commencing production of ferrous iron during the growth process, and is in excellent agreement with the earlier reports on reproduction of Fe2+ and reduction of Fe3+, responsible for the formation of magnetite via ferrihydrite. Reference Frankel, Papaefthymiou, Blakemore and O'Brien18
III. CONCLUSIONS
We describe evolving mineralogy and crystallinity of iron oxide phases within a bacterial magnetosome of M. magneticum strain AMB-1. To accomplish this, time resolved induction experiments were carried out together with HAADF-STEM, SAED, and spatially resolved EELS. The narrow “amorphous to crystalline transition range” corresponding to the onset of crystal lattice formation was identified via HAADF-STEM and SAED. To monitor the evolution of chemical bonding in magnetosomes and correlate these findings with the emergence of crystalline lattice, we carried out the peak fitting on EEL spectra. Specifically, we interpreted the Fe L3 and O K-edge peaks in terms of the interplay between octahedral and tetrahedral iron with different oxidation states in growing magnetosome particles. We conclude that the freshly formed magnetosomes are amorphous ferric hydroxide. In the transition range, first, they convert to crystalline 2-line ferrihydrite, followed by conversion to magnetite, with the residual amounts of 2-line ferrihydrite in fully mature magnetosome particles. Our results are important for understanding the complex mechanism of bacterial magnetosome formation and growth. Our findings will help to optimize the bioinspired synthesis of magnetite in vitro.
IV. MATERIALS AND METHODS
A. Sample preparation
Cells of M. magneticum AMB-1 (ATCC 700264) used for the biomineralization induction experiments were grown at room temperature under microaerobic conditions in a 5 mL flasks containing the modified flask standard medium (FSM) lacking the major source of iron (ferric citrate) and only containing a small amount of iron (0.36 μM) present in the mineral solution. Reference Heyen and Schüler34,Reference Faivre, Menguy, Posfai and Schüler70 The nonmagnetic bacterial cultures were then then subcultured, and FSM medium containing ferric citrate (50 μM, iron-replete growth medium) was added to the cells grown under low iron condition. Time resolved sample collection experiments were conducted by sampling at 0 and 30 min, and 1 day after the injection of the iron-replete growth medium.
B. STEM-HAADF imaging
A droplet of bacterial culture was placed on QuantiFoil™ Cu grid (QuantiFoil Micro Tools GmbH, Großlöbichau, Germany) with hole size 2 µm and ultrathin carbon film on holey carbon support film Cu grid for STEM evaluation. Imaging and characterization of the specimens were carried out with an FEI Tecnai G2 F20 (S)TEM (FEI Company, Hillsboro, Oregon) operating at an accelerating voltage of 200 kV equipped with a Tridiem Gatan Imaging Filter (Gatan Inc., Pleasanton, California), HAADF, and EDS detectors. EELS was used to probe the localized chemical composition of the specimens. 200 kV incident voltage with an electron dose of 3–25 e/A2 was used for STEM imaging. Image analysis was performed by using Digital Micrograph 3.10.1 and ES Vision 5.0.
C. SAED
220 mm camera length was used for SAED. The SAED images were recorded with 0.1 s exposure. 52 large magnetosomes (size > 10 nm), 12 small magnetosomes (size < 10 nm), and 7 magnetosomes in the amorphous to crystalline transition size range (10 nm < size < 15 nm) were analyzed.
D. EELS
2 mm EELS aperture with a camera length (CL) 163 mm and 0.1 eV/channel energy resolution was used. 3 and 10 s beam exposures were applied for Fe L3 edge and O K edge, respectively. Since magnetosomes are embedded in bacteria of around 300 nm thicknesses, the collected signal is noisy and counts are low, thus an electron dose of around 105 to 108 e/nm2 was used for STEM-EELS.
E. EELS data processing
Background is removed from the experimental spectrum by the subtraction though the inverse exponential fitted curves with widths of 30 and 20 eV in Digital Micrograph for Fe L3 edge and O K edge, respectively. After that, these data were processed in OriginPro 9.0 for smoothing (3 channels for Fe L3-edge and 10 channels for O K-edge) and peak fitting. Four different peaks were fitted for Fe L3-edge and their relative positions and their respective areas are evaluated for the chemical environment for iron.
Supplementary Material
To view supplementary material for this article, please visit http://dx.doi.org/10.1557/jmr.2016.33.
ACKNOWLEDGMENTS
This work was supported by the U.S. Department of Energy (DOE), Office of Science, Basic Energy Sciences, Division of Materials Sciences and Engineering. T.P. acknowledges support from the Department of Energy Office of Science Early Career Research Award, Biomolecular Materials Program. The research was performed at the Ames Laboratory, which is operated for the U.S. Department of Energy by Iowa State University under Contract No. DE-AC02-07CH11358. D.F. acknowledges financial support from the Max Planck Society and the European Research Council (Starting Grant MB2 No. 256915).