


Political Scientists encounter issues with “space” in cross-sectional and panel research designs (Stimson Reference Stimson1985). In particular, the cross-sectional units scholars study are often defined by geographic space, which is a feature political research can incorporate more directly into analysis. A natural example of this is that the 50 American states are interdependent actors: Neighboring states are likely to share similar attributes, and the activities of one state can influence the behavior of another. When studying the politics and policies of states, researchers should take this interdependence into account. Specifically, empirical models should make assumptions that are reasonable given the interrelationships among the states. To that end, this article demonstrates the usefulness of hierarchical Bayesian modeling to account for spatially correlated errors in the study of state politics. Beyond the American states, the theory and methods discussed here would apply to the study of any population of interdependent geographic actors, such as the members of the European Union, the nations of Latin America, or the counties within a country.
While substantial research on American state politics and policy has illustrated the importance of geography (e.g., Berry and Berry Reference Berry and Berry2007; Monogan Reference Monogan2013), there are also many articles on state politics do not explicitly consider geographic dependence in the outcome variable. Many studies that do consider geographic dependence consider the notion of policy diffusion in which states may adopt successful policies developed by their neighbors (Gray Reference Gray1973). However, even if diffusion is not part of the story, it is still worth entertaining the possibility that there are lurking variables that shape the outcome and are geographically dependent. For example, suppose that political discourse critically shapes state legislatures’ behavior when acting on policy. Perhaps in states where elites deliberate in a less polarizing fashion, it is easier for leaders to enact compromise bills. This concept may not be measured easily, as it can be difficult to quantify the tone of rhetoric. Further, it may be the case that neighboring states are more likely to have a similar outlook on how politics should function, which shapes how elites publicly discuss issues. If this is the case, then the nature of discourse is geographically dependent, relevant for the outcome, and unmeasured.
This is just one example of how some variables could be unmeasurable or unavailable to the researcher and still influence the outcome. The effect of any such variable is relegated to the disturbance term. If the unobserved variable is also geographically dependent, as the political discourse example suggested, then the disturbance terms will necessarily be geographically dependent. This situation immediately implies that estimating a linear model with ordinary least squares (OLS) is inappropriate because the Gauss–Markov assumption of independent disturbance terms is violated. Further, the most typical approaches to identifying maximum likelihood estimators (MLE) usually assume that each observation is independent of the others, meaning that ignoring spatial correlation is problematic to these models as well. While there are potential fixes for spatial correlation in both least squares and likelihood estimators, which will be discussed, ignoring the problem altogether can produce inefficiency.
This article describes how spatial conditional autoregressive (CAR) models can be specified within a Bayesian hierarchical model when errors are geographically correlated. First, we place this method in the context of the range of spatial regression models. Second, we explain how this specific model works. Third, we present Monte Carlo analyses that illustrate CAR models’ efficiency gains. Fourth, we offer examples of applying CAR models to state-level outcomes: a cross-sectional replication of Erikson, Wright and McIver’s (Reference Erikson, Wright and McIver1993) Statehouse Democracy model, and a multilevel panel model replication of Margalit’s (Reference Margalit2013) study of the effect that recent personal economic shocks have on individuals’ support for welfare policies.Footnote 1 We conclude by discussing how practical researchers can use CAR models.
Approaches to spatial data analysis
When studying geographical data such as the American states, a researcher faces two important modeling decisions. First, he or she must decide if the model’s functional form should allow for geographic diffusion. Will one state’s value of the outcome variable spill to neighboring states, affecting their outcome values? If not, then the researcher is assuming that spatial correlation is confined to the errors, and a second question emerges: Should the researcher directly model the outcome variable as spatially correlated in the errors, or allow an indirect spatial structure in a random effect term of a Bayesian hierarchical model (Banerjee, Carlin and Gelfand Reference Banerjee, Carlin and Gelfand2004, 129)? Figure 1 illustrates these choices and the resulting model at the end of each possible decision path. We consider each choice in turn.
Decisions facing the analyst of geographic data. MLE = maximum likelihood estimator; CAR = conditional autoregressive; SAR = simultaneous autoregressive

Is the functional form diffusive or confined?
A large body of literature on policy diffusion in the 50 states has focused precisely on neighboring states’ similarities in policy outcomes. The notion of policy diffusion proposes that when one state creates an innovative new law, other states will follow suit and adopt the policy themselves if the law proves effective or legislators in nearby locales like the idea. This spreading, or diffusion, of an effective or novel idea across the states may happen in a primarily temporal way wherein a burst of action occurs with other states following the policy leader (Gray Reference Gray1973). Alternatively, the spread may show much more of a geographic pattern in which neighbors of an innovating state are more likely to adopt the policy due to similar concerns they are facing or similar constituency interests (Berry and Berry Reference Berry and Berry2007).
Policy diffusion illustrates the logic of a diffusive functional form. When an investigator believes that one observation’s outcome will affect its neighbors’ outcomes, he or she theoretically would conclude that spatial similarities are the result of direct spillover. This geographically diffusive model methodologically resembles the time-series analyst’s decision to include a lagged dependent variable to estimate a dynamic model that allows carryover from one time period into the next. For instance, a researcher may have strong reason to believe a neighbor’s policy will directly lead a state to want to adopt a similar policy. In these cases where there is a clear contagion story, spatial lag models are appropriate, as Figure 1 illustrates at the endpoint for choosing a diffusive function. This model changes the functional form, with the effects of other predictors accumulating in a feedback loop. In addition, the spatial lag model has been expanded to include temporal lags in a panel setting (Franzese and Hays Reference Franzese and Hays2007), and Bayesian methods can apply to models with a spatially lagged dependent variable (LeSage Reference LeSage1997). So when there is a direct impact of one state’s outcome on its neighbors’ outcomes, the spatial lag model is the best model choice.
An important feature of a spatial lag model is that it should not be estimated using OLS. State policy diffusion studies frequently include an average of neighboring states’ behavior as a predictor (for continuous outcomes), or either the number of neighbors adopting a policy or a dummy for whether any neighbor has adopted the policy (for binary outcomes). Estimating a model with OLS that includes averaged neighbor behavior is problematic because it induces simultaneity bias. In other words, each observation of the response variable takes a turn being included in the neighbor average that is used as a predictor, so the neighbor average correlates with the disturbance term (Ward and Gleditsch Reference Ward and Gleditsch2008, 40–1). This problem can be addressed by estimating the model with either instrumental variables regression or a maximum likelihood model that relies on multivariate normal theory (Ward and Gleditsch Reference Ward and Gleditsch2008, 41–3). Because the MLE version relies on multivariate normal theory, outcome variables that have another distribution (such as Bernoulli, Poisson, or exponential) impose an added difficulty. That said, if the diffusive functional form is right, adhering to the correct functional specification should be of utmost importance—lest the results suffer immediate bias. Lambert, Brown and Florax (Reference Lambert, Brown and Florax2010) illustrate incorporating a spatial lag into a count model and McMillen (Reference McMillen1992) shows this with a probit model.
Structuring the error in confined functional forms
When the analyst believes there will be no spillover in the model, he or she has the option of estimating a model with a confined functional form. In these cases, one state’s predictors affect that state’s own value of the outcome, and each neighbor’s predictors affect that particular neighbor’s own outcome. However, no variable from one state has a spillover effect on a neighboring state. In these cases, the researcher chooses the “confined” branch in the tree from Figure 1 and theoretically concludes that spatial similarity among states, once the predictors are accounted for, is the result strictly of correlation in the error term. Such correlation could emerge from lurking variables that are geographically distributed but are unmeasured, such as political culture or narrow details about the local economy.
At the “confined” branch in Figure 1, the researcher has two choices for how to account for spatially correlated errors. One strategy is to directly model the data in a spatial framework. At the end of the “direct” node in Figure 1, we see that a researcher can use MLE to fit a spatial error model with either a CAR or a simultaneous autoregressive (SAR—not to be confused with a spatial lag model) structure (Leroux Reference Leroux2000). These direct spatial error models are one means of addressing spatial correlation in errors. Fitting this kind of model resembles the time-series analyst’s decision to estimate a model with feasible generalized least squares to account for serial correlation in the error term. In either the time series or geospatial case, the researcher believes that the predictors have a confined effect with no spillover. By accounting for the structure of error correlation, spatial error models are more efficient than models that ignore error correlation and report fairer measures of uncertainty in estimates that might be underestimated with other methods. Yet, these spatial error models have limitations as well. The SAR structure works for a linear model by transforming the function in a way that yields independent errors without additional spatial correlation. Hence, SAR models are not used in a GLM setting to model limited dependent variables (Banerjee, Carlin and Gelfand Reference Banerjee, Carlin and Gelfand2004, 85). By contrast, the CAR structure can be tooled to model certain limited dependent variables directly. However, the CAR model faces a major impropriety limit: When data are modeled with a direct CAR, the conditional variance–covariance matrix does not exist. Consequentially, the only way to model an outcome directly with a CAR model is to specify a proper CAR that uses a ridge-style solution to model observations not as a function of their neighbors’ average, but as a proportion of that average (Banerjee, Carlin and Gelfand Reference Banerjee, Carlin and Gelfand2004, 80–1). Proper CARs often underestimate spatial correlation, and Wall (Reference Wall2004) illustrates that the correlation structures implied by direct CAR and SAR models are often counterintuitive and impractical.
Hierarchical spatial modeling
We argue that whenever someone wants to estimate a confined model with spatial data, the more effective alternative is to choose the “hierarchical” branch shown in Figure 1, which is to introduce a CAR structure in the second stage of a hierarchical Bayesian model, allowing random effects to correlate spatially. This hierarchical approach is common in Epidemiology, so this model has found much of its use in questions on public health. So far, this method has found little usage in Political Science, though Darmofal (Reference Darmofal2009) and Monogan (Reference Monogan2013) are exceptions. Given the rise of contextual and geospatial data in Political Science, there are considerable applications of hierarchical CAR models in the field.
As mentioned above, ignoring spatially correlated errors leads to inefficient estimates. A hierarchical CAR model can be the most useful means of handling geographic autocorrelation that is truly part of the error term because it solves several problems that pose difficulties for the various direct approaches. The first is the issue of impropriety: The direct CAR model requires the estimation of a nuisance parameter essential for the estimation of the variance–covariance matrix, and this parameter often biases the results. By contrast, when a CAR structure is introduced in the random effects as a prior in a Bayesian model, the impropriety can be ignored because a Gibbs sampler estimator only requires the full conditionals of all error terms, which are defined. Even without correcting for impropriety, the posterior distribution typically (albeit not always) will converge to a proper result.
Second, hierarchical modeling more easily can handle spatial correlation for limited dependent variables. Generalized linear mixed models (GLMMs) are simple to specify in a Bayesian setting and allow the introduction of random effects within the inverse link function. Hence, when a CAR spatial structure of the observations is introduced in a random effect, models of limited dependent variables can easily allow for spatial correlation in the errors, as the examples in this article illustrate.
Finally, hierarchical CAR models estimate several interesting quantities that the applied researcher can report. Bayesian hierarchical models allow researchers to disaggregate unexplained variance with simplicity. When a spatial CAR structure is imposed on a hierarchical random effect, the unexplained variance can be split into that which is spatially dependent and that which is truly stochastic. Researchers thereby can report the degree to which an outcome relates to geographic considerations. Further, for forecasting, spatially referenced random effects are automatically predicted as part of the estimation process.
It should be reiterated that the scholar who believes in a direct relationship between neighbors’ response values should use a spatial lag model of some sort (McMillen Reference McMillen1992; LeSage Reference LeSage1997; Ward and Gleditsch Reference Ward and Gleditsch2008; Lambert, Brown and Florax Reference Lambert, Brown and Florax2010). But if diffusion is not part of the story, then a hierarchical CAR model will be efficient and will report uncertainty fairly. Overall, a hierarchical CAR model is a useful solution for handling geographic correlation because it handles impropriety issues, works with limited dependent variables, and reports worthwhile quantities of interest.
Conditionally autoregressive models
This section turns to the formal structure behind the CAR model. We describe the direct model first, and then its usage in a hierarchical setting. CAR models provide a geographic structure for the outcome variable, assuming that areal data are under investigation. Areal data (or lattice data) are data which are defined by borders.Footnote 2 In other words, this model is applicable when the observations are nations, counties, congressional districts, or anything defined by a border. With data such as these, the analyst can easily classify whether two observations are geographic neighbors, neighbors of neighbors, or how far they are removed.
More formally, in a Gaussian CAR model, we assume that each observation of the outcome, Y i, has the following conditional distribution (Besag, York and Mollié Reference Besag, York and Mollié1991):
 $$Y_{i} \,\mid\,y_{{{\minus}i}} \,\sim\,{\cal N}\left( {\mathop{\sum}\limits_{j\,\ne\,i} b_{{ij}} y_{j} ,\tau _{i}^{2} } \right),i{\equals}1,\,\ldots\,n$$
Here, b ij is the weight of observation j on the mean of Y i.  $$\tau _{i}^{2} $$ is a unique variance for Y i. The simple assumption behind Equation 1 gives us the full conditional distributions, but we need the joint distribution of all observations to estimate the model in a direct setting. We can rely on Brook’s Lemma (Reference Brook1964) to derive a unique joint distribution from the full conditionals. For y 0 = (y 10,…,y n0)′, Brook’s Lemma informs us:
 $$\eqalignno{ p(y_{1} ,\,\ldots\,,y_{n} ){\equals} & {{p(y_{1} \,\mid\,y_{2} ,\,\ldots\,,y_{n} )} \over {p(y_{{10}} \,\mid\,y_{2} ,\,\ldots\,,y_{n} )}} \cdot {{p(y_{2} \,\mid\,y_{{10}} ,y_{3} ,\,\ldots\,,y_{n} )} \over {p(y_{{20}} \,\mid\,y_{{10}} ,y_{3} ,\,\ldots\,,y_{n} )}} \cr & \cdots {{p(y_{n} \,\mid\,y_{{10}} , \cdots ,y_{{n{\minus}1,0}} )} \over {p(y_{{n0}} \,\mid\,y_{{10}} , \cdots ,y_{{n{\minus}1,0}} )}} \cdot p(y_{{10}} ,\,\ldots\,,y_{{n0}} ) $$
By applying Brook’s Lemma with Gaussian conditionals, we can show that:
 $$p(y_{1} ,\,\ldots\,,y_{n} )\propto\exp \left\{ {{\minus}{1 \over 2}{\bf y}'{\bf D}^{{{\minus}1}} ({\bf I}{\minus}{\bf B}){\bf y}} \right\}$$
The matrices are defined with Equation 1’s scalars: Bij = b ij and  $${\bf D}_{{ii}} {\equals}\tau _{i}^{2} $$. Y thus has a joint multivariate normal distribution with mean 0 and covariance matrix Σy = (I−B)−1D.
Having derived a joint distribution for all observations given the conditional neighbor relationship, we consider two distributional properties before we proceed to estimate a model. The first property is symmetry. Covariance is a symmetric measure of association, so we need  $$b_{{ij}} \tau _{j}^{2} {\equals}b_{{ji}} \tau _{i}^{2} $$ in order for the covariance between two observations to have a single value. We can meet this requirement if we define the terms as b ij = w ij/w i+ and
 $$\tau _{i}^{2} {\equals}\tau ^{2} \,/\,w_{{i{\plus}}} $$. Here, w ij is a measure of the association between two observations. Often w ij = 1 if the observations are neighbors and 0 otherwise, meaning that each observation’s mean is the average of its neighbors’ values, but this is not the only possible rule.Footnote 3w i+ is the sum of all w ij for observation i (equaling the number of neighbors for observation i under the binary shared border rule). This implies that our joint distribution can be expressed as:
 $$p(y_{1} ,\,\ldots\,,y_{n} )\propto\exp \left\{ {{\minus}{1 \over {2\tau ^{2} }}{\bf y}'({\bf D}_{w} {\minus}{\bf W}){\bf y}} \right\}$$
where Dw is diagonal, (Dw)ii = w i+, and Wij = w ij. We use the notation Y̴CAR(1/τ 2) to refer to this joint distribution for all of the observations of Y with precision 1/τ 2.
The second property we consider is propriety, or whether this joint distribution is a proper probability distribution. For this distribution to be proper, we would need the inverse of the covariance matrix, 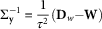 $$\Sigma _{{\bf y}}^{{{\minus}1}} {\equals}{1 \over {\tau ^{2} }}({\bf D}_{w} {\minus}{\bf W})$$, to be nonsingular. Unfortunately, (Dw−W)1 = 0. This means that
 $$\Sigma _{{\bf y}}^{{{\minus}1}} $$ is singular, and the distribution is improper because the variance–covariance matrix, Σy, is undefined. When using a direct CAR model, the only solution here is to insert a nuisance propriety parameter into the inverse of the variance–covariance matrix to make it
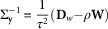 $$\Sigma _{{\bf y}}^{{{\minus}1}} {\equals}{1 \over {\tau ^{2} }}({\bf D}_{w} {\minus}\rho {\bf W})$$. Since this formulation often underestimates the true correlation among observations and can yield biased results, this solution is unattractive. Instead, we handle this lack of propriety through a hierarchical Bayesian model.Footnote 4
Specifying a hierarchical Bayesian CAR model
In a Bayesian hierarchical setting, we can specify a model in which there are two random effects terms influencing the outcome variable. One of the random effects is a traditional independent and identically distributed disturbance term, and the other is a spatial-clustering random effect that captures the effect of neighbor similarities. For the spatial-clustering random effect, we can specify the full conditionals of a CAR model as a prior distribution. Provided the model converges to its posterior distribution, an improper prior is acceptable in Bayesian inference. By analogy, whenever analysts place a flat prior on a parameter, they are specifying an improper prior distribution that does not integrate to 1, yet this often does not pose difficulties for Markov chain Monte Carlo (MCMC) convergence. Thus, a CAR structure can be applied with the following basic model form:
 $$\eqalignno{ & {Y}_{i} {\equals}{\bf x'_{i} \bibeta} {\plus}\theta _{i} {\plus}\phi _{i} \cr & \theta _{i} \,\sim\,{\cal N}(0,\sigma ^{2} ) \cr & {\biphi} \,\sim\,{\rm CAR}(1\,/\,\tau _{c}^{2} ) $$
Equation 5 specifies a simple hierarchical linear model. In this equation, xi is a vector of covariates for observation i, β is a vector of coefficients, θ i is an independent and identically distributed Gaussian random effect, and φ i is a spatially referenced random effect that is based on neighbors’ values of the disturbance. The priors on the independent θ i values allow us to capture heterogeneous unexplained variance (σ 2) among the observations. Meanwhile, the prior on the vector φ of CAR random effects helps us capture regional clustering, or variance that is local with similar disturbances ( $$\tau _{c}^{2} $$).
To complete this model, the researcher needs to specify priors on all coefficient terms and hyperpriors on the two variance terms ( $$\tau _{c}^{2} $$ and σ 2). The basic form listed in Equation 5 offers a general means to handle geographic dependence with areal data, such as the American states. The examples of Clean Air Act enforcement and lottery adoption in the Online Appendix also illustrate how this kind of model can be adapted in a GLMM framework to allow for spatial correlation with limited dependent variables.
One final complication with this sort of model comes with setting the hyperpriors on the terms representing the heterogeneous variance (σ 2) and clustering variance ( $$\tau _{c}^{2} $$). The variances cannot be overly vague or the separate random effects will be unidentifiable, and the hyperpriors on the variances consequently cannot be overly imprecise. In addition, the terms react differently to their respective variance terms because the heterogeneous θ terms are independent of each other, while the clustered φ terms are not. Hence, setting hyperpriors such that the share of heterogeneous versus clustered variance is approximately even is not straightforward. Bernardinelli, Clayton and Montomoli (Reference Bernardinelli, Clayton and Montomoli1995) and Best et al. (Reference Best, Waller, Thomas, Conlon and Arnold1999) each offer recommendations on how to set these hyperpriors.
Once the model is fully specified, estimation is fairly straightforward using MCMC methods. A Gibbs sampler, for instance, needs only the full conditionals of all parameters to sample from the posterior. By specifying that the spatially referenced random effects follow a CAR structure, we immediately have the full conditionals for the effects:
 $$\phi _{i} \,\mid\,\phi _{{{\minus}i}} \,\sim\,{\cal N}\left( {\mathop{\sum}\limits_{j\,\ne\,i} b_{{ij}} \phi _{j} ,\tau _{{ci}}^{2} } \right),i{\equals}1,\,\ldots\,n$$
Hence, we need not apply Brook’s Lemma to deduce a joint distribution or alter the CAR structure to induce propriety. Rather, we simply can sample from these conditionals to predict our random effects. CAR models thereby are a natural fit for Bayesian modeling.
The relevance of Bayesian methods
Besides allowing us to estimate a CAR model, Bayesian modeling also offers a more appropriate strategy for statistical inference. As Gill (Reference Gill2001) notes, data composed of the 50 American states comprise a complete population. However, classical inference assumes that a fixed population-level data generating process stochastically produces a sample of data. Frequentist and likelihoodist methods, therefore, aim to help the researcher use sample-level data to draw inferences about unobserved population parameters. For a scholar of state politics to rely on classical inference, he or she would have to assume that the observed data are based on 50 states that “might have been” or what the 50 states “might have done.”
By contrast, Bayesian methods assume that the population parameters are random quantities and treat the data as fixed information. In the case of state policy, it might make more sense to think of policy outcomes as deterministic facts, rather than randomly occurring outcomes. The goal of the researcher in this case would be to craft a model that offers a good description of when certain policies occur.
Beyond a useful description, it is important that the researcher explains the uncertainty he or she has in model estimates. Again, frequentist methods accomplish this by drawing population inferences, but are less suited to reporting uncertainty when the model is fit over the entire population. (R 2 is one of the few quantities that does speak to this issue.) By contrast, Bayesian inference can readily speak to this issue because parameters are considered random. Therefore, an analyst can make probabilistic statements about parameters that will reflect an appropriate level of uncertainty given the population-level data. This paper will therefore present baseline models using Bayesian inference, and then a hierarchical Bayesian model that also incorporates a CAR error structure. In so doing, the paper should illustrate not only how to deal with concerns over spatial autocorrelation but also how models of a full population can use the Bayesian paradigm effectively.
The scope of the problem: Monte Carlo experiment
To what degree does the problem of geographic correlation threaten the accuracy of inference? To what degree can Bayesian CAR models alleviate inefficiency problems? To get a sense of this, we conduct an experiment in which an outcome variable is simulated according to a linear model with two predictors, one independent disturbance term, and one CAR disturbance term.Footnote 5 We manipulate two treatment variables: the level of spatial dependence in the error term and whether one of the predictors itself is spatially correlated. With each simulated dataset, we fit a standard Bayesian linear model and a Bayesian model with CAR random effects. For each treatment, we record coefficient estimates’ mean absolute error (MAE).
Again, the first treatment parameter is the share of variance that spatially clusters. In this experiment and in real applications, we use Best et al.’s (Reference Best, Waller, Thomas, Conlon and Arnold1999) spatial clustering measure:
 $$\psi {\equals}{{\sigma _{c} } \over {\sigma _{c} {\plus}\sigma _{h} }}$$
In this measure, σ c is the standard deviation of the spatial errors, and σ h is the standard deviation of the independent errors. ψ ranges from 0 to 1, with higher values meaning more spatial correlation. In our experiment, we manipulate the population ψ value from 0.1 to 0.9 to examine how a Bayesian CAR model performs against a standard Bayesian linear model. For the second treatment, we consider how the two predictor variables (called x 1 and x 2) are simulated before they are used to define the outcome variable (called y). We always simulate x 1 as a set of stochastic draws from a standard normal distribution. For x 2, in one set of treatments, we treat this variable as another set of stochastic standard normal draws. In the other set, however, we force the observations of x 2 to follow a CAR correlation structure.
Turning to the results, Figure 2 shows the MAE of the coefficients on the two predictors as the relative level of spatial clustering changes and when neither predictor contains any spatial correlation. The figure’s first panel shows the MAE for x 1, and the second panel shows the MAE for x 2. The horizontal axis of each panel shows the population value of ψ, or relative share of spatial clustering in errors. On the vertical axis is the MAE for the estimated coefficient for that predictor at that level of clustering. Blue dashed lines represent the MAE for a simple Bayesian linear model, while solid red lines represent the MAE for the Bayesian model that also includes CAR disturbances.
Mean absolute error of the coefficients of two predictors when neither is spatially correlated, contingent on the share of error variance with clustering. (a) Predictor x 1 and (b) predictor x 2. CAR = conditional autoregressive

As Figure 2 shows, as the level of spatial clustering rises, the efficiency gain from the CAR model (relative to a standard linear model) rises. For both predictors, we can see that at low values of spatial clustering (0.1 ≤ ψ ≤ 0.3), the standard linear model actually has a slightly lower MAE. This makes sense, as the CAR model does require additional parameters, yet there is not much of a spatial correlation problem here. However, for each coefficient, starting at ψ = 0.4, the CAR model outperforms the linear model with a lower MAE, and the gap for each coefficient widens as the relative clustering increases. Thus, the efficiency gains of the CAR model do rise as the level of spatial correlation rises.
Turning to Figure 3, we now consider the case where variable x 2 is spatially correlated itself. In this figure, all components have the same representation as before. In the first panel, predictor x 1 has no spatial correlation among neighboring observations. We can see that the MAE for the coefficient on this variable is not altered by the fact that the other predictor is spatially correlated—the relative efficiency responds to ψ similarly to the previous pattern. By contrast, for x 2, the predictor that is spatially correlated, the error variance of the linear model rises rapidly as the errors become more spatially correlated, while the CAR model stays fairly steady in its level of error. Thus, having a spatially correlated predictor raises the stakes for accounting for the error structure for the sake of efficient estimates. In sum, the CAR model’s efficiency gains increase as the level of spatial correlation in the errors increases and whenever a predictor is itself spatially correlated. Having illustrated the CAR specification’s importance for the sake of efficiency, the remainder of this paper shows how this kind of model can be applied in cross-sectional and multilevel panel settings.
Mean absolute error of the coefficients of two predictors when the second is spatially correlated, contingent on the share of error variance with clustering. (a) Uncorrelated predictor x 1 and (b) correlated predictor x 2. CAR = conditional autoregressive

Cross-sectional data: Statehouse Democracy
A seminal study of representation in the United States is Erikson, Wright and McIver’s (Reference Erikson, Wright and McIver1993) Statehouse Democracy. This book shows, among other findings, that public ideology strongly affects general policy liberalism in the 50 states. Despite several researchers’ additions to this model, the result of opinion–policy congruence has stood the test of time against new methods, new data, and new covariates. Given how strong, robust, and important this result is, the Statehouse Democracy model offers an interesting test case for the CAR model.
Erikson, Wright and McIver (Reference Erikson, Wright and McIver1993: 126) develop a detailed recursive model in which public opinion liberalism influences policy outcomes directly as well as indirectly through party elite liberalism, Democratic party identification, Democratic legislative strength, and legislative liberalism. Geography could matter to a model like this because neighboring states are more likely to share unmeasured traits than distant states. If these unmeasured traits consistently shape policy outcomes, then the error terms will be geographically autocorrelated. A CAR model can offer efficiency gains if such spatial correlation is strong.
Equation 8 presents a CAR structural equation model that follows the Statehouse Democracy model’s recursive structure (Erikson, Wright and McIver Reference Erikson, Wright and McIver1993, 129). The Y variables are, respectively, party elite liberalism, Democratic party identification, Democratic legislative strength, legislative liberalism, and policy liberalism. x is public opinion liberalism.
 $$\eqalignno{ Y_{{1i}} & {\equals}\beta _{1} x_{i} {\plus}\theta _{{1i}} {\plus}\phi _{{1i}} \cr Y_{{2i}} & {\equals}\beta _{2} x_{i} {\plus}\beta _{3} y_{{1i}} {\plus}\theta _{{2i}} {\plus}\phi _{{2i}} \cr Y_{{3i}} &{\equals}\beta _{4} x_{i} {\plus}\beta _{5} y_{{1i}} {\plus}\beta _{6} y_{{2i}} {\plus}\theta _{{3i}} {\plus}\phi _{{3i}} \cr Y_{{4i}} & {\equals}\beta _{7} y_{{1i}} {\plus}\beta _{8} y_{{3i}} {\plus}\theta _{{4i}} {\plus}\phi _{{4i}} \cr Y_{{5i}} & {\equals}\beta _{9} x_{i} {\plus}\beta _{{10}} y_{{3i}} {\plus}\beta _{{11}} y_{{4i}} {\plus}\theta _{{5i}} {\plus}\phi _{{5i}} \cr \beta _{j} \,&\sim\,{\cal N}(0,1000) \cr \theta _{{ki}} \,& \sim\,{\cal N}(0,\sigma _{k}^{2} ) \cr \phi _{{ki}} \, &\sim\,CAR(1\,/\,\lambda _{k} ) \cr 1\,/\,\sigma _{k}^{2} & \sim\,{\cal G}(4.56420496,2.1364) \cr \lambda _{k} \, &\sim\,{\cal G}(1.0,1.0) $$
As Equation 8 shows, vague conjugate priors are assumed for the coefficients (β j). The θ terms refer to the independent disturbance in each equation, with each equation’s disturbances having a homoscedastic variance. The φ terms refer to the spatial clustering random effect in each equation, with a CAR prior on each. The variance for each of the random effects terms is freely estimated and the hyperpriors for these parameters are based on the fair prior recommendation of Bernardinelli, Clayton and Montomoli (Reference Bernardinelli, Clayton and Montomoli1995).
Figure 4 is a forest plot that contrasts the results from the model in Equation 8 to those from a set of recursive Bayesian linear models.Footnote 6 The left margin lists the input variable and the outcome it influences. (In other words, the top coefficient is the effect of legislative liberalism on policy.) The horizontal axis presents the values that a coefficient may take. The point characters are placed to reflect the mean of the posterior distribution of a coefficient. The line segments are placed to reflect the range of the 90 percent credible intervals, meaning there is a 0.9 posterior probability that the coefficient falls within that range. Solid red lines with red triangle characters present the results for a CAR model, while dashed black lines with circle characters present the results for a standard linear model.
Posterior means and 90 percent credible intervals of coefficients for the policy liberalism model using results from linear models and results from a CAR structure. The models were fitted with a post burn-in MCMC sample of 600,000 in OpenBUGS 3.2.3. CAR = conditional autoregressive; MCMC = Markov chain Monte Carlo

As Figure 4 shows, the mean coefficient estimates shifted only marginally, and the credible intervals show no drastic change. It is notable that all of the CAR credible intervals are a bit wider than the intervals from the model with independent errors, so in general the wider intervals ought to be the safer choice for expressing the level of model uncertainty. In this case, none of the substantive conclusions changed from what was reported in Statehouse Democracy. However, the overall model fit is a bit better with the CAR model—the Deviance Information Criterion (DIC) for the CAR model is 247.5, which is lower score and thereby a better penalized fit than the independent-error model’s DIC score of 334.9.
Beyond the better fit, even when mean estimates and credible intervals do not change much, researchers still have a potentially useful estimate of spatial clustering in the conditional variance. We use Best et al.’s (Reference Best, Waller, Thomas, Conlon and Arnold1999) ψ measure of spatial clustering reported in Equation 7. For this model, the mean  $$\hat{\psi }$$ values are 0.5317 for party elite liberalism, 0.4571 for Democratic party identification, 0.4429 for Democratic legislative strength, 0.3815 for legislative liberalism, and 0.4054 for policy liberalism. With all of these, our prior was that ψ≈0.5. Hence, for these five variables, the data indicated less spatial correlation than our prior indicated for four of the outcomes, pulling the posterior mean down below 0.5. For party elite liberalism, however, the data pulled the posterior mean upward, indicating that there is more spatial clustering than our prior of half of the unexplained variance. Thus, we learn that one of these variables shows relatively high spatial correlation, while the other four do not. While the original findings from Statehouse Democracy stand up in this model, we do learn more about the spatial patterns of the variables in the model.
Multilevel panel data: support for welfare policies
A second example applies Bayesian hierarchical modeling to multilevel panel data, replicating Margalit’s (Reference Margalit2013) study of the determinants of support for social welfare programs. Using survey data of all 50 states and Washington, D.C. across four waves, Margalit utilizes OLS with fixed effects for states and waves on survey responses to questions about individuals’ support for welfare policies. He finds that recent, personal economic shocks (more specifically, the recent loss of one’s job) increases individuals’ support for these policies. Geographic correlation may be present: As ideology and overall economic health cluster geographically, preferences on welfare spending also may cluster.
Equation 9 presents a CAR model with random effects introduced on waves and a Bayesian CAR prior placed on the random effects for states:
 $$\eqalignno{ Y_{{ijt}} \,& \sim\,{\bf x'_{{ijt}} \bibeta} {\plus}\nu _{t} {\plus}\phi _{j} {\plus}\theta _{{ijt}} \cr \beta _{k} \,& \sim\,{\cal N}(0,1000) \cr \theta _{{ijt}} \,& \sim\,{\cal N}(0,1\,/\,\delta ) \cr \nu _{t} \,& \sim\,{\cal N}(0,1\,/\,\eta ) \cr \phi _{j} \,& \sim\,CAR(1\,/\,\tau ) \cr \delta \,& \sim\,{\cal G}(1.0,1.0) \cr \eta \,& \sim\,{\cal G}(0.1,0.001) \cr \tau \,& \sim\,{\cal G}(0.1,0.001) $$
Here, i references the individual respondent, j represents his or her state, and t represents the time wave of the response. x′ijt is a vector of covariates for an observation that includes variables for recent job loss, severe drop in household income, job insecurity, spouse losing a job, previous welfare support, party ID, long-term unemployment status, having a new job, whether one is looking for a job, income (logged), education, race, gender, age, marital status, the county unemployment rate, and a constant. β is the vector of population-wide parameters, and each term β k (where k = 0,…,28) is an individual element of that vector. θ ijt is the heterogeneous error term for each individual-year observation. ν t refers to the random effect for wave t, and φ j refers to the spatial clustering random effect for each state j. The coefficients have vague normal priors, and the precision terms have vague gamma-distributed hyperpriors. We compare this to a rival model with state-level random effects that are independent of each other, instead of clustered with a CAR prior.Footnote 7
Figure 5 presents a forest plot of the results of the two models: the first with independent random effects terms on waves and states, and the second with random effects on waves and CAR random effects on states. The horizontal axis shows coefficient values, the vertical axis displays variable names, posterior means are shown with points, and the associated credible intervals are shown with line segments. The results generally replicate Margalit’s findings, with some interesting caveats: recently losing a job tends to increase individuals’ support for welfare programs, but other economic shocks such as a spouse losing a job, job insecurity, or a drop in household income shows no robust effect.Footnote 8 Familiar control variables such as party identification perform as expected, with Republicans supporting welfare programs at lower levels. Interestingly, the converse of a recent economic negative shock shows no substantial impact: recently acquiring a new job does not have an effect on individuals’ level of welfare support. Longer term personal employment variables such as being unemployed for multiple years or not being in the labor market have no clear effect.
Posterior means and 90 percent credible intervals of coefficients from the model of welfare support with wave random effects and CAR spatial effects. The models were fitted with a post burn-in MCMC sample of 600,000 in OpenBUGS 3.2.3. CAR = conditional autoregressive; MCMC = Markov chain Monte Carlo

This model shows just how easy it is to specify a multilevel model with CAR-distributed random effects. By simply following the normal model structure and adding this constraint, we allow for spatial correlation by state. In doing this, the overall model fit is improved with a CAR structure. The CAR model has a DIC score of 8141, which is lower than the score of 8150 for the model with independent state-level random effects.
For two more examples of how to apply CAR models in various settings, as well as a tutorial on how to apply this model in OpenBUGS, please see the Online Appendix. The Online Appendix shows an example of CAR modeling for panel data without a multilevel structure but with a limited dependent variable—a count model. That example replicates Monogan’s (Reference Monogan2013a) analysis of state-level Clean Air Act enforcement actions. The Online Appendix also shows an example duration model with an update of Berry and Berry’s (Reference Berry and Berry1990) analysis of lottery adoptions. In that example, a spatial lag term actually loses its robust effect when spatial errors are accounted for. Finally, the tutorial (along with example code available through Dataverse) is intended to show the practical researcher how to apply these methods.
Implications for the practical researcher
This paper has aimed to illustrate the usefulness of spatial CAR models in order to yield more accurate inferences in the analysis of state-level data. In doing so, hopefully a few clear ideas stand out for the applied policy analyst. The applied researcher should carefully consider what assumptions are fair to make and how the model can be built to reflect the data accurately. If the data have features such as geographic dependence, then addressing these can yield more accurate inferences in substantive conclusions. This could be because ignoring autocorrelation produces unfairly small credible intervals (as we see in our examples), because the point estimates from our data are grossly out-of-line due to inefficiency (as the Monte Carlo analyses would imply), or because adding a geographic structure to the errors prevents a geographically correlated variable like a diffusion parameter from compensating for an error process (as the lottery adoption example shows).
Further, these models offer new quantities that are interesting to report. In the simple case of a continuous outcome, one can observe the distribution of the independent and clustering random effects. With the Statehouse Democracy model, we were able to see that party elite liberalism showed a relatively high level of geographic correlation in the errors. We also can report variances of spatially correlated random effects as a means of breaking down how the unexplained variance breaks-down across data structures and geography. The 50 states form a complete population, and each observation is likely to be similar to its neighbors. Therefore, quantities that speak to the level of clustering in an outcome promise to be useful because they allow researchers to report how the states are truly interdependent. Overall, state-level data have unique aspects that require careful attention and can often lead to complex models. Of course, non-continuous, time-dependent, and geographically oriented data pose difficulties, but also offer unique opportunities for assessing causality and entertaining unique kinds of relationships. Thus, fully addressing the complexities of state data can also be a benefit to developing a deeper understanding of the enactment and impact of policies and other outcomes. This article has served to update our understanding of several results in state politics through new data and methods, to show that geographic dependence is a major factor in state politics, and to demonstrate how to apply these techniques.
Supplementary Material
To view supplementary material for this article, please visit https://doi.org/10.1017/psrm.2018.55
Acknowledgements
For helpful assistance, the authors would like to thank Dominik Hangartner, Bradley P. Carlin, Anna Bassi, Mark D. Ramirez, Ryan Moore, Jeff Gill, Andrew Womack, Ryan Bakker, Michael New, Andrew Karch, Kosuke Imai, Shauna Reilly, Garrick Percival, Michael H. Crespin, Andreas Murr, Jason Reifler, Brian Fogarty, Annie Watson, George Williford, Guy Whitten, and Scott Cook. For coding original data, we thank Dustin Elliott and Ryan Williamson. For providing replication data, we thank Andrea McAtee, Bill Berry, Yotam Margalit, and Jerry Wright. For providing useful code, we thank David Darmofal, Patrick Brandt, Bradley P. Carlin, and Sudipto Banerjee.



