


Introduction
During winter the Sea of Okhotsk is exposed to the very cold monsoon driven by the air-pressure system of the Siberian high to the west and the Aleutian low to the east. As a result, sea ice forms annually in the Sea of Okhotsk despite its being located in mid-latitudes. However, sea-ice extent in the Sea of Okhotsk fluctuates considerably from year to year. For example, >90% of the area was ice-covered in winter 1979, and only about 50% in 1984. By contrast, the minimum sea-ice extent in the Bering Sea during the period 1972–95 occurred in 1979 and the maximum in 1984. In addition, snowfalls in northern Japan were unusually light in 1979 and extraordinarily heavy in 1984. Therefore, it is likely that the above correlations can be related to the change of atmospheric circulation in the Northern Hemisphere or to the change in position and intensity of the Siberian high and Aleutian low.
Our understanding of the Sea of Okhotsk ice has improved since the advent of satellite-borne microwave radiometers in the 1970s. For example, Reference Parkinson and GratzParkinson and Gratz (1983) discussed characteristics of the seasonal ice cover and concluded that oceanographic factors such as convective depth and ocean currents were important in determining the sea-ice distribution. They also argued that some interannual variations in sea-ice extent were accounted for by inter-annual variations in the atmospheric pressure system. Reference Cavalieri and ParkinsonCavalieri and Parkinson (1987) analyzed 3day averaged satellite observations for the period 1972–76 and found occasional out-of-phase relationships between the fluctuations of sea-ice cover in the Sea of Okhotsk and the Bering Sea. The sea-ice fluctuations were then related to changes in position and intensity of the Siberian high and Aleutian low by applying wavenumber analysis to the mean sea-level pressures (SLPs) over the latitude zone 45–70˚ N. Reference ParkinsonParkinson (1990) examined the impact of the Siberian high and Aleutian low on the sea-ice cover of the Sea of Okhotsk and found that the strong correspondence during the period 1973–76 between the Sea of Okhotsk ice extent and the Siberian high was not maintained in the period 1978–86. On the other hand, Reference Kimura and WakatsuchiKimura and Wakatsuchi (1999) studied sea-ice processes controlling the advance/retreat of the Sea of Okhotsk ice by using a new algorithm to distinguish between first-year ice, young ice and new ice, and concluded that the advance of sea-ice extent in the Sea of Okhotsk occurred primarily through sea-ice drift by strong winds.
The objective of this paper is to clarify the interrelation between sea-ice growth in the Sea of Okhotsk and the atmospheric circulation in the Northern Hemisphere. In particular, the role of the Aleutian low and Siberian high in sea-ice growth is examined in detail by comparing weekly growth rates of sea-ice extent with weekly means of atmospheric circulation. Special reference is made to occasional negative correlations between the sea-ice growth in the Sea of Okhotsk and that in the Bering Sea. Finally, there is a discussion of the controlling factor for the ice-cover growth, with emphasis on the important role of fetch (downwind distance from the coast).
Statistical Features of the Growth of Sea-Ice Cover in the Sea of Okhotsk and the Meteorological Environment
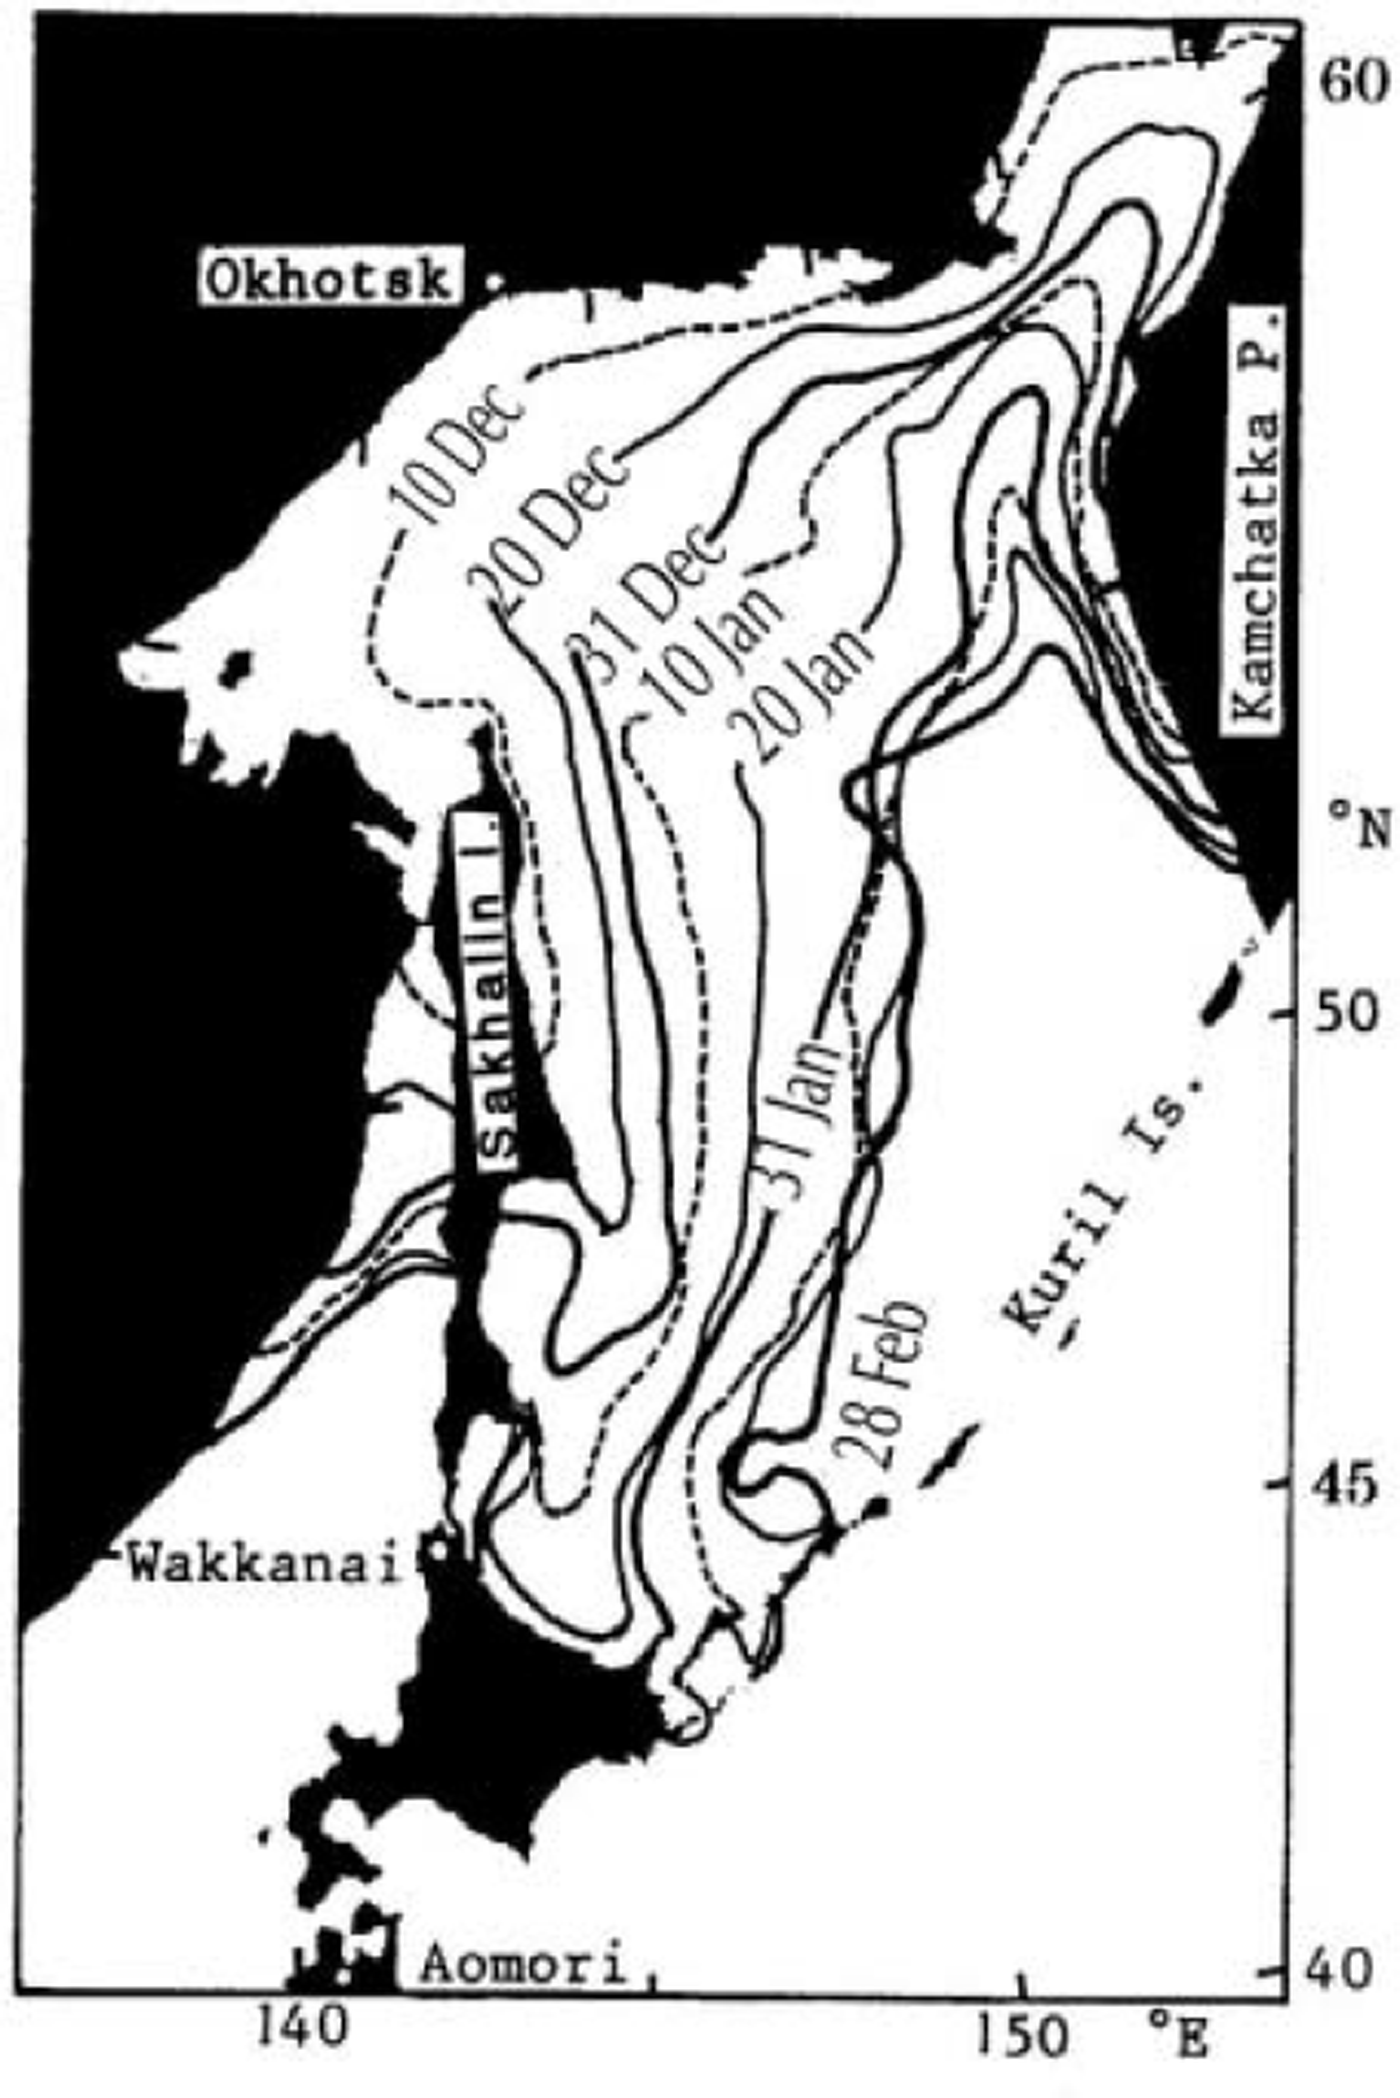
The Japan Meteorological Agency (1991) published atlases of the mean time evolution of sea-ice cover in the Sea of Okhotsk over the period December 1970–May 1990 based on daily satellite observations of sea-ice extent by visible radiometers on board the US Environmental Science Services Administration satellite (ESSA; 1970–71), the US National Oceanic and Atmospheric Administration satellite (NOAA; 1972–76) and the Japanese Geostationary Meteorological Satellite (GMS; 1977–90). The sea-ice extent was defined as such when the ice concentration was >50%, and the sea-ice extents on the 0.25˚/0.25˚ grid system were averaged over 5 days. Figure 1 shows the time sequence of the 20 year mean sea-ice extent for the 10th, 20th and last day of each of the months December–February. We clearly see that the west and north coast regions are ice-covered by the beginning of December and then the ice cover advances eastward and southward, respectively, to the central part of the Okhotsk basin. The monthly growth rate of sea-ice cover is found to be much greater in December and January than in February. Although the figure is not presented here, the sea-ice cover retreats in reverse order, disappearing first in the central part of the basin and then drawing back toward the coastal regions. Reference Gloersen, Campbell, Cavalieri, Comiso, Parkinson and ZwallyGloersen and others (1992) have also shown that the sea-ice cover advances from inshore to offshore regions in the normal direction to the coastline, and retreats in reverse order not only in the Sea of Okhotsk and but also in other regional seas. This means that the sea-ice season is longer in the coastal regions than in the central region of the Sea of Okhotsk, and suggests that the sea ice is thicker in the coastal regions than in the central region because the air temperature is rather uniform over the Sea of Okhotsk in the ice-melting season (March– May).
We also notice in Figure 1 that the sea-ice zone advances southward along the east coast of Sakhalin island. The speed of advance can be estimated from the displacement of isopleths as about 300 km per 10days or nearly 35 cm s–1. This is in good agreement with observed speeds of the East Sakhalin Current of 30–40 cm s–1 (Reference Ohshima, Wakatsuchi, Fukamachi and MizutaOhshima and others, 2002). We conclude that sea-ice floes are drifted along the east coast of Sakhalin island by the southward coastal current. H. Enomoto and others (unpublished information) have recently estimated sea-ice movements throughout the Northern Hemisphere using the maximum cross-correlation method (Reference Ninnis, Emery and CollinsNinnis and others, 1986), and their results strongly suggest that sea-ice floes are drifted by the southward coastal currents of the East Sakhalin Current, Labrador Current and East Greenland Current, and by the Beaufort Gyre and Transpolar Drift Stream in the Arctic Ocean. In general, however, the direction of sea-ice drift by the ocean current does not seem to coincide with the direction of advance of sea-ice extent. This may suggest that the growth of sea-ice cover in the offshore direction is independent of the sea-ice drift by ocean current.
Mean seasonal advance of the Sea of Okhotsk ice extent averaged over the period December 1970–February 1990. Isopleths correspond to the border of 50% ice concentration at intervals of about 10days. Locations of Okhotsk, Wakkanai and Aomori are indicated by open circles (after Japan Meteorological Agency, 1991).
Instead, it seems likely that the sea surface wind causes the ice-extent growth as discussed before. To obtain a picture of the wind field over the Sea of Okhotsk during winter, the monthly mean December wind field over the 30 years 1950–79 is reproduced from Reference Shinohara and ShikamaShinohara and Shikama (1988) in Figure 2. Northerly winds blow from the continent into the Sea of Okhotsk in the north coast regions, whereas westerly winds dominate in lower latitudes. Comparison of the monthly mean wind field for December with those for November, January and February (figures not presented) shows that the cyclonic wind system gradually develops in the Okhotsk basin from December to February under the influence of the Aleutian low: northerly winds gradually advance southward of 50˚ N in February, and the core longitude of the northerly wind gradually shifts eastward from 141–147˚E in November to 145–157˚E in February. Comparing the wind field (Fig. 2) with the time sequence of sea-ice extent (Fig. 1), we see that the sea-ice cover generally advances southward/southeastward in the wind direction. This may imply that cold-air advection from the continent plays an important role in sea-ice growth and that the downwind distance from coast (fetch) is closely related to the advance of sea-ice cover.
Monthly mean December surface wind velocities averaged over the period 1950–79 (reproduced from Reference Shinohara and ShikamaShinohara and Shikama, 1988).
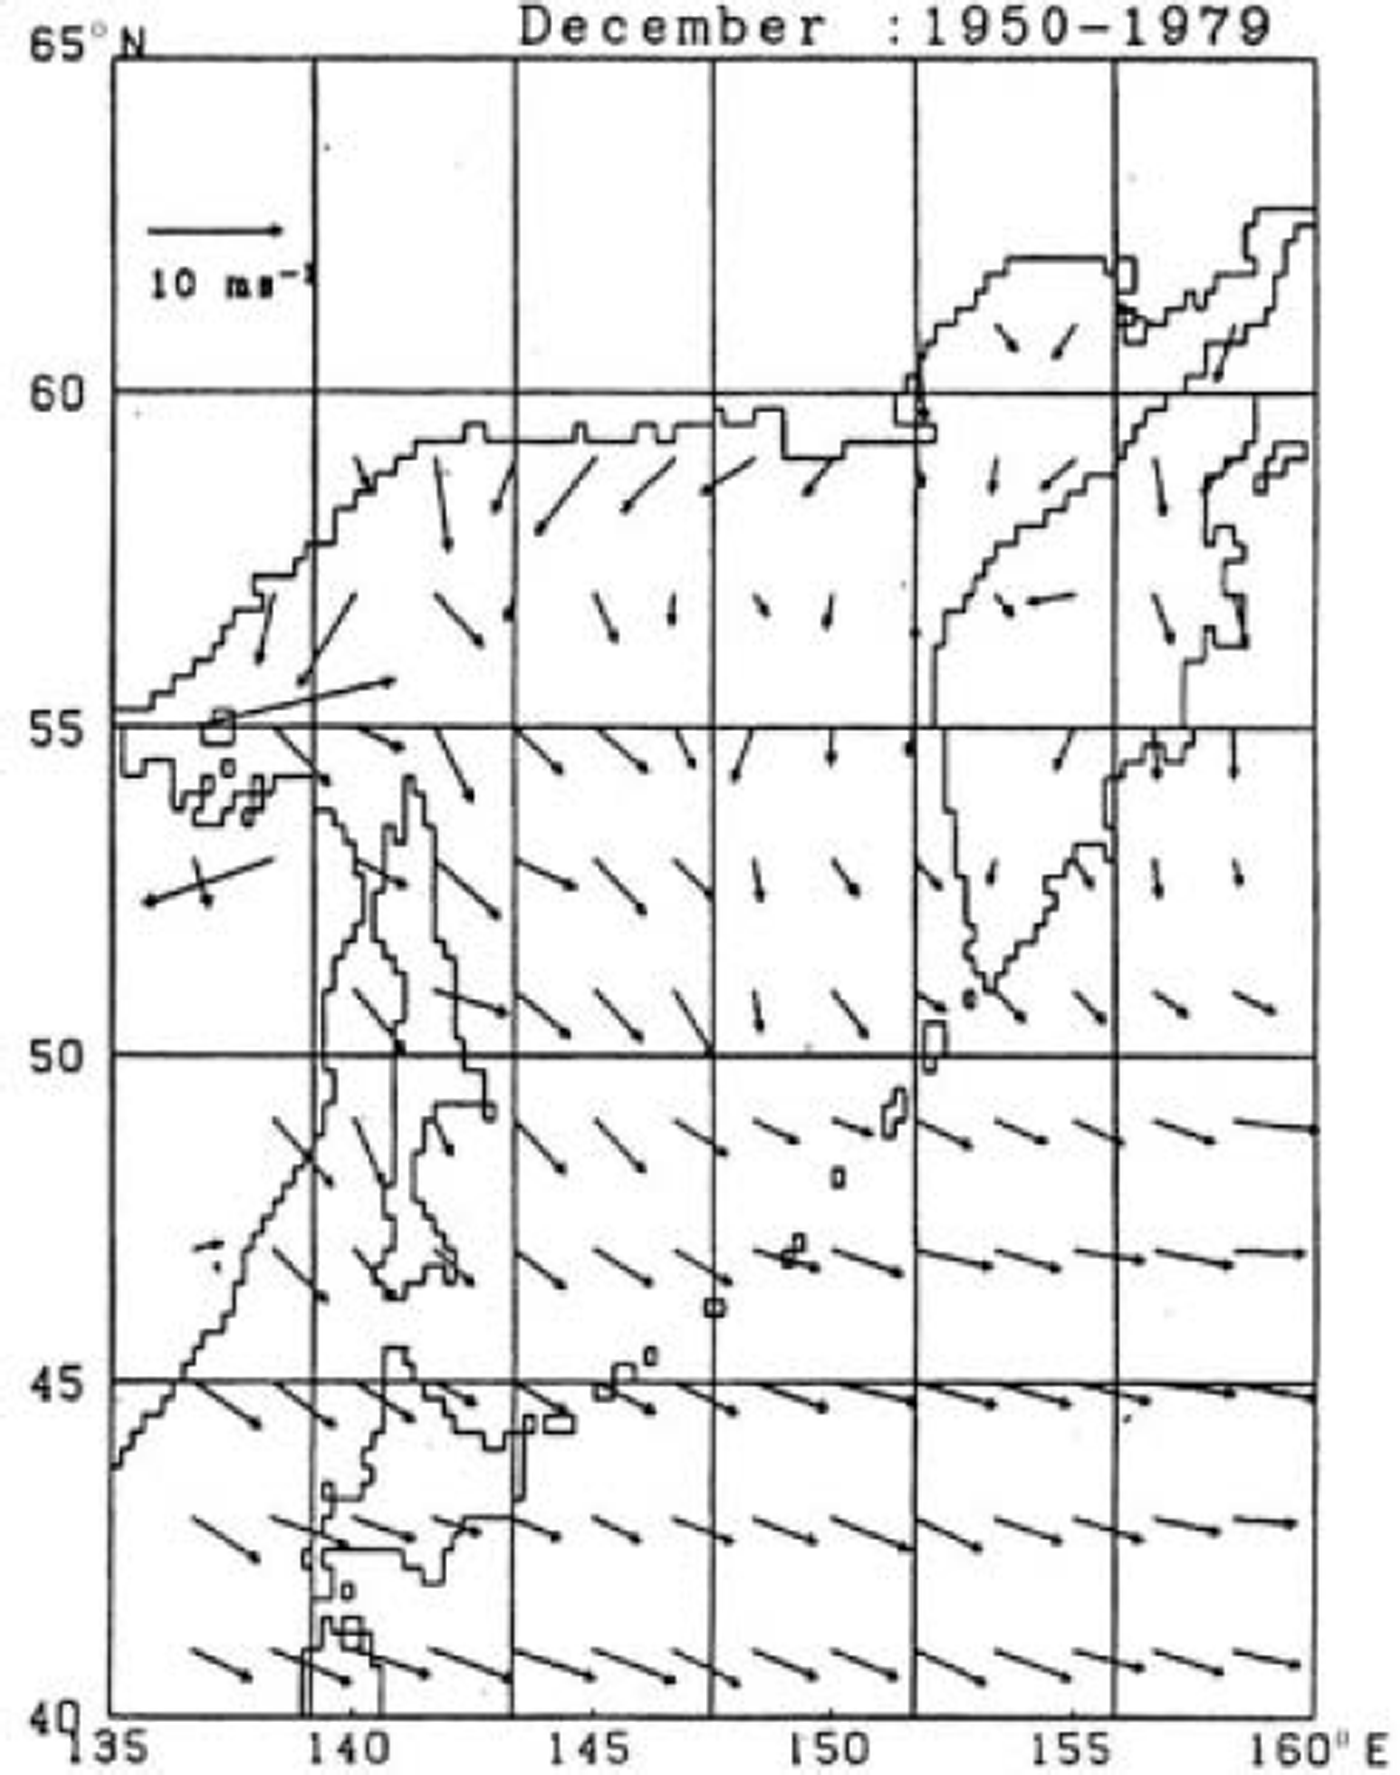
On the other hand, coherent winds are not observed throughout the winter months along the west coast of the Kamchatka Peninsula. This means that cold winds do not blow from the Kamchatka Peninsula to the eastern part of the Okhotsk basin. Accordingly, the sea-ice cover hardly advances westward from the west coast of the Kamchatka Peninsula to the central part of the Sea of Okhotsk (Fig. 1).
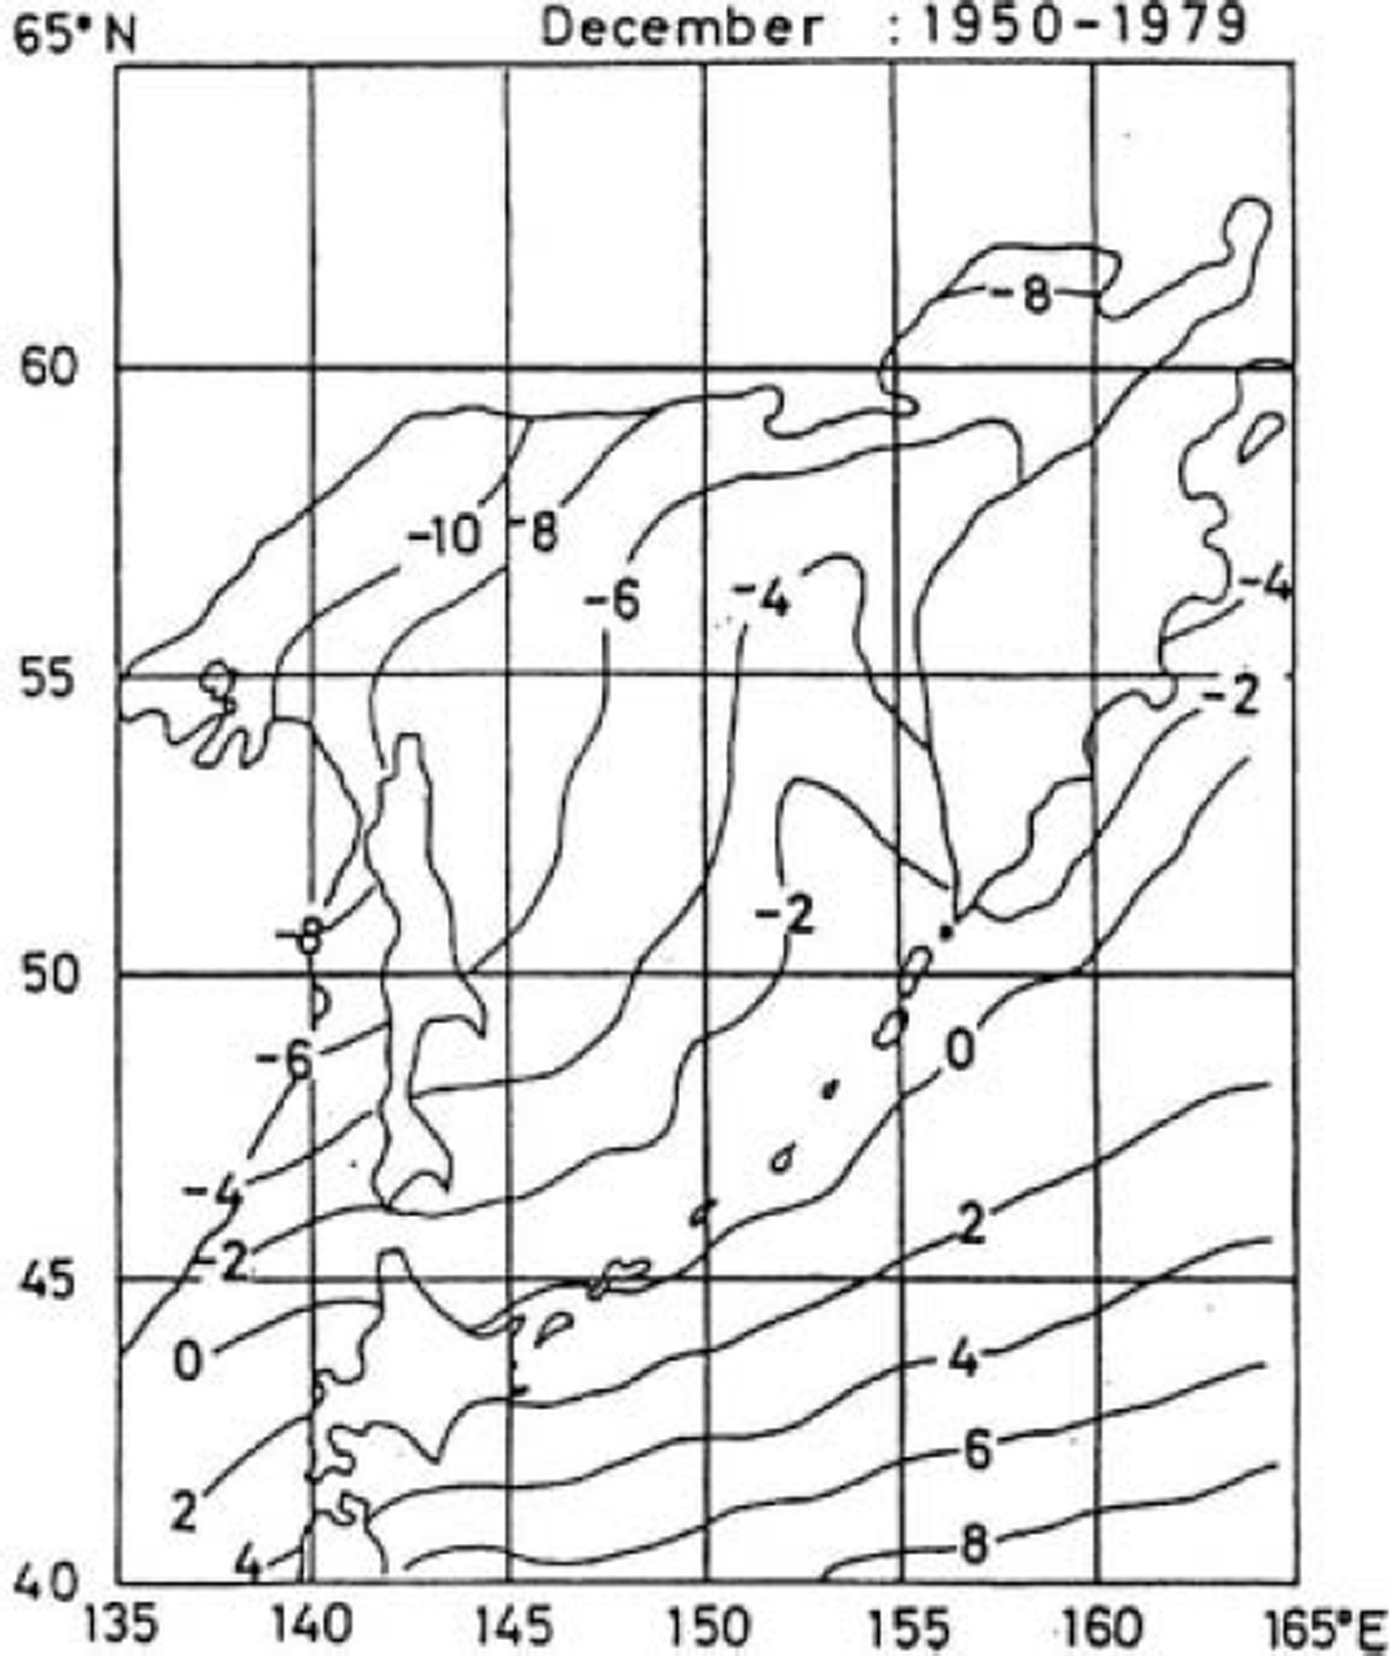
Since sea ice is generated when sea water is cooled by the atmosphere below the freezing temperature (about –1.8˚C), air temperature is likely to hold a key to the growth process of sea-ice cover. The monthly mean December surface temperature field is shown in Figure 3 to examine the possible relationship between air temperature and the growth of sea-ice cover (Fig. 1). Air temperatures are below -8˚C in the west and north coast regions, but rise significantly with downwind distance from the coast (fetch) or toward the Kuril Islands. This may indicate that cold air masses from the continent are warmed over the sea surface and then the capacity of air mass to cool the sea water decreases with fetch, suggesting the importance of the fetch in the growth of the sea-ice field. If we compare the monthly mean surface temperature fields for December with those for November, January and February (figures not presented), we see that the isopleths of -4˚C gradually advance southeastward, reaching the Kuril Islands in February, and that the isopleths of -6˚C give a rough measure of ice-edge zone.
December monthly mean surface temperature averaged over the period 1950–79 (reproduced from Reference Shinohara and ShikamaShinohara and Shikama, 1988).
We now compare the growth of the sea-ice field with temperature variation. In Figure 4, the mean seasonal change of ice-extent growth rate over the period December 1978-May 1990 is shown by hatched squares at intervals of 5 days. The growth rate is as large as 8×10⁴km2 per 5 days in December and January, but decreases considerably in February and becomes negative in early March. The mean seasonal variation of the air temperature at Wakkanai, the northernmost tip of Hokkaido (see Fig. 1 for location), is superposed in Figure 4 by a solid line. Although the air temperature at Wakkanai may differ from that in the central part of the Okhotsk basin, we may expect that the two are highly correlated with each other. It can be seen that the ice-extent growth rate is negatively correlated with the temperature by and large. However, while the minimum temperature occurs in early February, the maximum growth rate occurs during December-January. The correlation coefficient between them is found to be -0.57, but a higher value of lagged correlation (-0.65) is obtained when the growth rate leads the temperature by 20 days. This suggests that air temperature is not the only factor for the growth of ice extent.
Mean growth rate of sea-ice extent in the Sea of Okhotsk over the period December 1978–May 1990. The solid line represents the mean seasonal variation of 5day mean temperature at Wakkanai (see Fig. 1 for location).
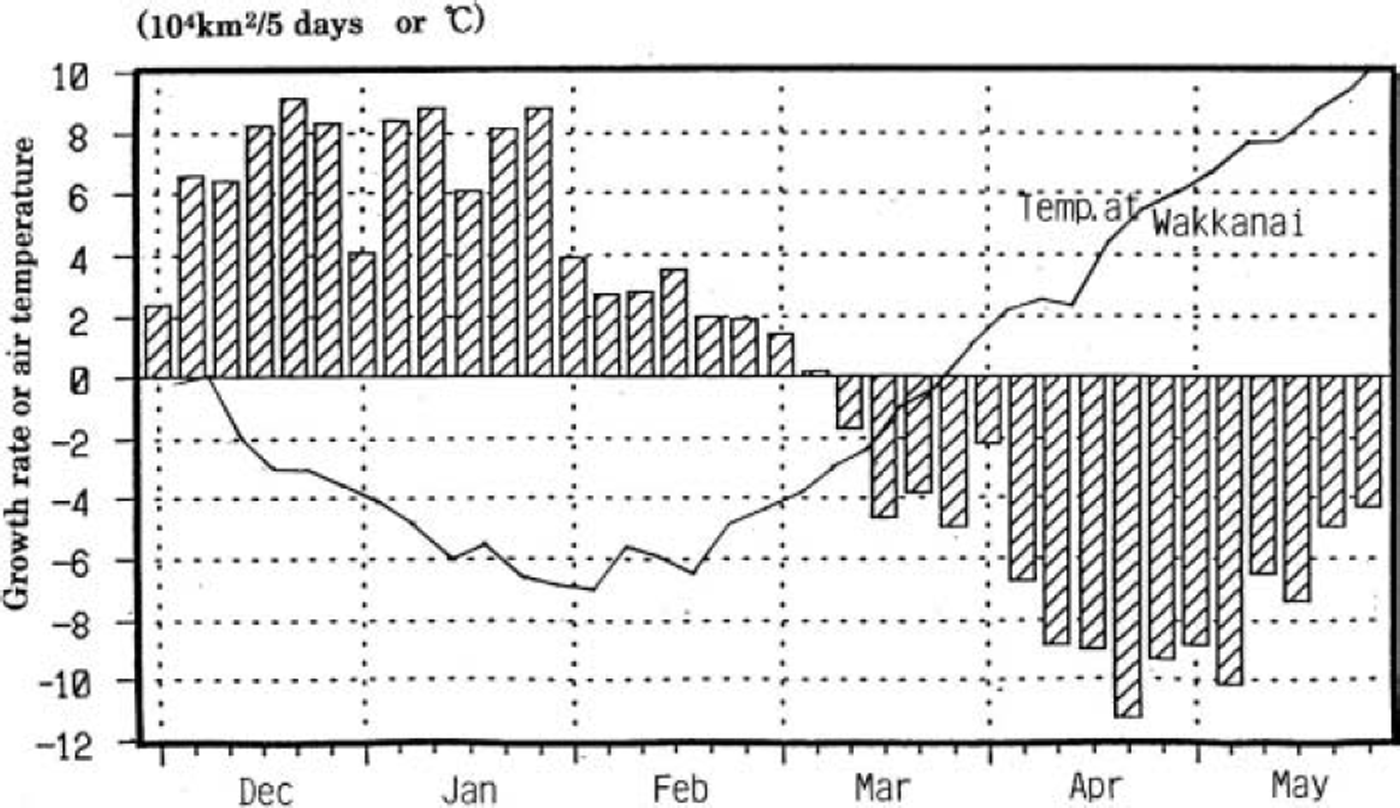
It should be remembered that the sea ice is readily generated in coastal regions where cold air masses of continental origin dominate. Once the sea-ice cover forms near coastal regions, the ice cover may cut off or reduce the heat transport from ocean to atmosphere, preventing the air temperature from rising. In other words, the sea-ice cover works as a kind of new land. Accordingly, cold airs over the ice cover are cold enough to make the sea ice thicker and have the capacity to cool the sea water beyond the ice-edge region until they are warmed in the further distance. Repeating these processes successively may cause the sea ice in coastal regions to thicken and the ice cover to gradually expand in the downwind direction as shown in Figure 1. This may be a reason why the minimum air temperature at Wakkanai does not correspond to the maximum growth rate of ice extent in the Sea of Okhotsk (Fig. 4): open waters in the region of very long fetch are difficult to freeze owing to enhanced air-mass transformation with fetch.
Role of Atmospheric Circulation in the Growth of Sea-Ice Cover
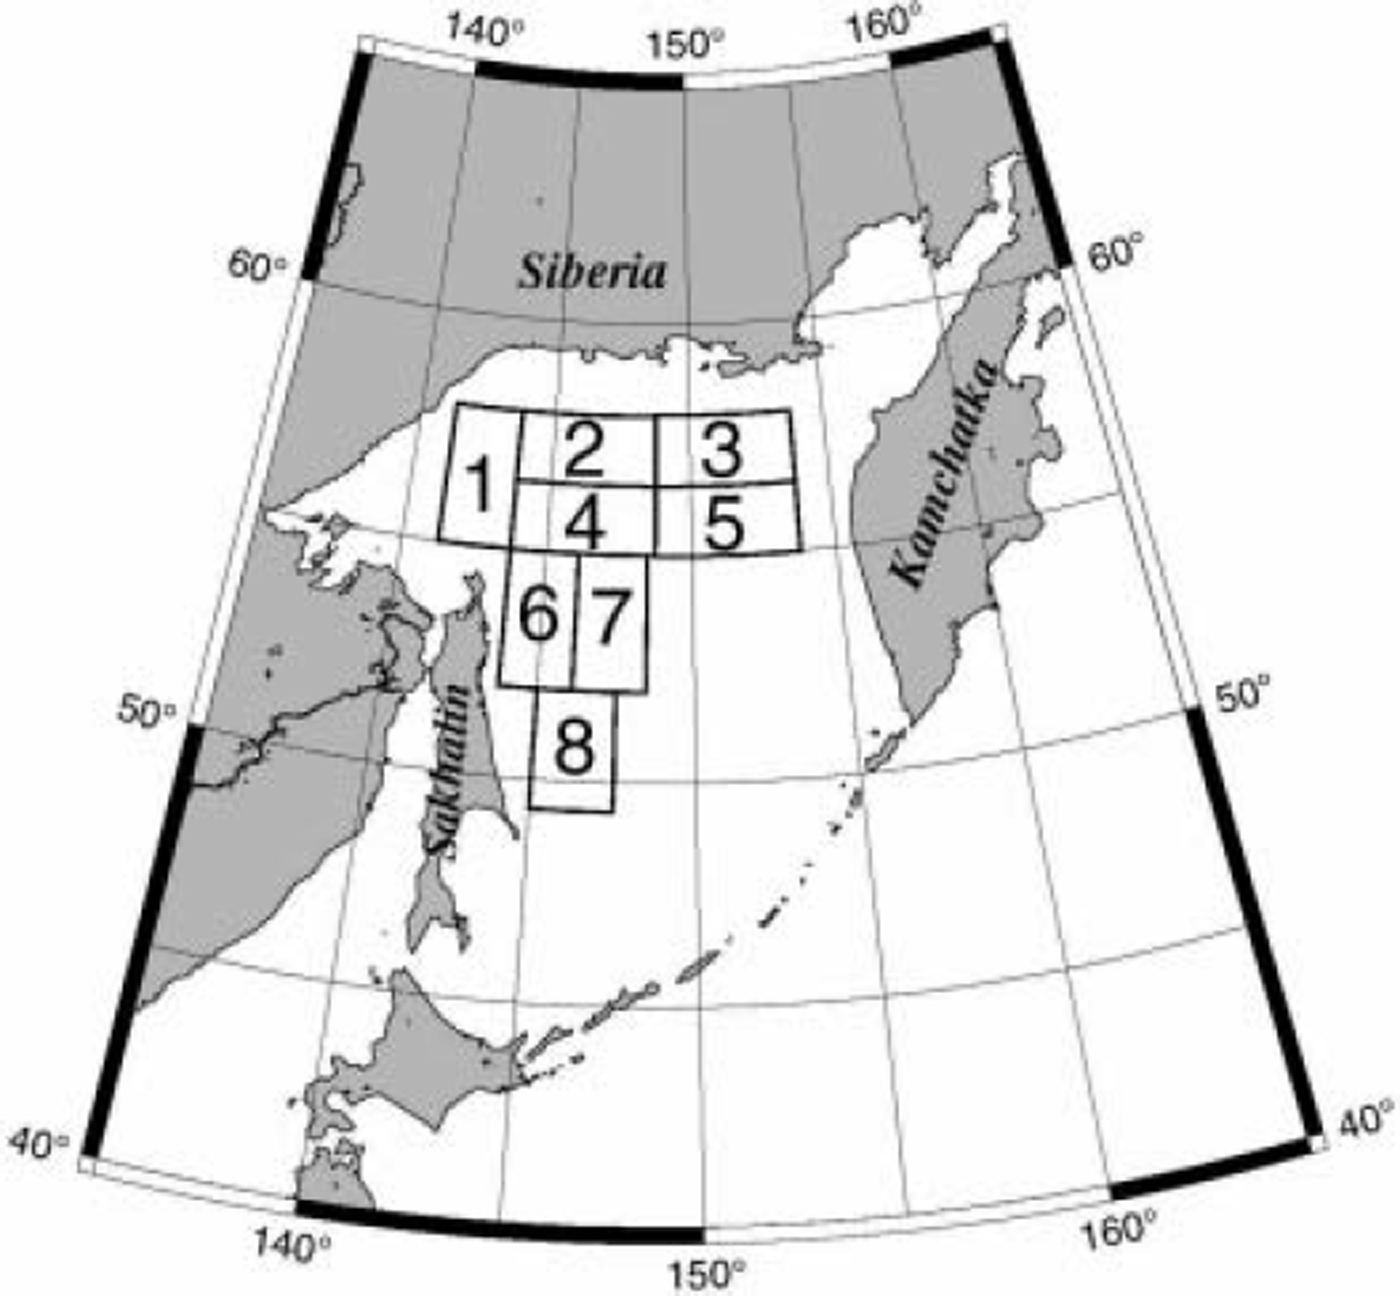
We now examine the relation between the growth of ice extent and atmospheric circulation for various regions in the Sea of Okhotsk. The sea-ice extent data based on microwave radiometer observations were compiled by the US National Snow and Ice Data Center and released as ‘Northern Hemisphere EASE-Grid Weekly Snow Cover and Sea Ice Extent, Volume 2’ on a CD-ROM. The dataset includes weekly sea-ice extents on an equally spaced grid system of 25 km/25 km for the years 1978–95. Each grid is regarded as ice-covered if ice concentration is >15%. From the weekly data, we define the weekly growth rate of ice extent as g = (sea-ice extent for a week – sea-ice extent for the previous week)/(total area of the region concerned). On inspecting the seasonal advance of sea-ice extent shown in Figure 1, we calculate weekly growth rates during December–February for the selected eight regions shown in Figure 5. Each week is then grouped into one of three categories according to the magnitude of weekly ice growth rates: decay week, moderate-growth week, and rapid-growth week when g<0%, 0<g<20%, and 20%<g, respectively.
Locations of eight selected regions in the Sea of Okhotsk for which ice growth rates are calculated.
As for atmospheric data, we use objectively analyzed data of SLP, geopotential height of the 850 hPa surface (Z 850) and air temperature at the 850 hPa height (T 850) from ‘National Meteorological Center Gridpoint Data Set, Version 2’ released by the US National Meteorological Center (NMC) on CD-ROM in 1990. The SLP gives us information on the surface pressure system, and the Z 850 and T 850 on atmospheric circulation and air temperature of the lower troposphere, respectively. The NMC octagonal grid is a 1977 point grid whose points are equally spaced when viewed on a polar stereographic grid. In this form, the grid looks like a 47 by 51 grid with the corners cut off (each corner being 14 gridpoints long). The data for the years 1978–89 are analyzed here.
The twice-daily atmospheric data are averaged to construct composite maps of SLP, Z 850 and T 850 fields for each category of each region. Figure 6 shows the T 850 fields for the cases of g<0% (upper panel) and 20%<g (lower panel) for Okhotsk region 4. (Rough estimates of surface air temperature would be given by T 850 + 10˚C.) They provide a general picture of the air-temperature field during winter in the eastern Eurasian continent. We see that the core of cold air mass lies in the Yakutsk basin, eastern Siberia, and isopleths connecting the Sea of Okhotsk and Bering Sea roughly separate the continental cold air from the oceanic warm air. This means that northwesterly/northerly winds are generally colder than northeasterly/easterly winds in the Sea of Okhotsk. The air temperature in the Yakutsk basin is colder by about 4˚C in the rapid-growth week (lower panel) than in the decay week (upper panel). It should be noted that in the rapid-growth week the Bering Sea has a warmer air temperature than the Sea of Okhotsk in spite of the Bering Sea’s latitude being about 10˚ higher.
Composite maps of T 850 field for the cases of ice decay week (upper panel) and ice rapid-growth week (lower panel) for Okhotsk region 4 . There are 14 decay weeks and 23 rapid-growth weeks. The contours are at intervals of 3 hPa.
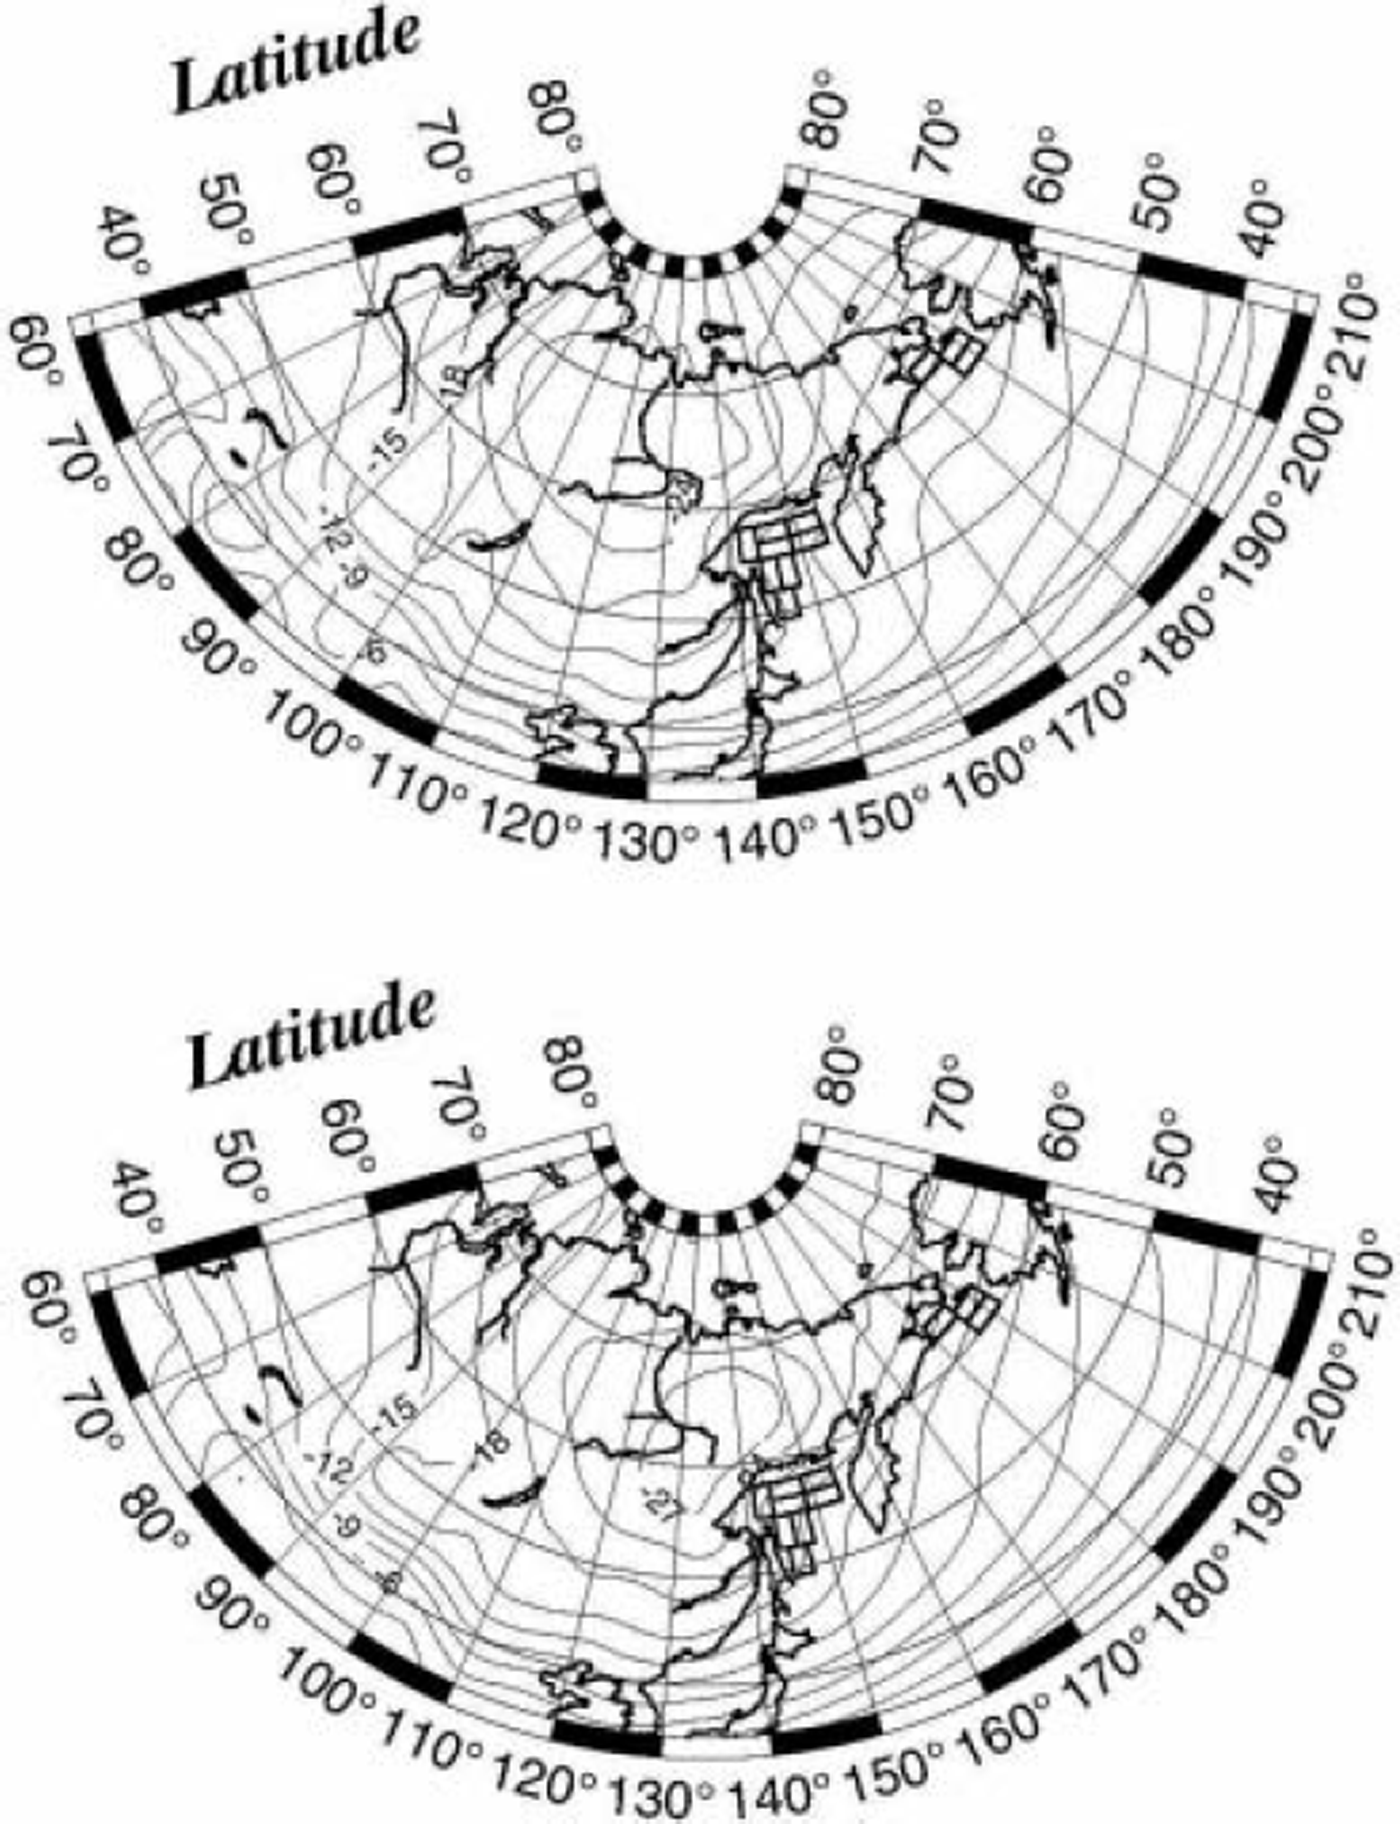
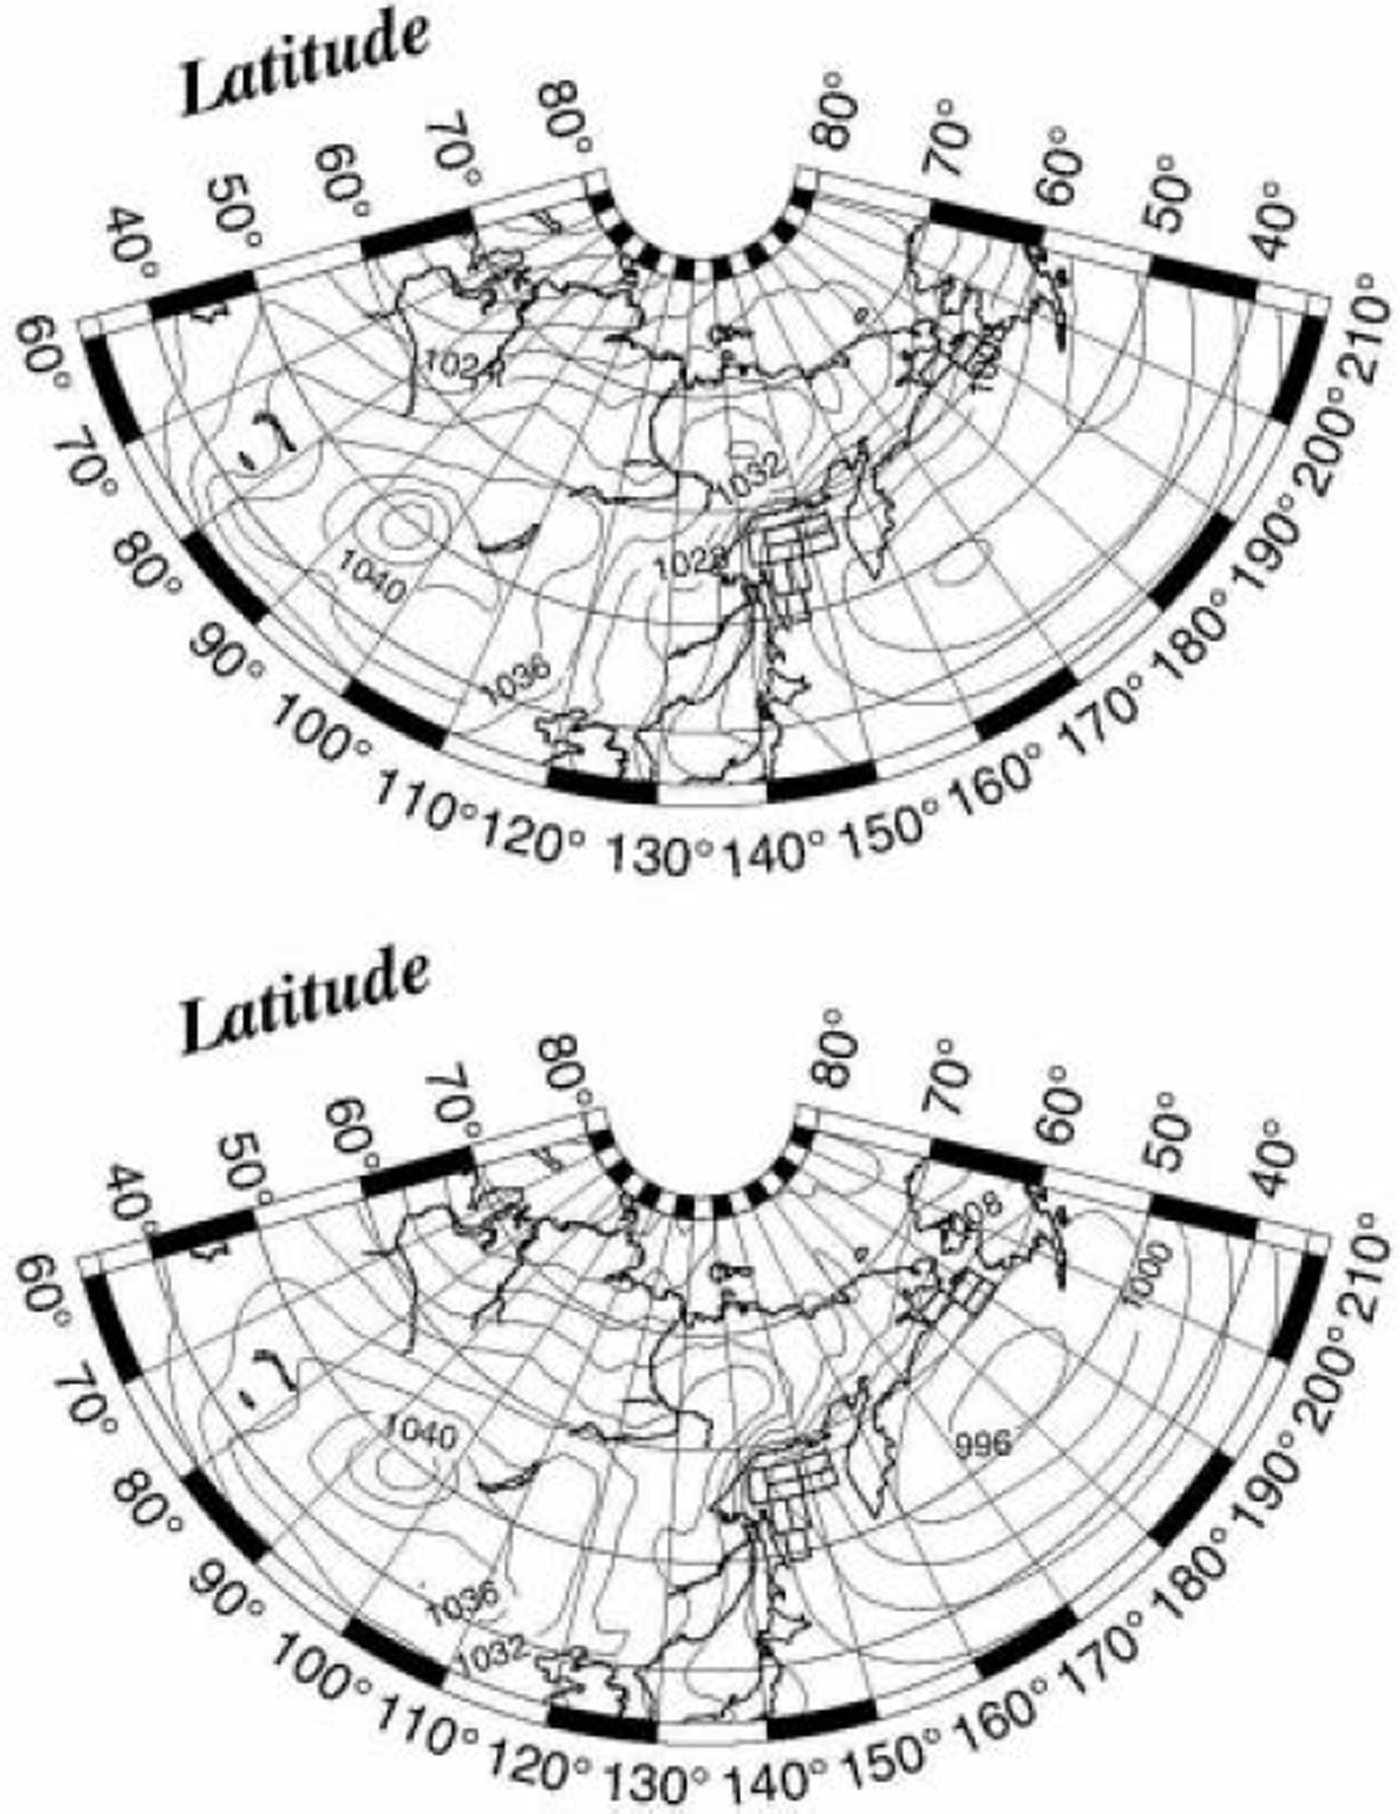
Figure 7 shows the SLP fields for the rapid-growth week (lower panel) and decay week (upper panel) for Okhotsk region 1. No differences are recognized in the position and intensity of the Siberian high, whereas the Aleutian low is much deeper in the rapid-growth week than in the decay week. The core area of the Aleutian low is located in the central part of the Bering Sea (near 53˚ N, 180˚ E) in the rapid-growth week, while it is displaced southeastward in the decay week (near 50˚ N, 160˚ W). The surface wind field can be estimated from the SLP field by recalling that the sea surface wind generally shifts to the left side of the geostrophic wind direction by about 30˚ (Reference OverlandOverland, 1985). We see that northerly winds dominate in the northern part of the Okhotsk basin, while northwesterly winds dominate in the western part. This is consistent with the wind fields shown in Figure 2. We also recognize from the two composites that the wind speed is stronger and the northerly component greater in the rapid-growth week than in the decay week.
Composite maps of SLP field for the cases of ice decay week (upper panel) and ice rapid-growth week (lower panel) for Okhotsk region 1. There are 19 decay weeks and 19 rapid-growth weeks. The contours are at intervals of 4 hPa.
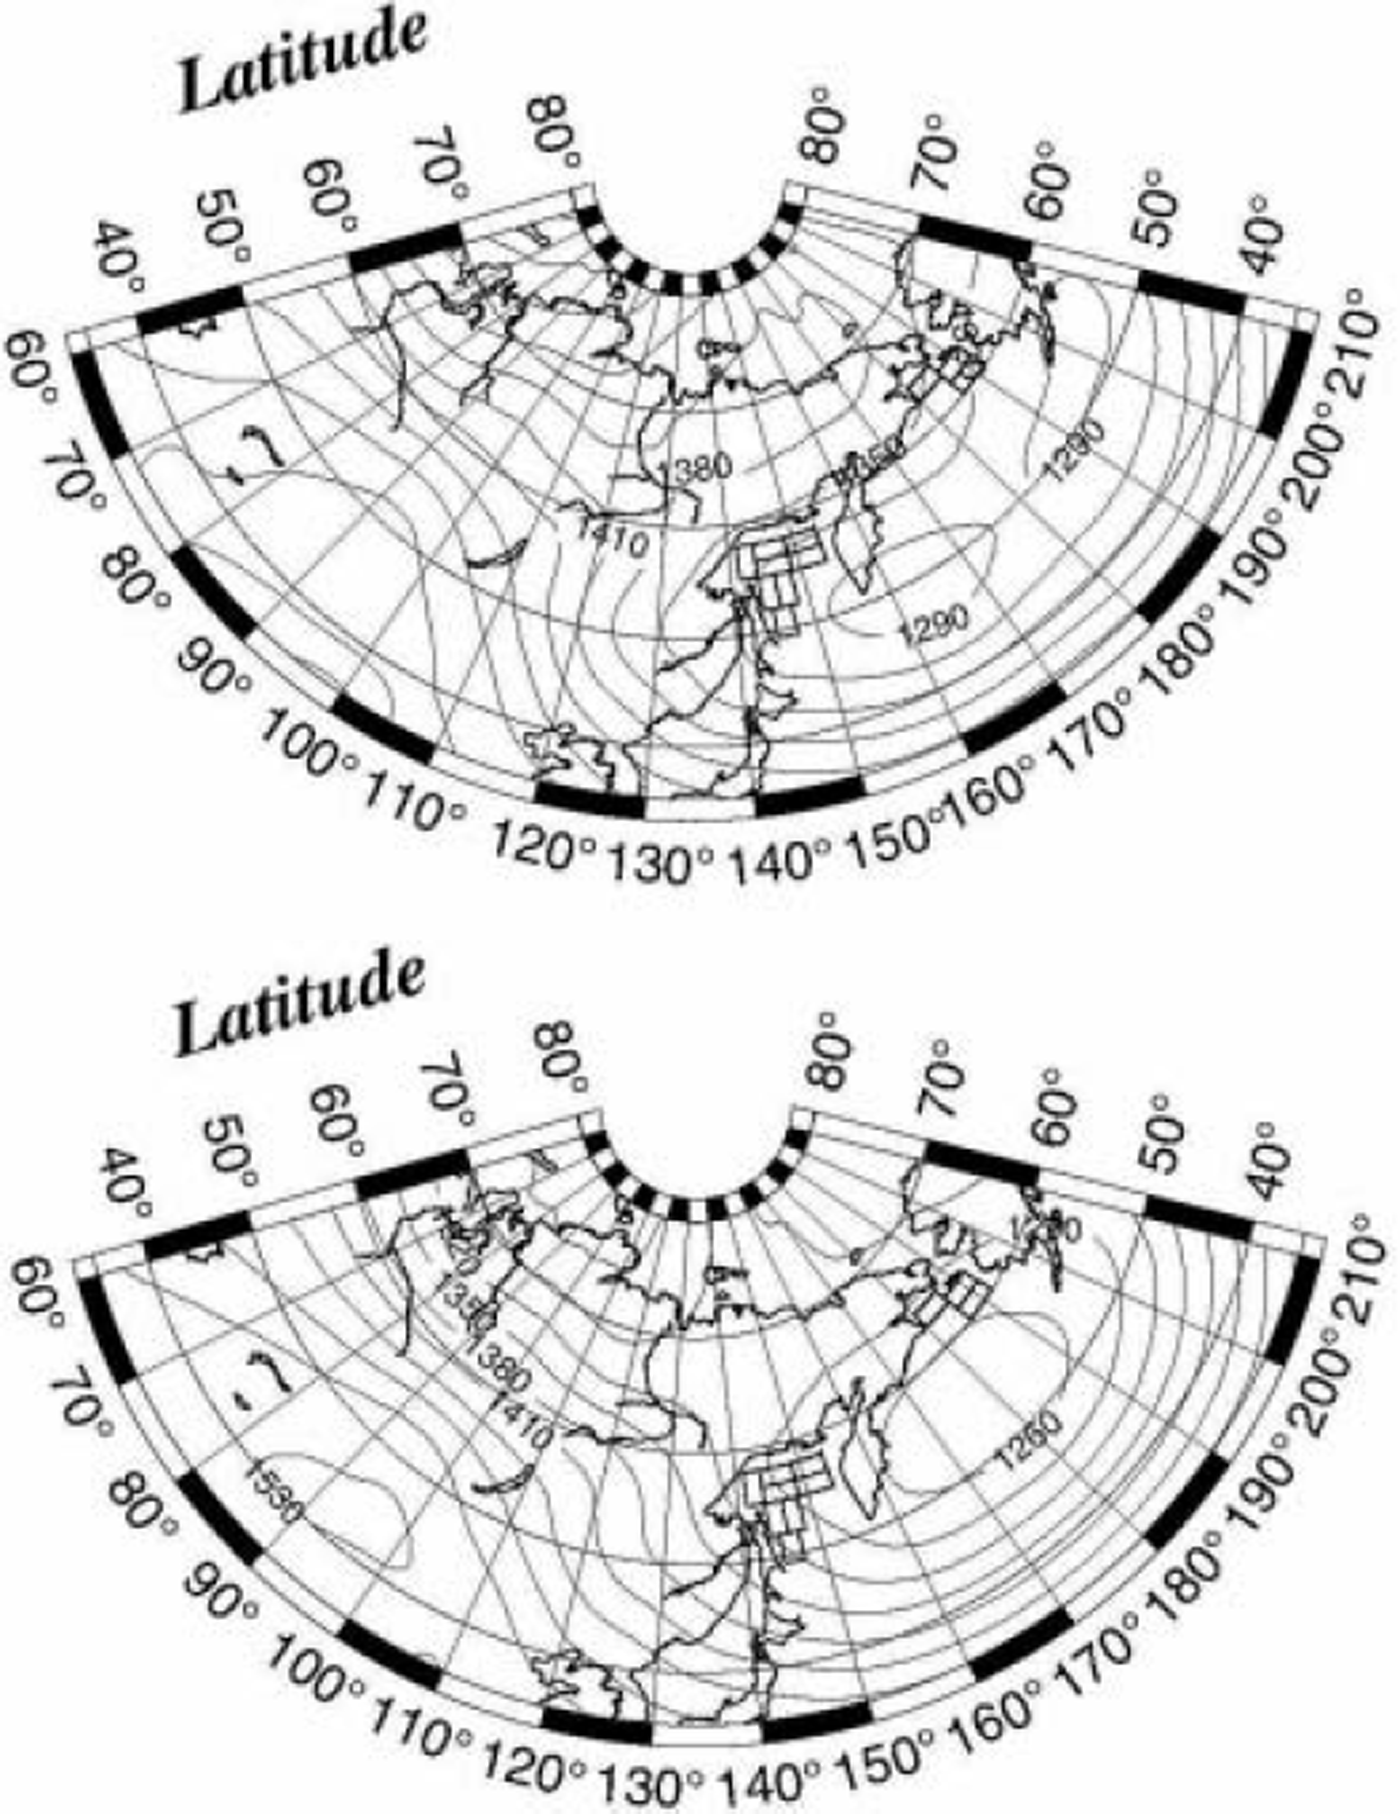
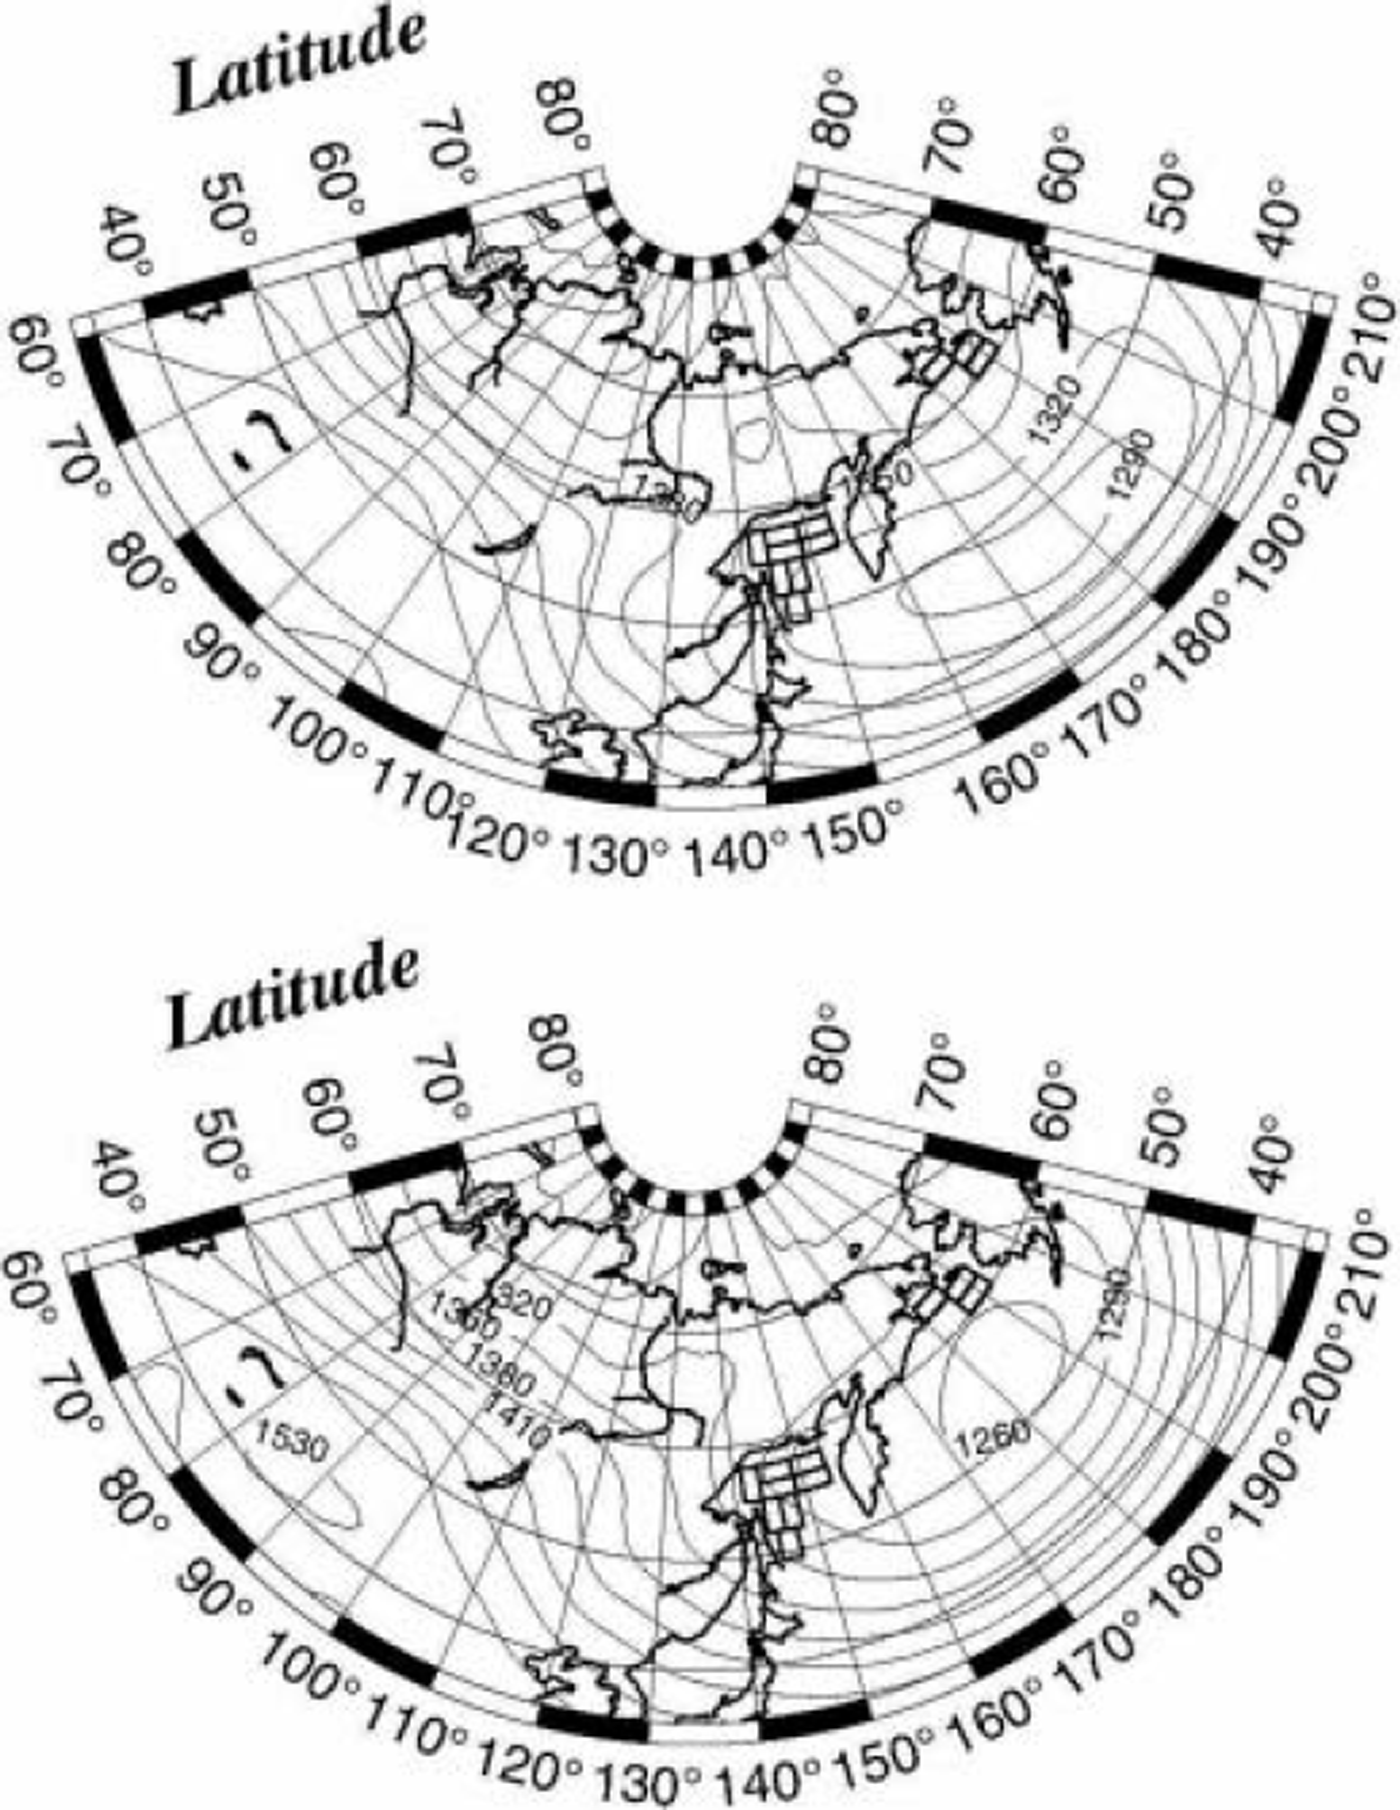
The above-mentioned contrast between wind fields in the decay and rapid-growth weeks is more clearly seen in the Z 850 fields. Figure 8 shows the Z 850 field for the decay week (upper panel) and for the rapid-growth week (lower panel) for Okhotsk region 1. In the decay week, the primary Aleutian low of moderate intensity is located near the Kamchatka Peninsula, and winds are easterly over region 1. In the rapid-growth week, the deep Aleutian low is located in the central part of the Bering Sea and winds are northerly over region 1. Figure 9 shows the Z 850 field for the decay week (upper panel) and for the rapid-growth week (lower panel) for Okhotsk region 3. Clearly, the central position of the Aleutian low is displaced northwestward as compared with Figure 8. In this case, warm easterly winds blow over region 3 in the decay week, and cold northeasterly winds blow in the rapid-growth week. The Z 850 fields for Okhotsk region 7 (Fig. 10) also indicate that warm easterly winds blow in the decay week and cold northwesterly winds blow in the rapid-growth week, though the Aleutian low is displaced eastward as compared with Figure 8.
Composite maps of Z 850 field for the cases of ice decay week (upper panel) and ice rapid-growth week (lower panel) for Okhotsk region 1. There are 19 decay weeks and 19 rapid-growth weeks. The contours are at intervals of 30 gpm (geopotential meters).
Composite maps of Z 850 field for the cases of ice decay week (upper panel) and ice rapid-growth week (lower panel) for Okhotsk region 3. There are 31 decay weeks and 25 rapid-growth weeks. The contours are at intervals of 30 gpm.
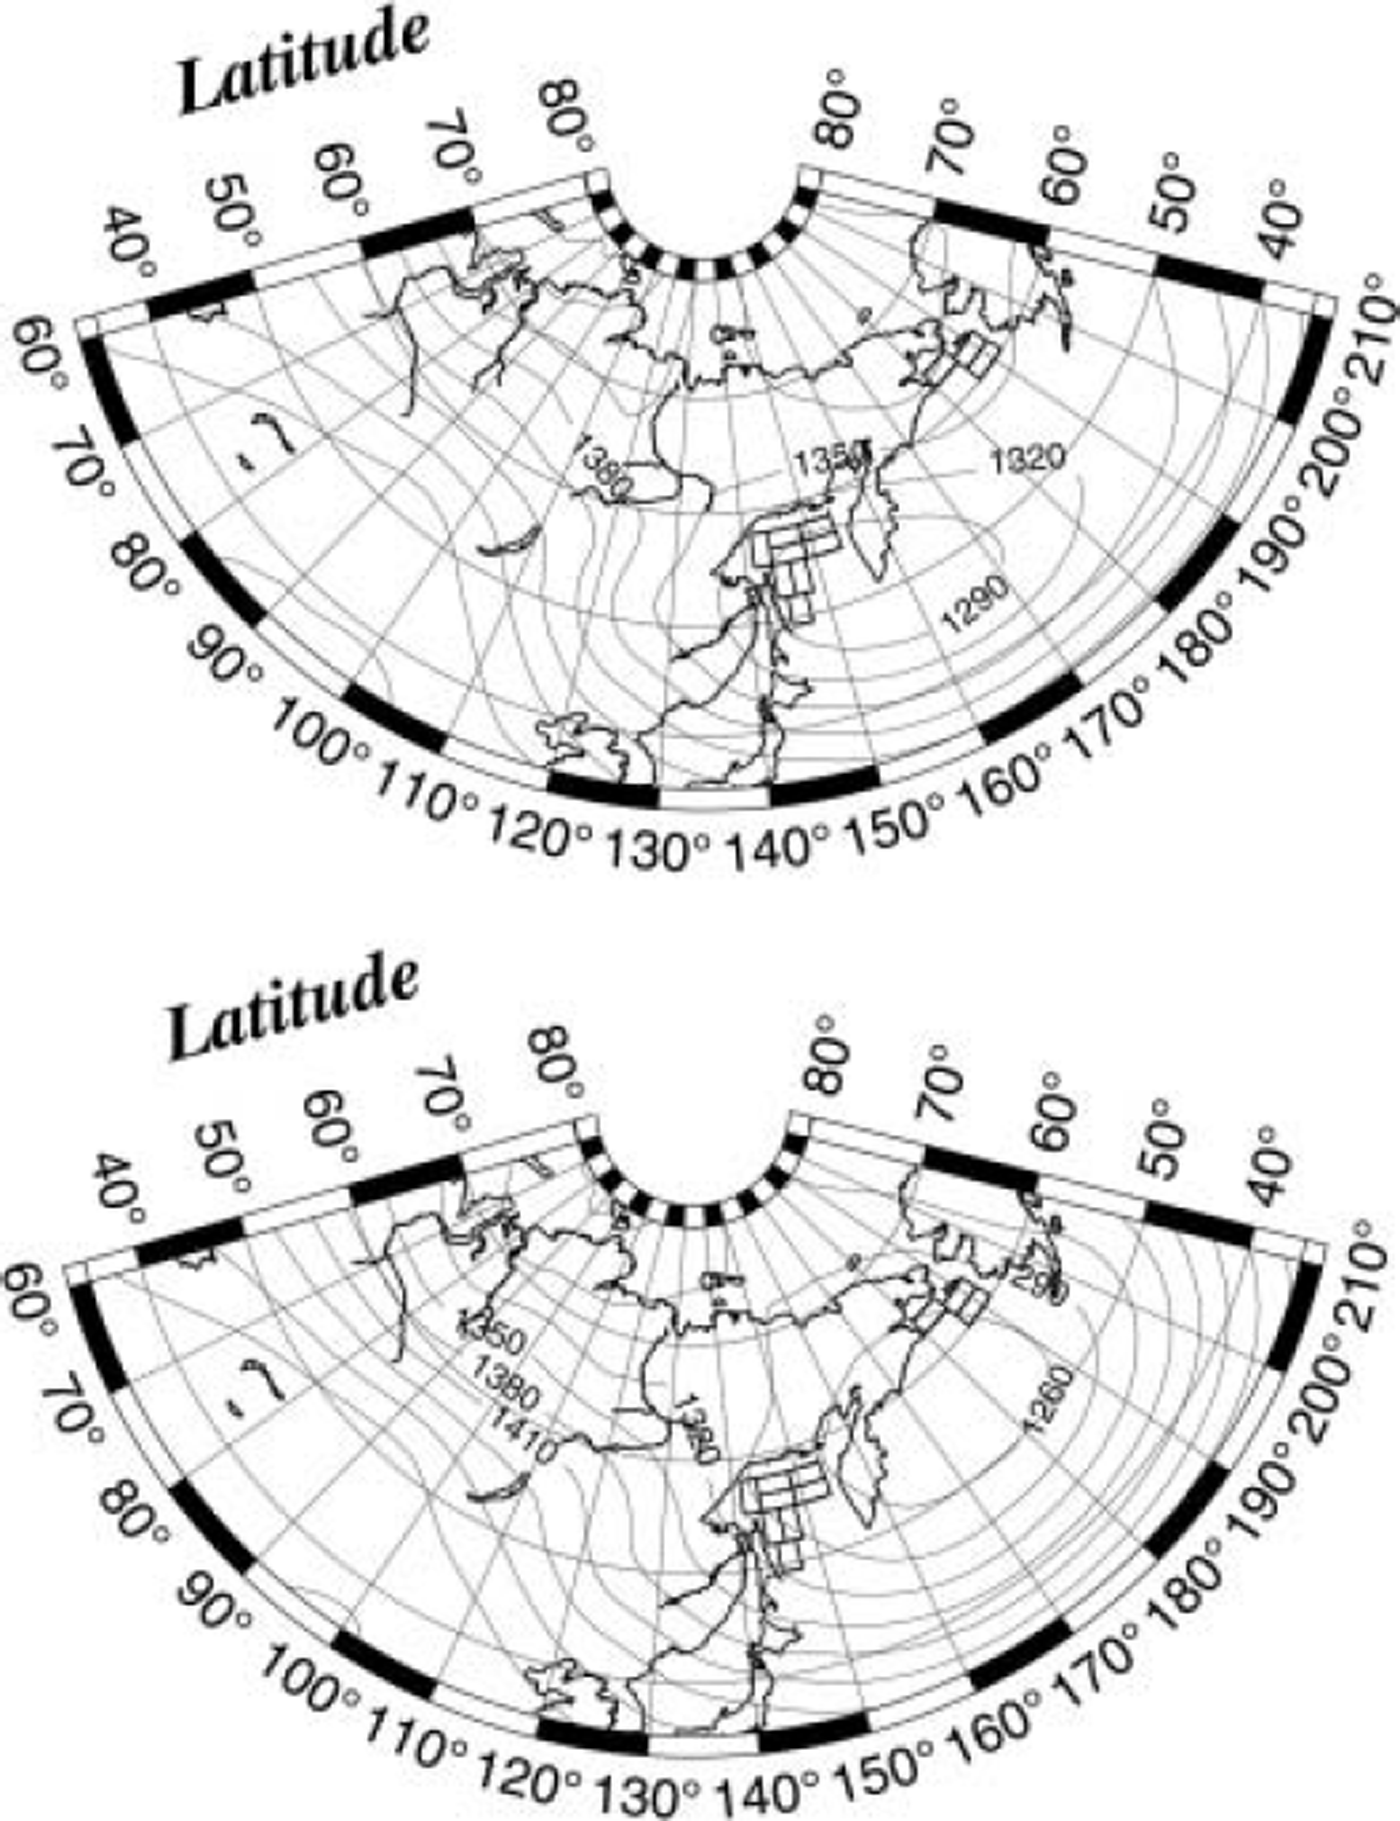
Composite maps of Z 850 field for the cases of ice decay week (upper panel) and ice rapid-growth week (lower panel) for Okhotsk region 7. There are 14 decay weeks and 24 rapid-growth weeks. The contours are at intervals of 30 gpm.
The same analysis is applied to all the other regions shown in Figure 5, and it is confirmed that the ice cover extends when cold northerly/northwesterly winds blow over the region, whereas the ice cover retreats when warm northeasterly/easterly winds blow. We conclude that the advance/retreat of the Sea of Okhotsk ice cover is largely determined by the atmospheric circulation, and that the atmospheric circulation is in turn controlled by the position and intensity of the Aleutian low.
Growth of Ice Cover in the Bering Sea and its Relation to that in the Sea of Okhotsk
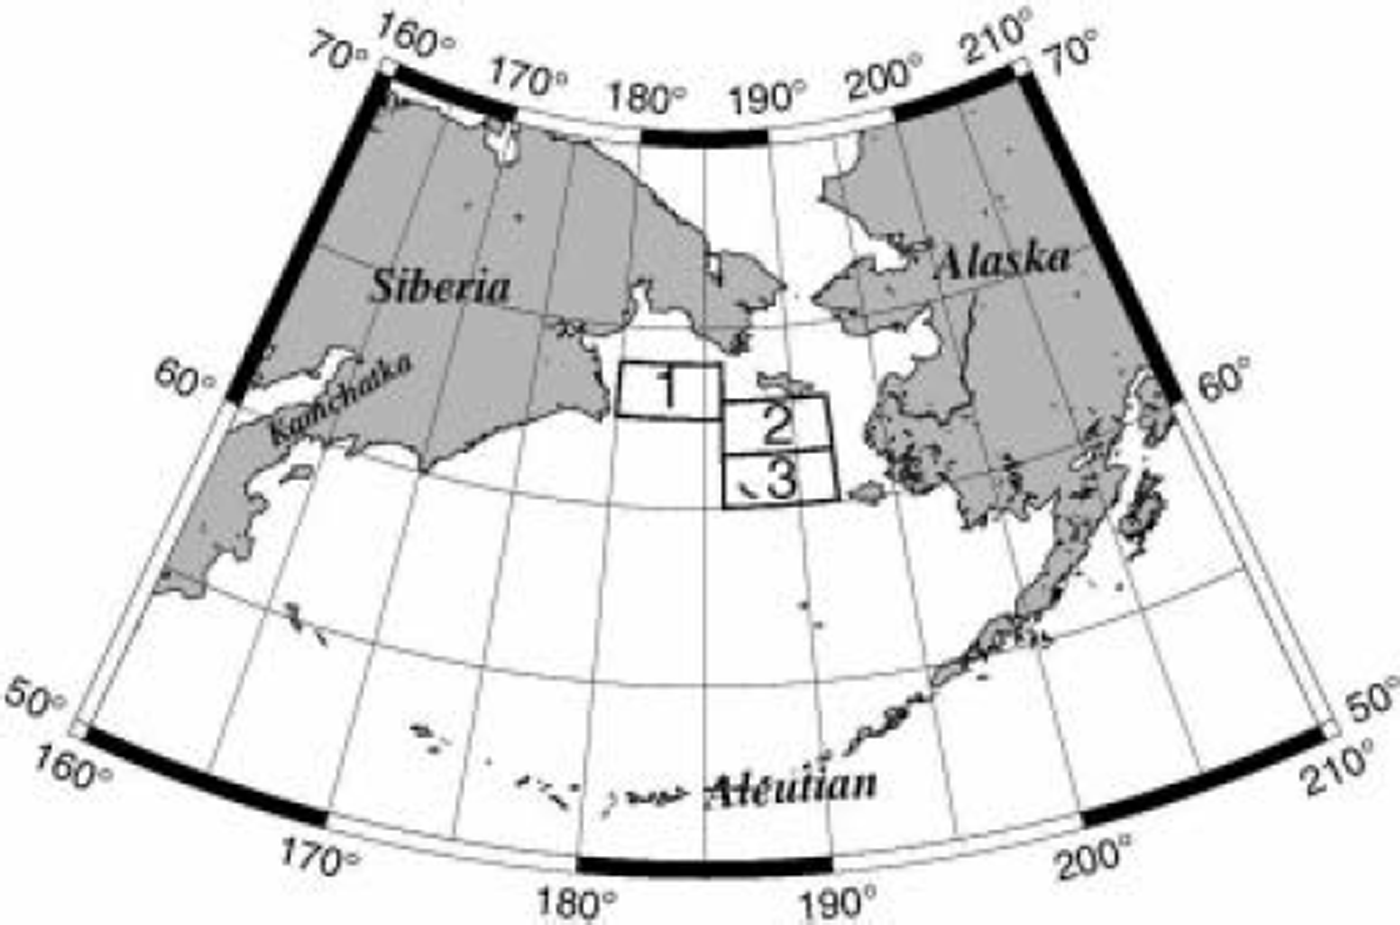
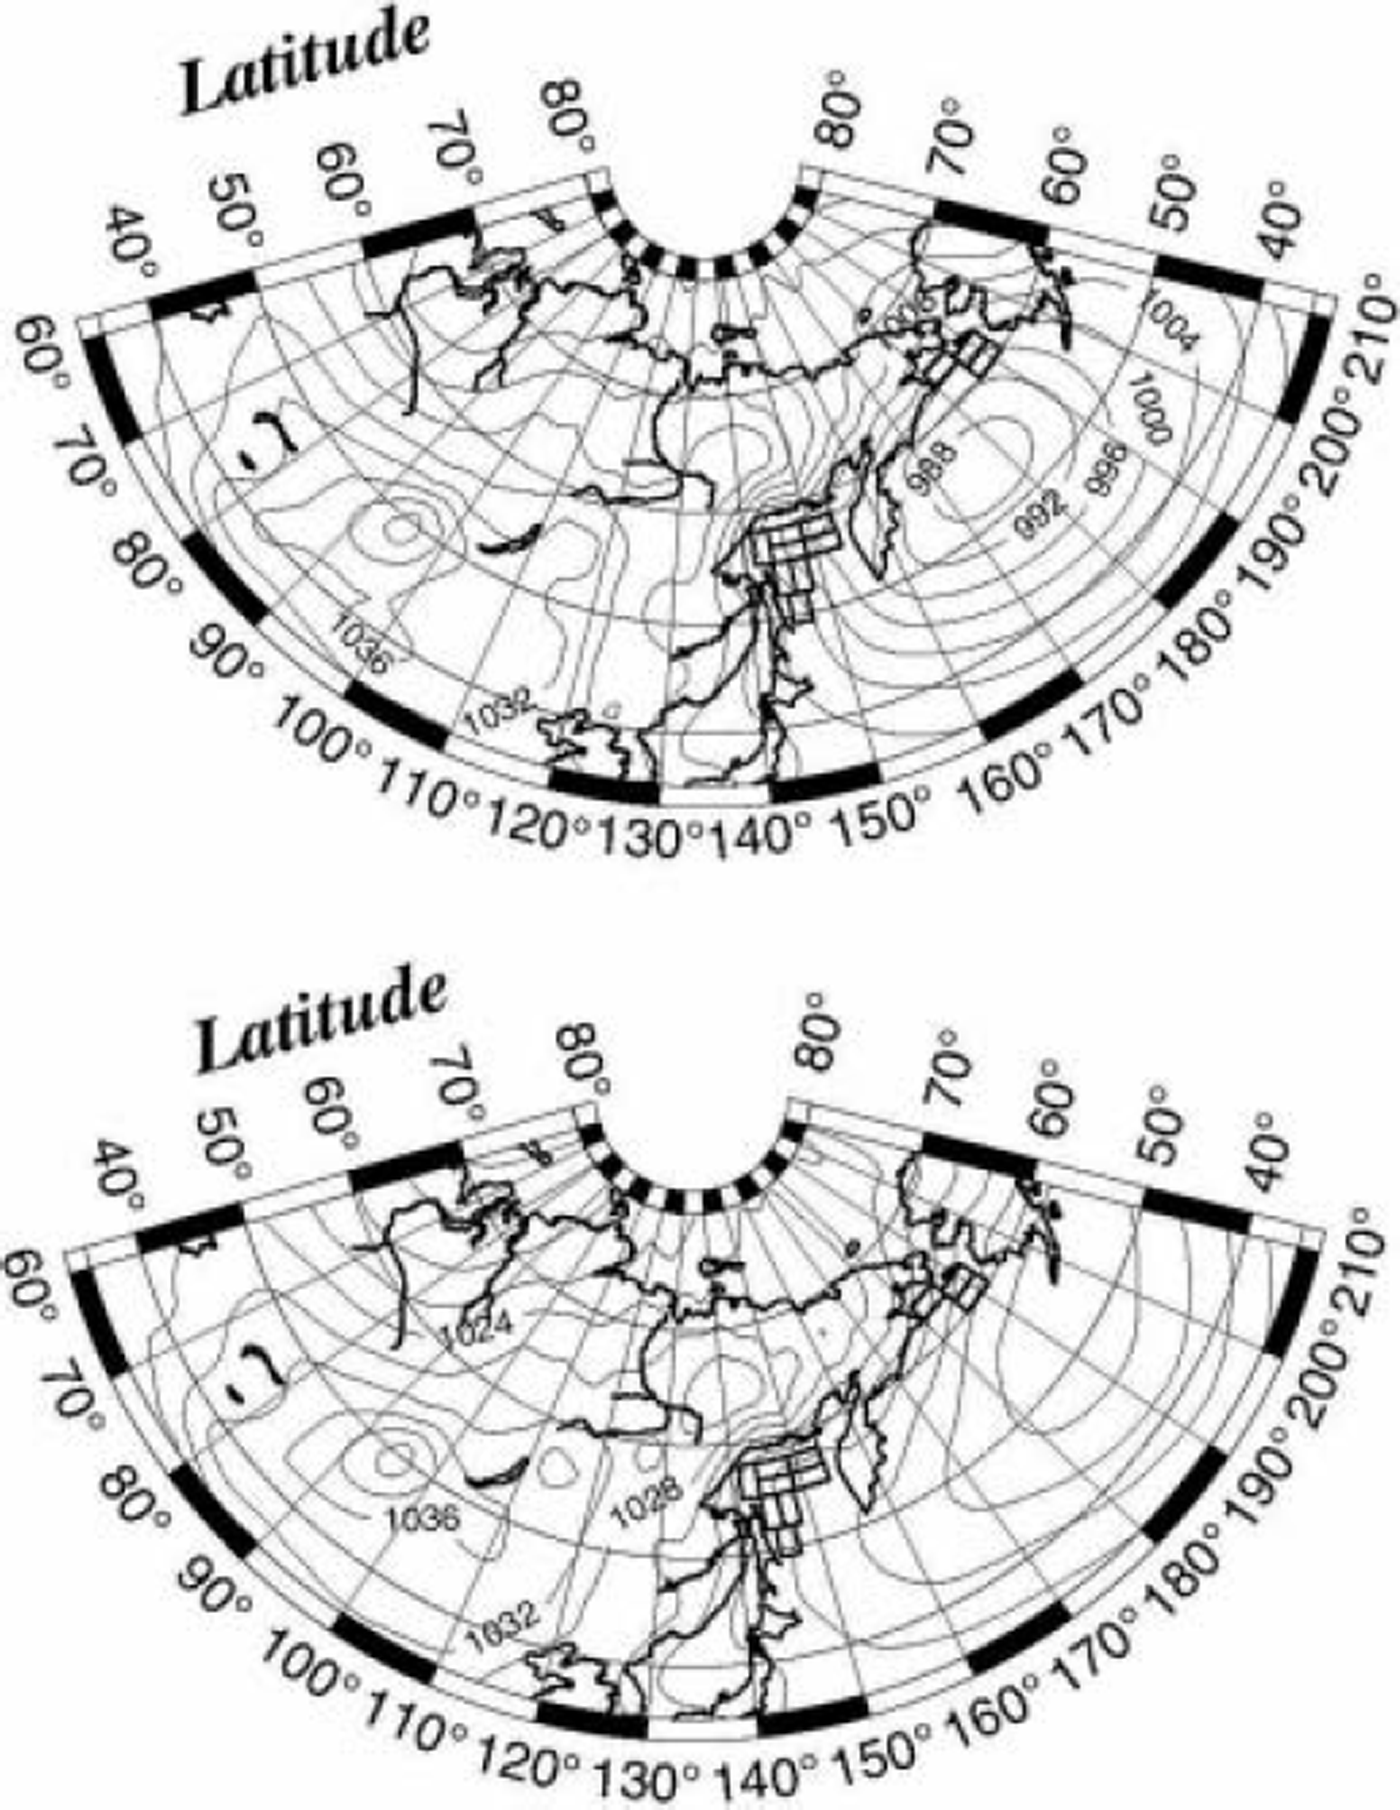
We now examine the role of atmospheric circulation in the growth/decay of sea-ice cover in the Bering Sea. We have selected three study regions, shown in Figure 11, by referring to the mean seasonal advance of ice extent in the Bering Sea (figure not presented). Note that, in this case, growth rates of ice extent are calculated for January–February because the Bering Sea is slower to freeze than the Sea of Okhotsk. Figure 12 shows the SLP field for the decay week (upper panel) and for the rapid-growth week (lower panel) for Bering region 2. Although the position and intensity of the Siberian high are almost the same, those of the Aleutian low show marked differences between the two composites: in the decay week, strong low pressures <988 hPa are observed in the mid-western part of the Bering Sea (around 55˚ N, 175˚ E) and strong, warm southeasterly winds blow over region 2. In the rapid-growth week, on the other hand, the core pressure of the Aleutian low is around 1000 hPa and its central position is displaced southeastward to induce cold northeasterly winds from the continent (Alaska). It is noted here that Reference AgnewAgnew (1993) reported that heavy sea-ice conditions in the Bering Sea were accompanied by weakening of the Aleutian low and the formation of a secondary low in the Gulf of Alaska.
Locations of three selected regions in the Bering Sea for which ice growth rates are calculated.
Composite maps of SLP field for the cases of ice decay week (upper panel) and ice rapid-growth week (lower panel) for Bering region 2. There are 13 decay weeks and 14 rapid-growth weeks. The contours are at intervals of 4hPa.
Similar conclusions are obtained for regions 1 and 3 (figures not presented). We conclude that the growth/decay of sea-ice cover in the Bering Sea is largely controlled by the position and intensity of the Aleutian low. Sea ice extends when a moderate Aleutian low is located near the Alaska Peninsula and induces cold northwesterly winds from the continent, whereas it retreats when a strong Aleutian low is located in the mid-western part of the Bering Sea and induces warm southeasterly winds from the northeast Pacific.
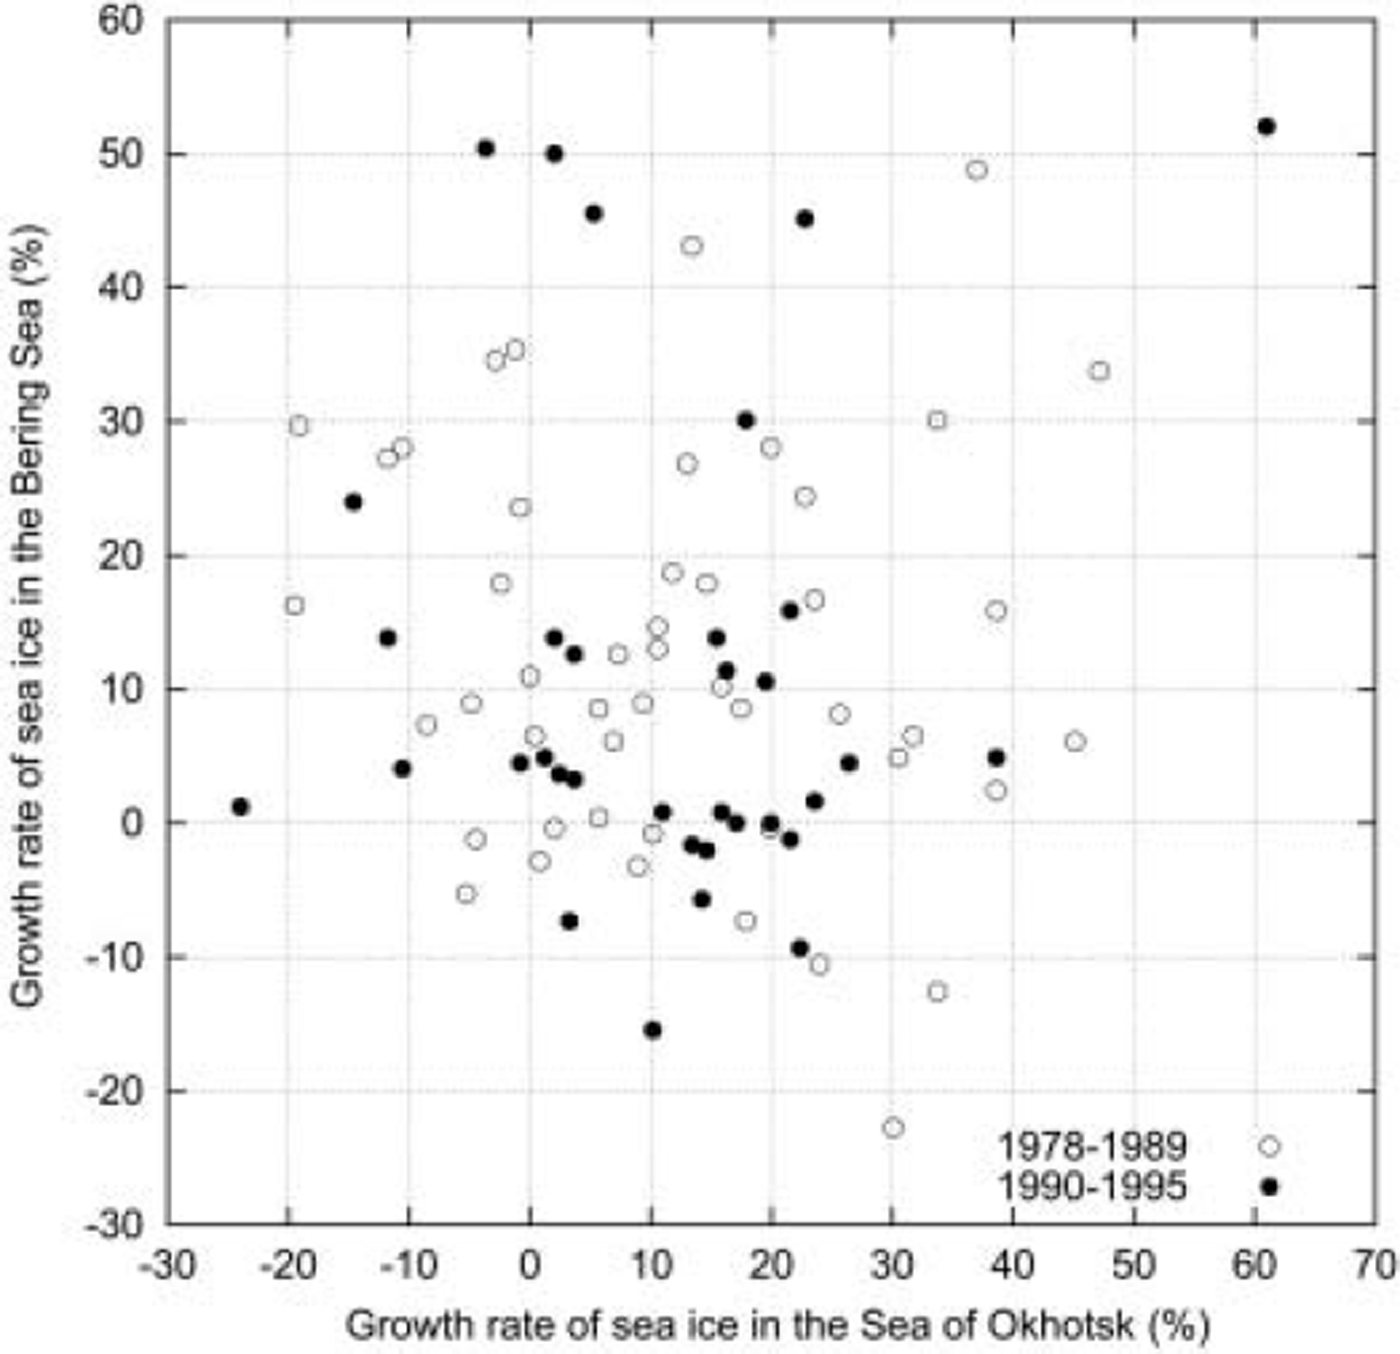
A characteristic feature of the Bering Sea ice cover is its occasional out-of-phase relation with the Sea of Okhotsk ice cover (Reference Cavalieri and ParkinsonCavalieri and Parkinson, 1987). A negative correlation can also be found between the decadal trends of sea-ice cover in the Bering Sea and the Sea of Okhotsk (Reference Parkinson, Cavalieri, Gloersen, Zwally and ComisoParkinson and others, 1999; Reference Rikiishi, Ohtake and KatagiriRikiishi and others, 2005). It is therefore interesting to examine statistically whether or not negative correlation is found in the weekly growth of ice cover between the Bering Sea and the Sea of Okhotsk. Figure 13 shows a scatter diagram of ice-cover growth rates during January and February for the Bering Sea vs the Sea of Okhotsk. Note that open circles denote growth rates for the years 1978–89 (for which the SLP data are available), and solid circles growth rates for the years 1990–95 (not available). Growth rates are generally confined within –20 to 50% for both the seas, and no overall correlation is found. We can see that more than half of the total cases indicate simultaneous sea-ice growth in both the seas, i.e. g O>0 and g B>0. At the same time, we see some cases in which ice cover grows (decays) in the Sea of Okhotsk, while it decays (grows) in the Bering Sea, i.e. g O>0 and g B<0, or g O<0 and g B>0. These cases may correspond to the occasional out-of-phase fluctuations in the sea-ice covers in the Bering Sea and the Sea of Okhotsk (Reference Cavalieri and ParkinsonCavalieri and Parkinson, 1987).
Scatter diagram of the weekly ice growth rates (%) in the Sea of Okhotsk vs those in the Bering Sea. Open circles are for the years 1978–89 for which simultaneous atmospheric observations are available, and solid circles are for the years 1990–95 for which simultaneous atmospheric observations are not available.
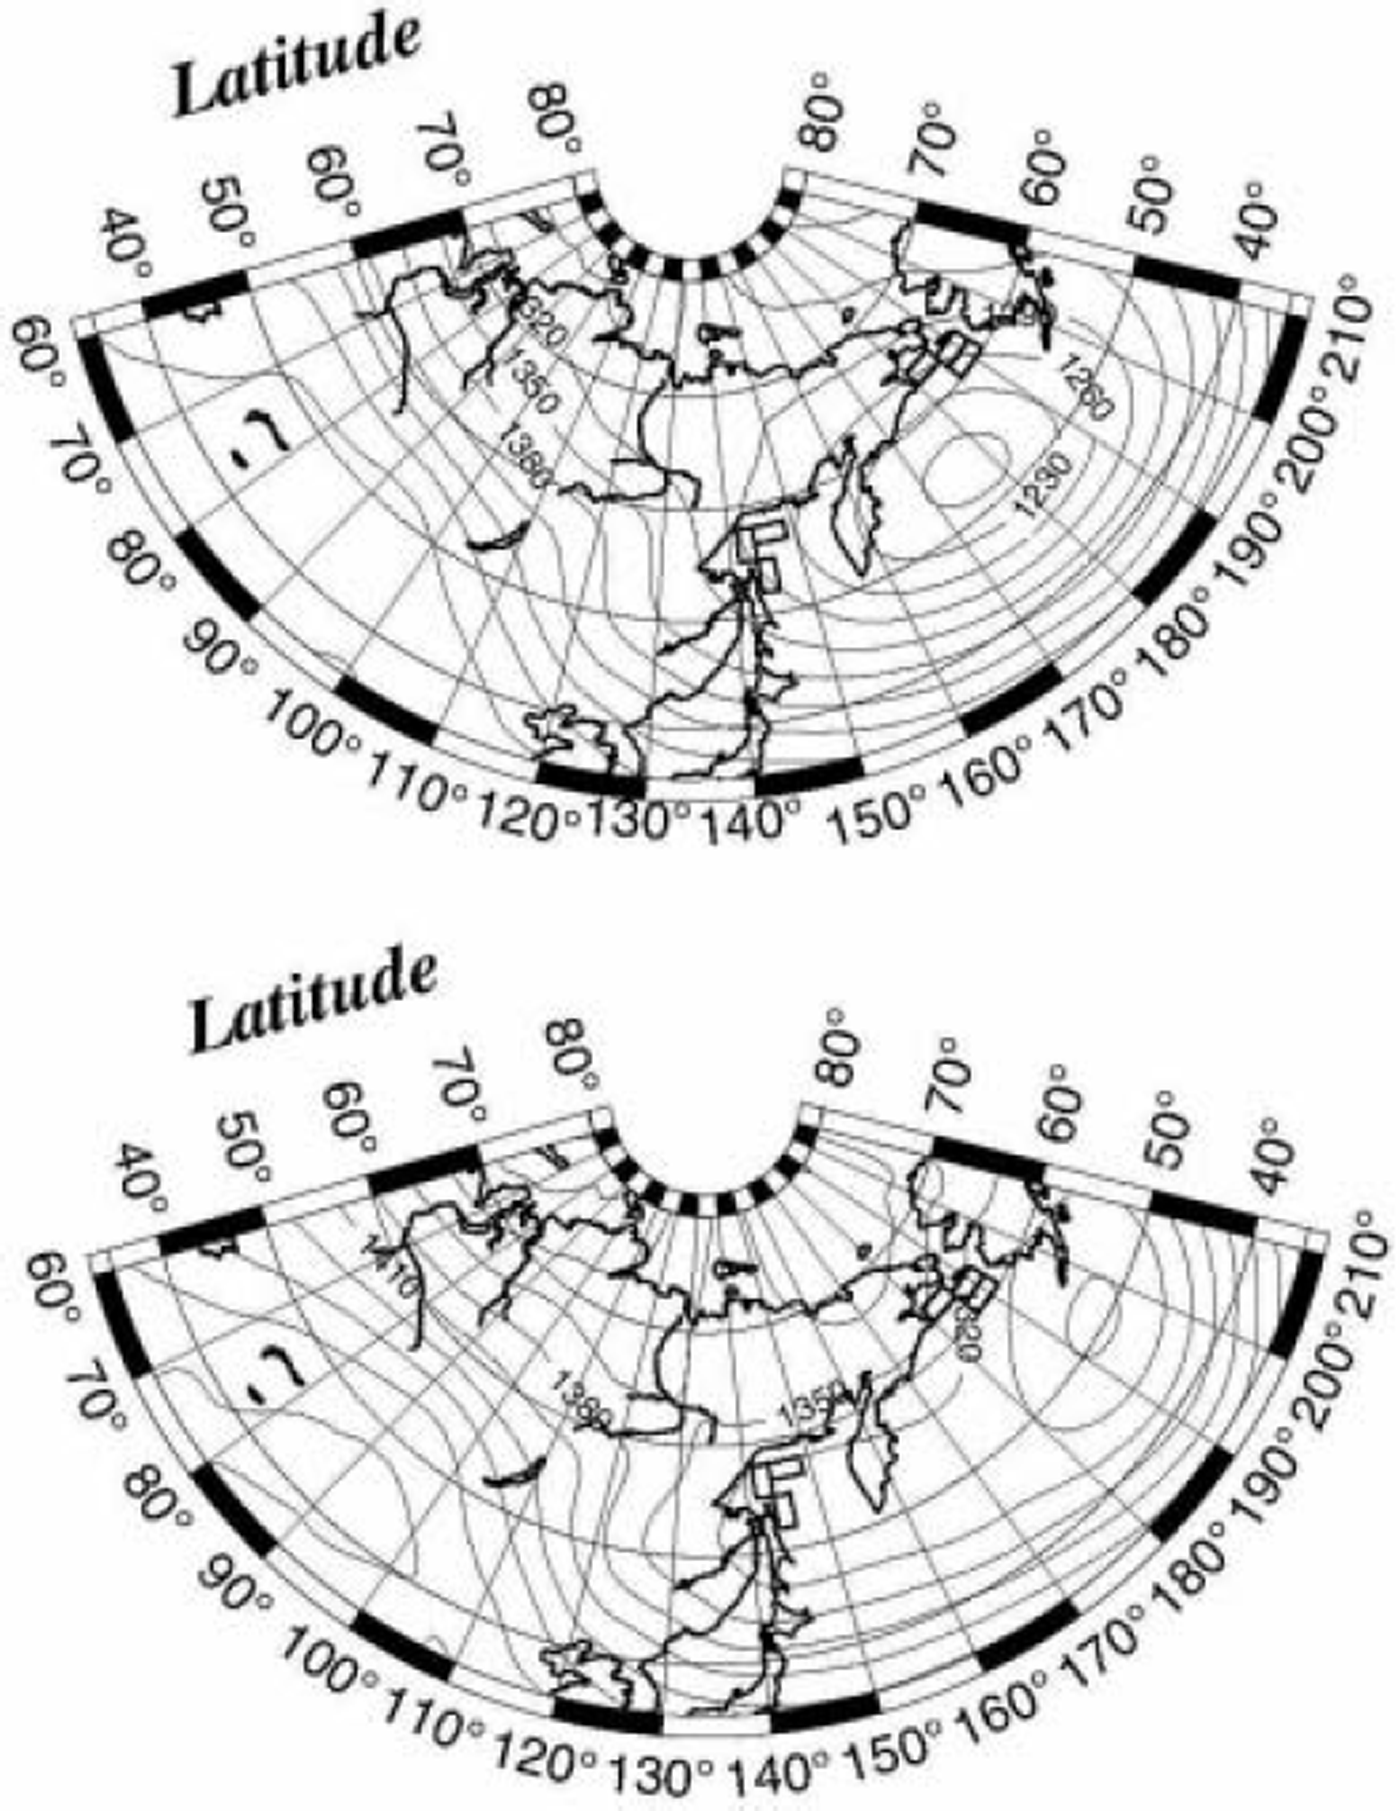
To see how the out-of-phase fluctuation is related to atmospheric circulation, composite maps of Z 850 fields are shown in Figure 14 for the cases of Sea of Okhotsk ice advance (g O>0) and Bering Sea ice retreat (g B<0) (upper panel) and for the cases of Sea of Okhotsk ice retreat (g O<0) and Bering Sea ice advance (g B>0) (lower panel). The upper panel shows that a strong Aleutian low is located in the midwestern part of the Bering Sea and induces cold northwesterly winds to the Okhotsk basin and warm southeasterly winds to the Bering Sea. By contrast, the lower panel shows that a somewhat weak Aleutian low is displaced eastward and induces cold northeasterly winds to the Bering Sea and warm northeasterly winds to the Okhotsk basin. These implications are quite consistent with our previous conclusion that the cold-air advection makes the ice cover advance while the warm air advection makes it retreat. Note that the pattern of the upper panel of Figure 14 is very similar to those of the lower panels in Figures 8–10, though the Aleutian low is stronger in Figure 14 than in Figures 8–10. The pattern of the lower panel in Figure 14 is also more or less similar to the patterns of the upper panels in Figures 8 and 10.
Composite maps of Z 850 field for the case of Sea of Okhotsk ice advance (g O>0) and Bering Sea ice retreat (g B<0) (upper panel) and for the case of Sea of Okhotsk ice retreat (g O<0) and Bering Sea ice advance (g B>0) (lower panel). The Sea of Okhotsk ice cover is represented by the sea-ice extents in regions 1, 3 and 6, and the Bering Sea ice cover by Bering regions 1–3. The number of data for these cases is 9 and 11 respectively. The contours are at intervals of 30 gpm.
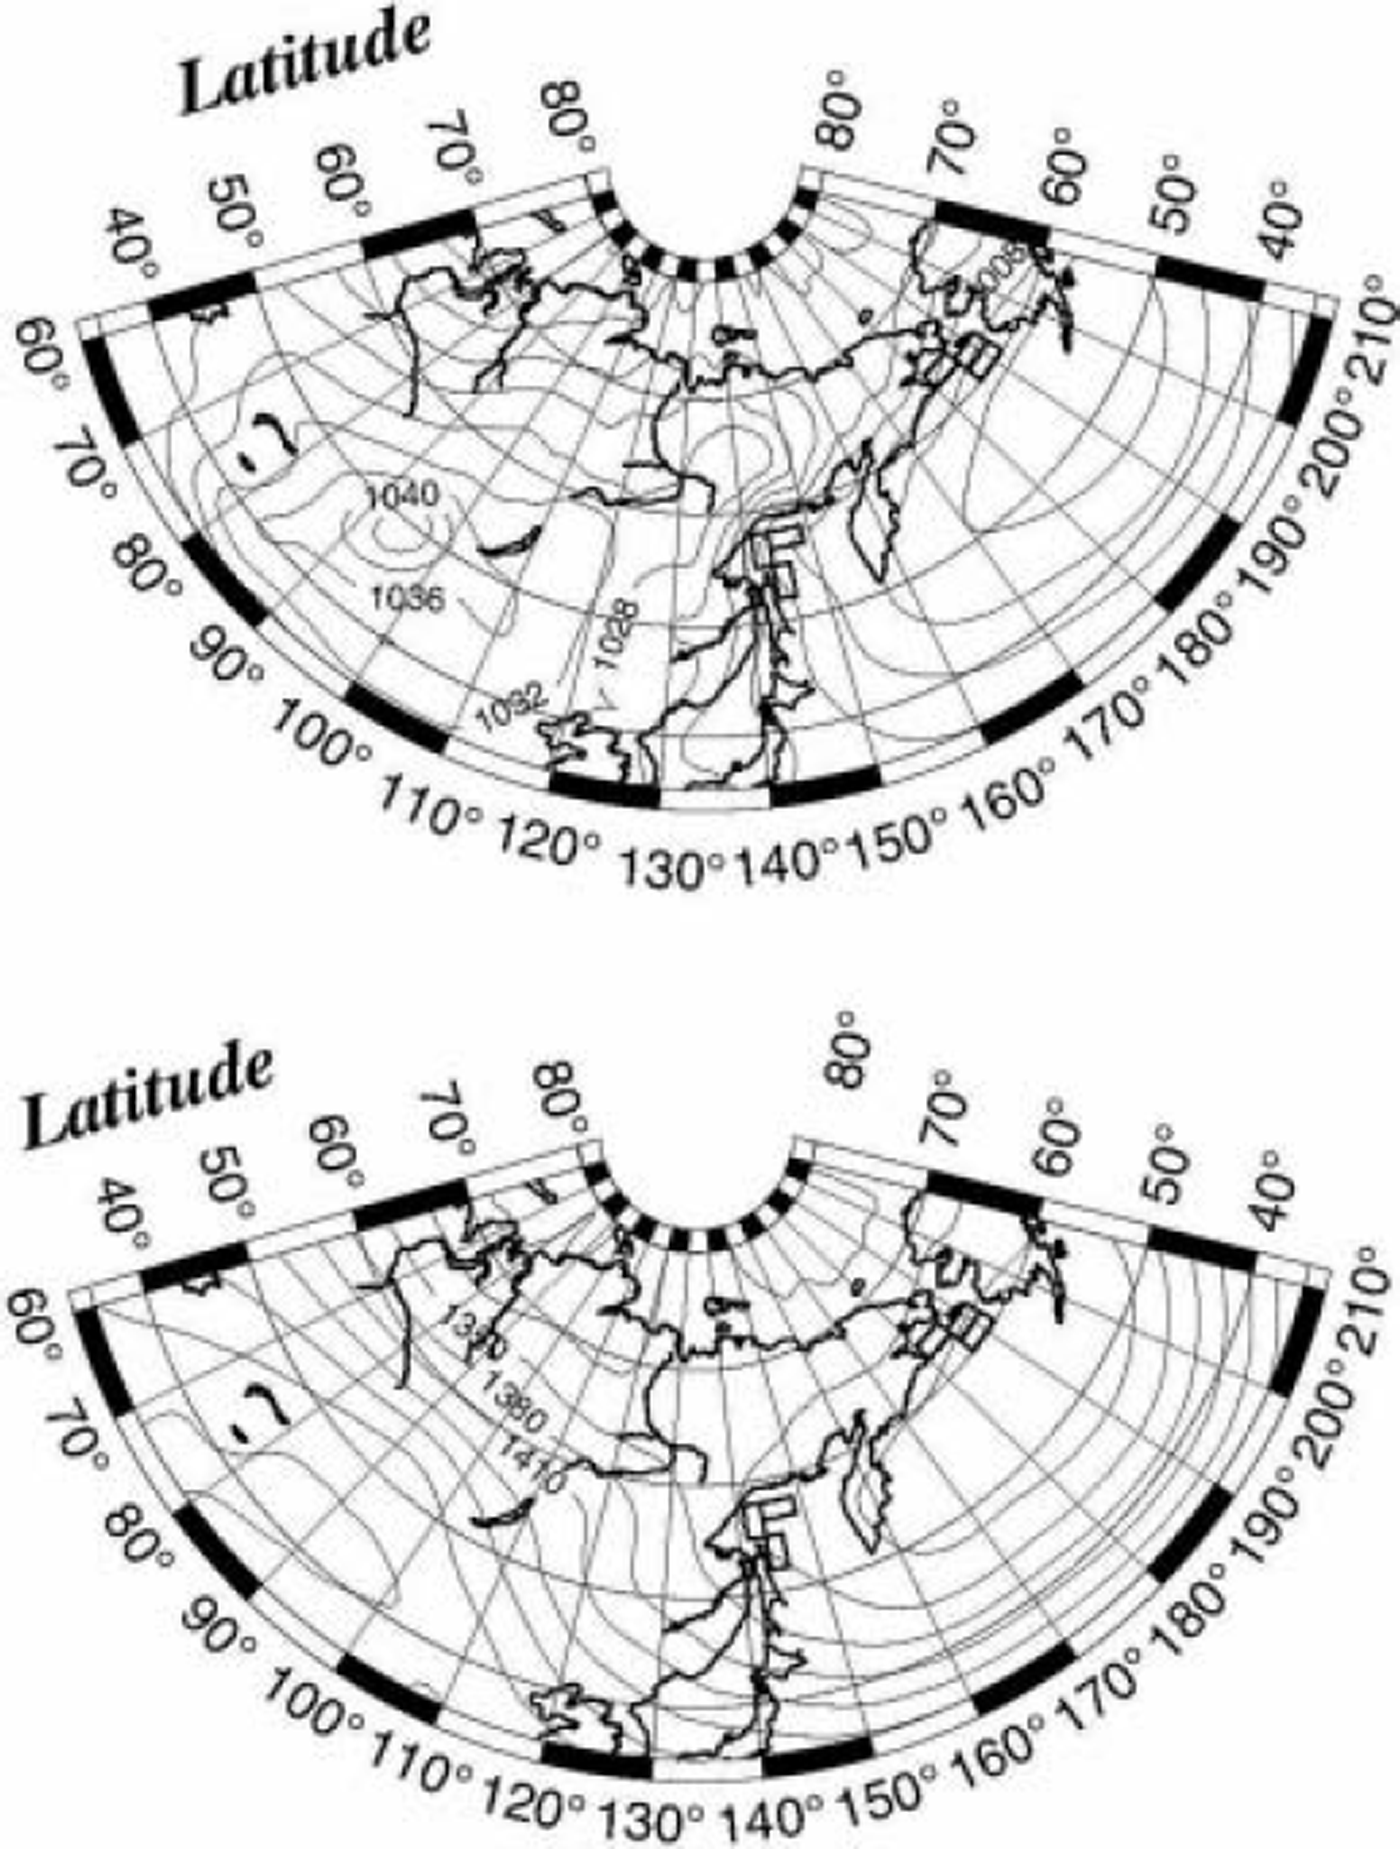
In Figure 15, we show the composite maps of SLP and Z 850 fields for the case of simultaneous ice-cover advance in both the seas (g O>0 and g B>0). In this case, a moderate Aleutian low occupies almost the whole area of the Bering Sea. Obviously, this pressure system brings cold airs from Alaska to the Bering Sea and from eastern Siberia to the Sea of Okhotsk. This is also consistent with our previous conclusion that ice cover advances by cold airflow over the sea surface. Since this case occurs most frequently (see Fig. 13), the pressure system shown in Figure 15 is responsible for the growth of sea-ice cover in the North Pacific as a whole.
Composite maps of SLP (upper panel) and Z 850 (lower panel) fields for the case of simultaneous ice-cover advance (g O>0 and g B>0) in both the Sea of Okhotsk and Bering Sea. The number of data for this case is 26. The contours are at intervals of 4 hPa for the SLP field and 30 gpm for the Z 850 field.
Discussion
Sea ice forms when sea-water temperature falls below the freezing point. Therefore, no one can dispute the prime importance of sea-water cooling in sea-ice formation. According to the bulk method of heat transport between the atmosphere and ocean (e.g. Reference Peixoto and OortPeixoto and Oort, 1992), sensible-heat transport from ocean to atmosphere is proportional to both the wind speed and air–sea temperature difference. As shown above, the airflow from the continent to the Sea of Okhotsk is associated with strong winds and cold air. Accordingly, airflow from the continent is cold and strong enough to cool the sea water. In fact, the results of our analysis suggest that cold-air advection from the land to the Sea of Okhotsk or the Bering Sea is responsible for the sea-ice growth there. Whether airflow brings cold or warm air is largely controlled by the position and intensity of the Aleutian low as discussed above. Recently, Reference Rikiishi, Ohtake and KatagiriRikiishi and others (2005) have demonstrated that this is also true for other marginal seas around the Arctic Ocean.
We recognize that sea-ice formation is one thing and ice-cover growth is another: while sea-ice formation is controlled by local atmospheric conditions, the growth of sea-ice cover is also controlled by geographical environment, because cold airflow responsible for sea-ice formation is gradually warmed with fetch, which is determined by both coastal configuration and meteorological condition. Winds from Siberia are much colder than the sea water, and air–sea temperature differences are very large at coastal regions, so ice cover forms very easily in the coastal regions. Once the ice cover is formed, it works as an insulator (though not perfect) between the atmosphere and ocean, and helps to freeze the open water near the ice-edge zone. Thus, the boundary between the ice-covered and ice-free areas advances in the downwind direction. Repeating these processes may extend the ice-cover area in the downwind direction as shown in Figure 1. The distance from the coast to the ice-edge zone may be controlled by air temperature in the coastal region and air-mass transformation along the fetch. We conclude that the fetch effect plays a very important role in the growth process of sea-ice cover.
In the meantime, sea-ice cover may possibly be expanded by ice drift by ocean currents and/or by strong winds. Indeed, sea-ice movements estimated by the maximum cross-correlation method (Enomoto and others, 2004) strongly suggest that sea-ice floes are drifted by ocean currents in the Arctic Ocean and some marginal seas. However, ocean currents do not generate new ice floes; they can only transport old ice floes from one region to another. Therefore, they cannot explain the fact that sea ice is thicker in coastal than in ice-edge regions. Moreover, the direction of ice extent is not consistent with the ocean current direction in many marginal seas. Reference Kimura and WakatsuchiKimura and Wakatsuchi (1999, Reference Kimura and Wakatsuchi2001) paid special attention to high correlations between sea-ice advances and geostrophic wind speeds, and concluded that ice growth was controlled by sea-ice drifts by geostrophic winds. However, the high correlations do not necessarily mean that ice drifts dominate the ice growth processes, because strong winds from the continent are usually very cold; they are able to freeze the sea water as well. We must distinguish the effect of atmospheric cooling from that of wind drift. Since wind drift can only transport ice floes from one region to another, it may not explain the regional differences in ice thickness. Also, mean wind fields are very weak over the Sea of Okhotsk in late March to May and cannot explain the ice-melting processes. However, the wind drift of sea ice, if any, may help the ice cover to grow through its thermodynamic effect. This is because drifted ice floes may reduce the heat flow from ocean to atmosphere, on the one hand, and may cool the surrounding air temperature when melted, on the other. Consequently, sea water around ice floes may be easy to freeze when cold air masses are advected from the continent.
Acknowledgements
We appreciate the kindness of the staff of the US National Snow and Ice Data Center, the US National Meteorological Center and the Japan Meteorological Agency in providing us with the invaluable datasets of sea-ice extent and atmospheric observations. We are indebted to A. Glazovskiy for his kind advice and suggestions as Scientific Editor, and to reviewers C. Dick and V. Alexandrov for their valuable comments.



