I. INTRODUCTION
Scanning probe microscopy (SPM) has proven valuable for measuring the nano- and microscale structure and properties of a wide range of materials. In particular, atomic force microscopy (AFM)Reference Binnig, Quate and Gerber1 is effective at imaging the topography of nonconducting specimens. A variety of configurations have been developed for simultaneously or sequentially imaging a wide variety of properties as well, including stiffness, adhesion, friction, electric fields, magnetic fields, surface potential, etc.Reference Bonnell2 When compared to other nondestructive techniques, AFM is also especially suited for imaging biological structures, including living cells, since it can be operated in liquid and hence in the native environment (or a reasonable approximation) of the specimen. Of course, AFM only probes the surface, so results are complementary to bulk or transmission-based measurements such as porosimetry, diffraction, micro-CT, TEM, etc. Even so, the underlying structure can reasonably be analyzed and related to these more traditional experimental techniques by performing AFM on cross-sections, including fracture surfaces.Reference Ulfig, Pangrle, Myers and Romero3,Reference Stevens, Loiola, Cubillas, da Silva, Terasaki and Anderson4
One area in which AFM is seldom used is highly porous materials, for several reasons as outlined below. First, the highly variable surface curvature means that the actual topography of many features cannot be accurately determined due to tip-shape convolution. Basically, pores that are significantly smaller than the tip cannot be resolved since it is geometrically impossible for the tip to track inside such small features. As a result, feature dimensions are always limited by the tip-sample contact area, which relates to the apex radius of curvature, tip aspect ratio, and applied load. Of course, mathematical deconvolution is feasible to partially address tip shape artifacts, typically based on either pre/post imaging of standards, or by implementing blind reconstructions. Regardless, optimal results of porous structures necessitate imaging with especially high aspect ratio AFM tips, typically with tip radii of <5 nm and aspect ratio of 1:10. Naturally, the cost of these probes continues to fall as their use becomes more widespread, but their premium is still sufficiently high as to often be a practical barrier.
Second, even with an optimally sharp AFM tip, undercuts and to some extent even edges of high aspect ratio structures cannot be detected. Again, novel AFM probes have been used to address this, e.g., hook-shaped tips for metrology of specific overhanging structures or steep walls.Reference Park, Chung and Byoung-Woon5–Reference Hua, Coggins and Park7 However, these are not generally applicable to arbitrary porosity or roughness, with which this paper is concerned.
Third, specialty probes are typically less robust than standard tips and hence can be prone to changes in tip-contact area during repeated, or even single, images. Accordingly, imaging porous and particulate surfaces typically necessitates scanning at rates that practically try the operator’s patience, as well as being susceptible to thermal drift and/or specimen degradation. One solution to combat this problem leverages recent advances made in our lab on high speed SPM,Reference Nath, Chu, Polomoff, Ramesh and Huey8–Reference Bosse11 enabling much more reasonable image acquisition times. Most such high speed studies are implemented either over small areas or for extremely flat specimens.Reference Ando, Kodera, Takai, Maruyama, Saito and Toda12–Reference Pyne, Marks, Picco, Dunton, Ulcinas, Barbour, Jones, Gimzewski and Miles14 Demonstrated here on the multiscale structure of dentin, a far rougher material, standard image times of tens of minutes are cut down to <10 s. The corresponding benefits, in identifying nanoscale and microscale roughness and especially surface areas, are reported with and without exposure to nanoparticles, as a loose approximation of brushing one’s teeth.
Naturally, there have been several previous AFM-based studies of teeth.Reference Bertassoni, Habelitz, Pugach, Soares, Marshall and Marshall15–Reference Silikas, Watts, England and Jandt17 One persistent challenge is that human dentin is a vital, hydrated, and porous tissue that contains a high fraction of water and organic matter, and hence is very sensitive to dehydration. For example, the structure of human molar dentin was compared by many groups using both AFM and SEM.Reference Kubinek, Zapletalova, Vujtek, Novotny, Kolarova, Chmelickova and Perina18,Reference Zapletalova, Kubinek, Vujtek and Novotny19 Specifically, samples were stored in distilled water and imaged with AFM under moist conditions, whereas for SEM, the specimens had to be gradually dehydrated in a graded acetone series, coated in a sputtering device, and then imaged. This process resulted in significant artifacts caused by shrinkage and the desiccation procedure. Since the ultrastructure and properties of dentin are used as the basis for many approaches in restorative dentistry,Reference Sharma, Cross, Hsueh, Wali, Stieg and Gimzewski20 characterization of dentin in its physiological environment is obviously crucial. Many clinical dental procedures, and most personal oral hygiene, are also performed when the teeth are hydrated, such that the practical outcome of these dental practices benefits from correspondingly hydrated experimental conditions.Reference Mello, Arvanitidou, Stranick, Santana, Kutes and Huey21 Performing AFM in a fluid chamber, flooded with appropriate solutions to mimic the conditions in a human mouth, thereby allows relevant investigations of the preparation for, and outcome of, restorative dental treatments, also as reported below.
II. EXPERIMENTAL
A. Tooth substrate preparation
For this study, 10 different tooth cross-sections (5 plain and 5 brushed) were characterized following procedures outlined elsewhere.Reference Mello, Arvanitidou, Stranick, Santana, Kutes and Huey21 Eight hundred micrometer-thick slices of dentin were cut horizontally from the crown section of human molars, slightly below the enamel–dentin junction, using a water-cooled diamond-coated saw. To create a uniform surface, the dentin slices were then polished on one side using 600 grit wet paper on a polishing wheel. The specimens were further polished for approximately 30 s until shiny, using a polishing cloth (Microcloth®, Buehler, Lake Bluff, IL), wetted with a 5 μm alumina slurry. After inspection in an optical microscope, the polished dentin slices were then placed in a beaker of deionized water and sonicated for 10 min to remove the polishing abrasive, followed by rinsing with water. Next, the specimens were etched in a Petri dish with a 1% citric acid solution to remove polishing damage and/or debris; otherwise, tubules and collagen are typically obscured by a polishing induced “smear layer.” Twenty seconds of mild back and forth agitation was sufficient to open the tubules. After acid-etching, the dentin slices were again rinsed with deionized water, with a final sonication step for 10 min in deionized water. These prepared specimens were ultimately stored in a phosphate buffer saline solution (PBS, pH = 7).Reference Petrou, Heu, Stranick, Lavender, Zaidel, Cummins, Sullivan, Hsueh and Gimzewski16 Finally, certain specimens were further exposed to a commercial toothpaste incorporating TiO2 nanoparticles to approximate personal dental care, involving <2 min of gentle scrubbing with a toothbrush and nanoparticles followed by a rinsing step to remove poorly adhering particles. All specimens were mounted for AFM imaging on a coverslip with cyanoacrylate. This coverslip, and the complete AFM probe, remained submerged in a fluid chamber with approximately 1 mL of deionized water for all in vitro experiments.
B. AFM imaging
An Asylum Research MFP-3D AFM with integrated inverted optics (Nikon TE-2000, Melville, NY) was used for imaging the dentin samples. For AC mode imaging of dentin discs in air, Al reflex coated Si cantilevers were used (Olympus AC240TS, Santa Barbara, CA). These 240-μm long rectangular cantilevers have a typical spring constant of 2 N/m, 70 kHz resonance frequency, and Si tetrahedral tips with approximately 10 nm radii. Most air images were acquired in ∼17 to 43 min based on 0.25 or even 0.1 Hz line rates for the largest areas considered (all images are based on 256 × 256 pixels).
Most fluid imaging implemented “iDrive,” a specialized AFM option designed for high resolution liquid imaging of fragile specimens.22–Reference George, Donose and Cooper-White24 This hardware incorporates a permanent magnet near the tip holder, and especially microfabricated probes where an oscillating current can be applied perpendicular to the magnetic field. As a result, Lorentz forces exclusively actuate normal oscillations of the cantilever electromagnetically. By comparison, standard AC imaging requires vibration of the lever via a comparatively enormous piezoactuator to which the probe is clamped. In fluids, the electromagnetic excitation of the probe alone thereby substantially minimizes acoustic energy transfer to the specimen as compared to piezoelectrically driven AC AFM. The specific probes used in this study were AR-iDrive-N01 BL-TR400PB. These are 100-μm long, triangular-shaped silicon nitride cantilevers, with approximately 0.09 N/m spring constants, ∼30 kHz resonant frequencies in air, and ∼10 kHz resonances in fluid. Typical liquid scanning speeds were similar to air-imaging conditions, on the order of one image per 17 min (0.25 Hz line rates) or worse.
Generally, although dentin samples are not as fragile as many other biological specimens, they are nevertheless challenging to image due to the extraordinary changes in surface height and high aspect ratios of the tubules, in combination with nanoscale structuring on the dentin surfaces. Therefore, resolving both typically requires relatively slow scanning, in liquid or even in air as described above. Considering recent advances in high speed SPM, however, the dentin samples provide an ideal test case for demonstrating high speed AC imaging in liquid.
The high speed in vitro AC imaging was performed with the same iDrive probes. However, they were acoustically instead of electromagnetically driven, using external electronics to excite and detect much higher frequency resonances than normal (MHz instead of kHz).Reference Huey9 At the highest speeds considered, 40 Hz line rates, equivalent image acquisition required just 6.4 s, a 160-fold improvement over the normal in vitro settings.
III. RESULTS AND DISCUSSION
A. Plain dentin
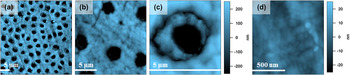
AFM on bare dentin surfaces was first carried out in air. Figure 1 presents representative topography images with progressively higher magnification, with lateral dimensions spanning (a) 40 μm, (b) 15 μm, (c) 5 μm, and (d) 1 μm. The bright to dark contrast is ±250 nm for all panels except (d), which instead is displayed with ±25 nm (10x magnifications) to best depict the ultrastructure commonly found on the dentin surface between the pores. Dentinal tubules averaging 4 μm in diameter are apparent in Figs. 1(a)–1(c) as anticipated. Much smaller collagen fibers oriented randomly within the dentin are also apparent, especially in Fig. 1(d); their repeat units are on the order of 60–70 nm as expected.Reference Picco, Bozec, Ulcinas, Engledew, Antognozzi, Horton and Miles25,Reference Wallace, Chen, Fang, Erickson, Orr and Banaszak Holl26 Note that all samples are from distinct molars cross-sectioned at varying tooth locations, and hence feature sizes, periodicities, and relative ratios of collagen within the dentin vary from sample to sample.
In air AFM topography images of plain dentin at length scales of (a) 40 × 40 μm (1600 μm2), (b) 15 × 15 μm (225 μm2), (c) 5 × 5 μm (25 μm2), and (d) 1 × 1 μm (1 μm2), with a z-contrast of ±250 nm (a–c) and ±25 nm (d).

B. Brushed dentin
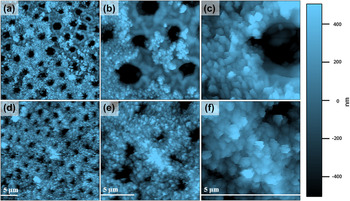
To loosely approximate personal dental care, several dentin specimens were also “brushed” with nanoparticles and then rinsed. Many particles decorate the dentin surface as a result, drastically altering the surface morphology. Figure 2 displays common results, with two rows of topography images for partially (top) and nearly completely (base) coated regions of a single tooth over length scales of (a, d) 40 μm, (b, e) 15 μm, and (c, f) 5 μm. The particles, approximately 50–250 nm in size, are significantly smaller than the diameter of the tubules (4 μm). Nevertheless, they aggregate and coat the surface, in some cases (bottom row) even masking or at least impinging on the underlying tubules, narrowing their exposed diameter.
AFM topography images in air of dentin brushed with nanoparticles at length scales of (a, d) 40 μm, (b, e) 15 μm, and (c, f) 5 μm revealing partial (top row) and nearly complete (base) particle coatings obscuring the underlying dentin and tubules. A common topography scale for all images is included at right, ±500 nm from dark to light; 5 μm scale bars are shown in each image frame.

1. Imaging of porous particulate structures
In general terms of the characterization of highly porous particulate structures by AFM, it is noteworthy that the particles here are reasonably adherent to the dentin surface as evidenced by relatively little particle repositioning or removal in consecutive images.Reference Kutes27 However, some image degradation is apparent for the last images acquired, those at highest magnification (c, e). This is because there is an ever-increasing likelihood of particles becoming attached to the AFM tip apex as imaging progresses. Even with high aspect ratio probes, this is always a possibility when imaging loosely bound particles with AFM presumably improved upon in actual dental care due to various binders present in oral hygiene products, proteins, and other organics present on the surface of teeth, etc.
2. Surface morphology
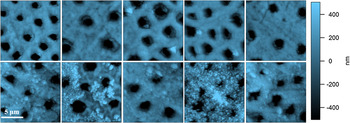
Tooth specimens, especially after brushing with nanoparticles, present an excellent example of the challenges faced in AFM-based measurements of porous materials. This is exemplified in Fig. 3, which displays 15 × 15 μm images of distinct regions on various teeth for plain dentin (top row) and brushed samples (bottom row). The first issue is that significant variability is obviously apparent from one image to another, particularly for the brushed cases. Of course, this is as expected for a technique like AFM, which samples only a small surface area. Obviously, multiple samples and images at distinct locations are therefore necessary to confidently survey the morphology of most porous specimens.
Distinct locations on plain dentin (top row), and nanoparticle-exposed dentin due to brushing (bottom row), reveal a range of surface microstructures. All images are 15 × 15 μm with ±500 nm topographic contrast.

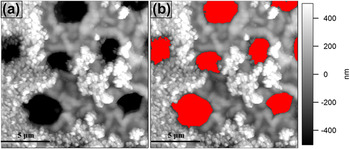
Even more problematic, however, is that there can be multiple length scales of porosity and roughness, for instance, the micron scale pores in the dentin as compared to the nanoscale particles decorating (at least some of) the surrounding surface. The most common solution to this issue is to use image processing routines (Igor Pro, ImageJ, Matlab, etc.) to mask specific morphologies to isolate one type of structure from another for further analysis. Conveniently, the masks to isolate the tubules from the surrounding dentin are easily determined based on height thresholds. Figure 4 exemplifies this process, isolating the tubules for their distinct consideration, or alternatively to investigate the remaining (unmasked) parts of the image.
(a) Full versus (b) masked versions of a 15 μm brushed dentin image with the tubules identified for isolated image analysis of either the nanostructuring or the microscale pores.

3. Roughness and surface area analysis
Calculations of distinct particle sizes and distributions are sometimes possible with topographic data,Reference Palumbo, Kovalskiy, Jain and Huey28 though this is typically limited to circumstances where discrete particles are found on an otherwise flat surface. For highly porous structures, histograms of the measured heights, or more simply the rms roughness (Rrms), are commonly reported instead. However, Rrms indicates the root mean square difference of all pixel heights compared to the average surface height, which again can be misleading with porous structures.
Surface area measurements, on the other hand, are strongly affected by porosity and roughness, and therefore are an excellent indicator in such circumstances. To best quantify this parameter for multiple measurements, the increase in area beyond a perfectly flat surface is particularly relevant. This is determined with the standard quad triangle method, implemented here by Igor Pro software. For comparative purposes, such data is typically reported normalized by the actual image area considered, thus accounting for distinct images having different overall dimensions, practical areas after appropriate masking as in Fig. 4, etc. The arithmetic mean of such surface area enhancement ratios was determined for at least 5 of every experimental condition, along with the 95% confidence level to establish error bars. The resulting percentage increase in surface area versus a flat substrate is thus a particularly useful indicator when investigating porous and particulate structures with AFM.
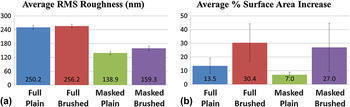
Accordingly, Fig. 5(a) presents average rms roughness results from all images in Fig. 3, based on 4 distinct analyses. This includes the entire images, including dentin and tubules, as in Fig. 4(a), of both plain (i) as well as brushed (ii) teeth. The images minus the tubule areas, such as in Fig. 4(b), have also been analyzed for plain (iii) and brushed (iv) conditions. Without masking (i.e., full image data), there is an apparent roughness for plain samples of 250 nm, rising moderately to 256 nm upon nanoparticle exposure.
Bar graphs representing (a) average percent rms roughness, and (b) average percent surface area increase beyond a perfectly flat surface, for full and masked images of plain versus brushed samples (95% confidence intervals shown).

Of course, a subtle increase in rms roughness upon brushing is somewhat expected, since nanoparticles are being added to the initial tooth structure that is by itself already nanostructured. But this is overwhelmed by the overall values themselves, which are enormous from the perspective of AFM. This is because the measured Rrms is completely dominated by the deep (essentially infinite, though practically limited in the data to several μm) and large pores [e.g., accounting for 16% of the image area in Fig. 4(a)]. Upon masking to eliminate the pores from consideration, on the other hand, the roughness is a more reasonable 139 nm for the initial dentin and a statistically distinct 159 nm after brushing caused by the nanoparticle decoration of the surface. The error bars indicate 95% confidence intervals. These results clearly show that it is crucial to carefully distinguish what features should be included when reporting rms roughness data, especially in porous and particulate materials where multiple length scales may be present. Generally, neither value (raw versus masked) is more or less useful, but only one (i.e., excluding the tubules) is most relevant to the present study into the extent of surface roughening by nanoparticle exposure.
Figure 5(b) presents a similarly formatted plot of the percentage increase in surface area (again, 0% would indicate a perfectly smooth image). Unlike with the rms roughness, the full image data reveal a substantial variation before and after brushing, from 14 to 31%. Upon masking (excluding the tubule area), an even greater difference is observed upon brushing, from a 7 to a 27% increased surface area versus a flat surface. In terms of dental hygiene, such a significantly increased surface area upon nanoparticle exposure could be an important observation. However, it is important here to note that acid-eroded dentin is vulnerable to abrasion.Reference Addy and Shellis29 The increase in the surface roughness of the examined surfaces might be a result of a combined effect of dentin erosion/abrasion and the accumulation of TiO2 nanoparticles of the toothpaste. Future experiments in which acid-eroded samples were brushed without being treated with nanoparticles could be designed to observe the extent of both mechanisms. In any case, the increased surface area percentage even without masking suggests that the nanoparticles decorate not just the surface dentin but also the edges and insides of the tubules (which can be difficult to “see” in the AFM images since the contrast is optimized to visually represent the nanostructured surface, not nanostructuring within the deep pits).
C. In vitro imaging
1. Standard speed
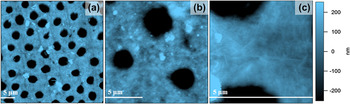
Although the above results clearly evidence and quantify nanoparticle incorporation onto the surface of dentin upon brushing, they were measured in air. In vitro results, on the other hand, are presented in Fig. 6 showing (a) 40-μm, (b) 15-μm, and (c) 5-μm regions of different areas for a single tooth. Based on the iDrive electromagnetic AC imaging scheme, these figures provide impressive details down to the nanoscale in more relevant conditions to the human mouth. In general, the surface morphology of the plain dentin is more detailed for such fluid imaging conditions, as expected since the specimens do not dehydrate. This is particularly notable in the fine structure revealed by the 5-μm image [Fig. 6(c)], where the relatively linear collagen is much more apparent than under air-imaging conditions.
In liquid AFM topography images of plain dentin at length scales of (a) 40 μm, (b) 15 μm, and (c) 5 μm, all with a topography contrast of ±250 nm.

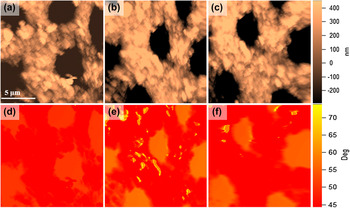
In liquid high speed topography (top) and AC phase (base) images (15 μm by 15 μm) acquired in just (a, d) 25.6 s, (b, e) 12.8 s, and (c, f) 6.4 s.

Similar in vitro images following brushing are equivalently comparable to air-based images; as a result, additional images and analyses on roughness or surface area were not reproduced. This result is unsurprising, since a rinsing step already follows the brushing procedure. Therefore, any loosely bound particles have already been removed such that further soaking during liquid AFM has little effect.
2. High speed SPM in liquid
Although the in vitro images of Fig. 6 are impressive, given the dual challenge of discerning micron scale and nano-scale vertical structures; they demand patience and stability (of both sample and instrument) that are not always compatible with practical AFM experiments. Leveraging recent developments in high speed SPM, Fig. 7 shows in vitro topography (top row) and phase images (base) of a 15 × 15 μm area similar to Fig. 6(c). Unlike the standard liquid imaging, however, these images are acquired at line rates of 10, 20, and 40 Hz, i.e., in just (a, d) 25.6 s, (b, e) 12.8 s, and (c, f) 6.4 s.
All three high speed in vitro topography images are comparable in resolution and z-scale. Meanwhile, the primary phase contrast mimics the topography, since the tip-surface interaction is minimized over the deep pores. In any case, topographic feature sizes and shapes are essentially consistent with each other and with normal speed results. This is unsurprising since the location is nearly the same for each image. To confirm this observation, a roughness analysis of the images reveals similar results despite the speed enhancement of 10, 20, and 40x over standard imaging conditions. The resulting rms roughness (after masking as in Fig. 4) is 218, 223, and 246 nm for 10, 20, and 40 Hz data, respectively (a–c), a scatter that is within the margin for error observed in Fig. 5. The percentage of surface area increase is similarly within the margin of error from Fig. 5. The values themselves are higher than the mean roughness considered in Fig. 5, though, but this is unsurprising since the high speed measurements use a different tip geometry, specimen region, etc. The fact that the high speed measurements are performed in liquid is another possible contributor to the apparently higher roughness and surface area, since organic components in the sample (collagen) can change in a hydrated environment.
It is important to note that instrumental artifacts can occur at high speeds as well. For example, due to scanner nonlinearities, image distortions are common at image edges where tip acceleration/deceleration is not perfectly accommodated. However, this can be corrected in postprocessing as needed by comparison with standards and/or calibration. Here, though, the raw results are purposefully presented for direct comparison. We have therefore demonstrated that in vitro high speed SPM is feasible and accurate even for surfaces with structure from the nanoscale up to the microscale.
IV. CONCLUSIONS
The AFM imaging methods presented here uniquely provide high resolution topographical information of a multiscale porous material, human molar dentin, in air and in vitro. A statistical analysis of the images convincingly quantifies an increase in rms roughness, and especially surface area, upon exposure to nanoparticles as in some oral care regimens. The importance of careful feature selection for analysis when working with multiscale porous and particulate materials is particularly demonstrated by comparing results with and without masking (essentially removing) the microscale dentin tubules. High speed in vitro AC imaging is also demonstrated on these challenging-to-image specimens. This reduces the time required per frame from tens of minutes to as little as 6 s, providing essentially equivalent results to the much more tedious standard imaging conditions in air or liquid. Altogether, AFM is therefore an excellent tool for investigating porous and particulate structures, including those with multiscale features, as long as appropriate analytical approaches are used. Moreover, it is uniquely applicable to measuring such materials in vitro, with obvious applications to biological specimens, and can even be achieved at high rates where slower scanning may be ineffective due to specimen or system stability.
ACKNOWLEDGMENT
Partial support was provided by the NSF sponsored UPenn NSEC on Molecular Function at the Nano/Bio Interface, Grant No. 0832802.