


INTRODUCTION
Lymphatic filariasis continues to be a major source of chronic morbidity in tropical countries and an estimated 120 million people are infected either with Wuchereria or Brugia [Reference Michael, Bundy and Grenfell1, Reference Michael and Bundy2]. In India economic loss due to filariasis was estimated to be around US$ 842 million per year [Reference Ramaiah3]. Considering the gravity of the problem, the World Health Assembly (WHA) passed a resolution in 1997 to eliminate this disease as a public health problem by 2020. The elimination strategy includes transmission control and morbidity management. Transmission could in principle be interrupted either by parasite control and/or vector control; present strategy exclusively relies on anti-parasitic measures [Reference Ottesen and Campbell4–Reference Ottesen, Ismail and Horton6]. Past experience suggests that depending upon any one method is not wise; by either method initial success is very dramatic but subsequent progress in reducing either parasite load or vector density becomes increasingly costly. The Risk of Infection Index (RII), which indicates the intensity of transmission [Reference Das7, Reference Vanamail, Ramaiah and Das8] from indoor resting mosquitoes, is a useful index to measure the infection status in mosquitoes as well as humans. The RII is influenced by vector density and community microfilaria load (CMFL). In this paper we derived a probability matrix, which can be used to decide which control method would be more cost effective at the current level of endemicity.
METHODS
A study has been under way since 1993 by the Vector Control Research Centre, Pondicherry to evaluate the impact of mass chemotherapy with ivermectin and/or diethylcarbamazine (DEC) on transmission and microfilaraemia in 20 rural sites of Villupuram District in Tamil Nadu state, India. The impact of chemotherapy on transmission parameters was evaluated by indoor resting collections of mosquitoes at monthly intervals in all the sites. The resting mosquitoes were collected from each site in 12 randomly selected huts by four well-trained insect collectors, spending 15 min per hut and a total of 3 man-hours per site. The total number of mosquitoes collected at each site was divided by the number of man-hours spent to obtain the vector density of the site in a particular month. The collected mosquitoes were brought to the laboratory and the mosquitoes of the vector species, Culex quinquefasciatus, the only incriminated natural vector of Wuchereria bancrofti in India were dissected to determine the vector infection and infectivity rates and parasite load. The number of developing filarial larvae of W. bancrofti were classified into microfilariae (mf), ‘sausage stage’ (L1), stage II (L2) and stage III or infective stage (L3) following the criteria proposed by Samarawickrema [Reference Samarawickrema9]. To assess the impact of chemotherapy on human infection, parasitological surveys were undertaken in all the sites immediately prior to the next round of chemotherapy. To determine sample size for assessing microfilaria prevalence in a site, a population of minimum 5000 was assumed. By allowing 20% error on the expected mf prevalence with 95% confidence the required sample size was estimated to be a minimum 7% of the population or 7% of households in the site. This 7% of households were selected randomly and all household members had blood sampled. The same proportionate sample was adopted in all the study sites. The details of the study design and results have been presented previously [Reference Das10].
In addition data collected from 17 urban sites in the Pondicherry endemic area early in control operations in 1981 [Reference Rajagopalan11–Reference Das14] were also used for calculating RII values and further statistical analyses. For validation and to estimate the level at which transmission does not occur, data were used from the 17 urban sites where resting mosquitoes were collected later in a control operation in 1986 [Reference Vanamail, Ramaiah and Das8, Reference Rajagopalan11–Reference Das14]. The RII for each site and month was calculated by a previous method [Reference Vanamail, Ramaiah and Das8] as follows:

where, a=parous mosquitoes collected per man-hour; b=average number of L3 larvae/parous mosquito; c=proportion of L3 larvae penetrating the host from one bite (i.e. 0·414×0·32) [Reference De Meillon, Grab and Sebastian15–Reference Ho and Ewert17].
Based on the parasitological survey, mf prevalence at each site (percentage of individuals with filarial infection) was calculated and the CMFL was calculated as follows:

Statistical analysis
Multiple linear regression analysis
Considering the RII values at each site as dependent values and the resting vectors collected per man-hour (MHD) and CMFL as explanatory variables, multiple regression analysis was carried out.
Logistic regression analysis conceptual framework
Considering RII as an indicator of transmission, logistic regression is an appropriate model to estimate the probability of transmission. The form of the logistic model is

where y=1 or y=0 indicates whether a community is at risk of transmission in relation to regression variables (x i) such as vector resting density and CMFL. The constant term of the logistic regression equation is indicated by α and the logistic regression coefficients are denoted by βi from which odds ratios are calculated.
RESULTS
Initially multiple regression analysis was carried out using the RII as the dependent variable and CMFL and MHD as independent variables. It was observed that only 21% of variation in RII was explained by the CMFL and MHD. Further, the coefficient of CMFL was not statistically significant indicating that the multiple regression equation did not adequately fit the data. Therefore, a logistic regression equation was fitted to the data.
In the logistic regression analysis the RII was forced to be a binary response variable. Therefore, all the RII values greater than zero were recoded as ‘1’ and all zero values of RII were left as ‘0’. The vector density (MHD) and CMFL were considered as covariates. For each variable the estimated slope coefficients, standard error (s.e.), odds ratio, log-likelihood for the model and the likelihood ratio test statistics (deviance) for the hypothesis that the slope coefficient is zero are presented in Table 1. The deviance is obtained as minus twice the difference between the log-likelihood for the constant-only model and the model containing the respective variables. On the null hypothesis that the deviance will follow the χ2 distribution at 1 d.f., the significance of each variable was tested. The deviance of intercept-only model was 788·4 and the significance of the model was assessed by the likelihood-ratio test statistics (deviance) between the model of intercept-only and the model with independent variables. The model χ2 (132·5) with 2 d.f. was highly significant (P<0·001), i.e. one can reject the null hypothesis that the coefficients for all the terms in the model were zero. The significance of individual coefficients was also tested based on the Wald statistic (the square of the ratio of the coefficient to its standard error), which has a χ2 distribution. The result showed that while the variable MHD was highly significant (P<0·001), CMFL was of only borderline significance (P=0·0467) in the model. The probability of RII for a given value of CMFL and MHD is calculated as follows

where z=−1·703+0·049×CMFL+0·055×MHD. For different values of CMFL and MHD the probability matrix of RII was calculated and they are presented in Table 2.
Parameter estimation of logistic regression equation by maximum-likelihood estimation method

CMFL, Community microfilaria load; MHD, vector density per man-hour.
Null model χ2=788·44; model χ2=132·50.
Implication of probability matrix of risk of infection index on control strategy
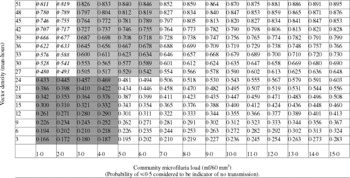
Key to cells: Vector control (bold face italic); combination of vector and parasite control (light grey cells); monitoring and surveillance until infection dies out (dark grey cells); parasite control (white cells).
In order to estimate the probability risk level at which transmission ceases to occur, risk was estimated for the 17 urban sites in the Pondicherry endemic area where resting mosquitoes were collected in the later stage of a control operation [Reference Vanamail, Ramaiah and Das8, Reference Rajagopalan11–Reference Das14]. For all of these 17 sites the incidence rate (%) of filarial infection among the children (0–5 years) born during the control period was calculated. The risk and the corresponding incidence rate are depicted in the Figure. It was observed that while in four out of six sites where the filarial incidence was recorded the risk was ⩾0·5, but in two sites it was around 0·2. Simple linear regression analysis was carried out using the incidence rate as the dependent variable and risk as the independent variable. The fitted regression equation (incidence=−0·76+4·10×risk) was statistically significant (F=7·88, P=0·013) indicating that linear regression adequately fitted the data. From the regression equation the predicted risk was 0·2 when the incidence rate was taken as zero. Therefore, a minimum probability of risk of 0·2 is considered to be safe value for interruption of transmission.
Incidence of filarial infection in the 0–5 years age group by risk probability. , Observed; —, predicted. Incidence=−0·76+4·1×risk, R 2=0·59, P=0·013.

DISCUSSION
The present analysis was carried out to find the relationship between the risk of infection, CMFL and resting vector density. Using the established logistic regression equation a probability matrix was constructed for different levels of CMFL and vector density. The negative intercept in the equation indicates that when the values of CMFL and MHD approach zero the risk of transmission is almost nil. Moreover, for both the variables CMFL and MHD the lower limit of odds ratio is 1. Since incidence of filarial infection was recorded generally in sites where the probability of risk is >0·5, it is presumed that the probability of ⩾0·5 is a positive indicator of transmission. Therefore, it can be inferred from Table 2 that there is no risk of transmission as long as the CMFL is maintained below 5 mf/60 mm3 and MHD is <25. While the MHD is <15 there is no risk of transmission even for higher CMFL (15 mf/60 mm3). This implies that in an endemic area, parasite control should be initiated to bring down the CMFL to ⩽2 and maintain the resting density at <30 per man-hour by introducing vector control in order to facilitate interruption of infection. It also indicates that in the initial stages where CMFL is very high anti-parasitic tools may be more cost effective than vector control, the impact of which is only seen after many years of control operations. An earlier study [Reference Reuben18] indicated that inclusion of a vector control programme along with chemotherapy was not cost effective, i.e. as we become closer to elimination, the cost effectiveness will decline and we may reach a point where any additional input will not produce the desired results. However, earlier studies [Reference Reuben18, Reference Maxwell19] have shown that after mass drug administration there was sustained reduction in microfilaraemia when vector control measures alone were used in subsequent years. Therefore, in areas with low level of CMFL and higher vector density it might be more economical to bring down vector density by vector control measures rather than mass drug administration. The probability risk matrix can serve as a decision-making tool for judging the most cost-effective control programme to achieve interruption of lymphatic filariasis transmission.
ACKNOWLEDGEMENT
The study received financial support from UNDP/World Bank/WHO Special Programme for Research and Training in Tropical Diseases (grant no. 920702). The authors are grateful to Dr K. D. Ramaiah and his team for carrying out entomological and parasitological studies.
DECLARATION OF INTEREST
None.



