


Introduction
The ice cap on King George Island, the largest of the South Shetland Islands, is situated near the northern extremity of the Antarctic Peninsula and consists of a few ice domes that are drained to the sea by a series of relatively fast-moving tidewater outlet glaciers (Fig. 1). The ice cap is located in the path of the main moisture-laden cyclones feeding the ice masses in the warmer northern part of West Antarctica where mean annual air temperatures are −2.8°C (Reference ReynoldsReynolds, 1981). The ice cap is suitable for numerical modeling of the response of the ice masses to short-term climate change in this region and their contribution to sea-level rise (Reference BintanjaBintanja, 1995; Reference Knap, Oerlemans and CadeeKnap and others, 1996). Of particular interest is the study of outlet glaciers on the southern coast of King George Island because these elements of the ice cap have shown the most significant response, retreating up to 1 km since 1956, whereas the northern ice-cap margin has been approximately stationary (Reference Simoes and BremerSimfões and Bremer, 1995) despite the regional climate warming by 1.3°C that has occurred in the northern part of the Antarctic Peninsula since 1960 (Reference Peel, Mulvaney and DavisonPeel and others, 1988).
King George Island. Ice free land is shaded; the ice cap is unshaded. Capital letters and arrows denote ice domes and main tidewater outlet glaciers. Previous RES traverses: solid line shows ground-based RES in 1970 (Reference Govorukha, Chudakov and ShalyginGovorukha and others, 1974); asterisks show airborne RES sites from BASflight 38 in 1975, with measured ice thickness, in meters (personal communication from D. Vaughan, 1997); dots show ground-based RES sites in December 1995 and their numbers. The open circle shows the location of a 50 m ice-core borehole drilled in December 1995 (Reference Macheret, Moskalevsky, Simoes and LadouchMacheret and others, 1997). The area of Figures 2-4, which includes Lange Glacier, is outlined by the box.
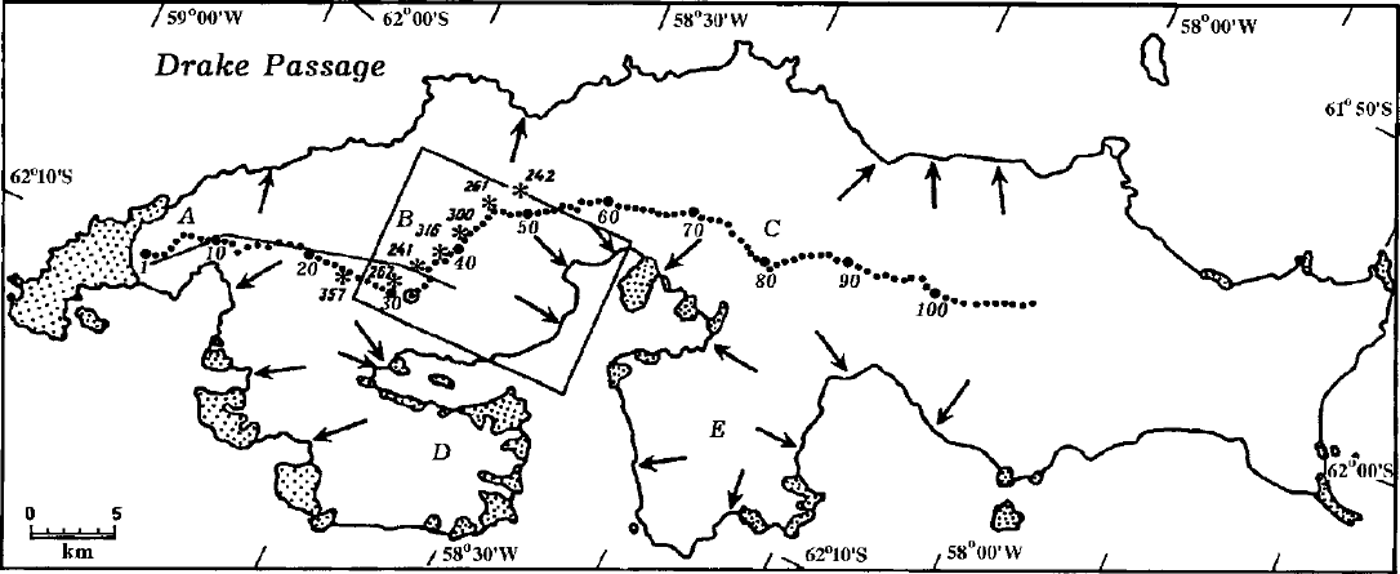
Field investigations of Lange Glacier, an outlet tidewater glacier in the South Shetland Islands which is 30.2 km in area (Reference Simoes, Bremer, Aquino and FerronSimfões and others, 1999) and terminates in Admiralty Bay (Fig. 1), were begun within the framework of the Scientific Committee on Antarctic Research-supported international program, "Glaciology of South Shetlands" (GLASS) in 1995 (Reference Macheret, Moskalevsky, Simoes and LadouchMacheret and others, 1997). In the first season, ground-based radio-echo sounding (RES) along the main ice divide of the whole island, including ice dome B, and ice-core drilling of a 50 m borehole at the summit of this ice dome (Fig. 1) were performed. Additional ground-based RES was carried out in the drainage basin of the glacier by a seasonal detachment of the 42nd Russian Antarctic Expedition in December 1996-January 1997 (Fig. 2) to find a suitable site for deep ice-core drilling and to collect more data on ice thickness and subglacial relief.
Ground-based RES studies in the drainage basin ofLange Glacier (LG) in December 1995 and December 1996-January 1997. A surface elevation map at a scale of 1:50 000, constructed from a photogrammetric survey in 1988/89 by the Institute of Ecology, Polish Academy of Sciences, is used as the topographic base. 1, margin; 2, nunataks; 3, upper and lateral ice divides of Lange Glacier; 4, western boundary of an unnamed glacier that terminates in Admiralty Bay north ofLange Glacier; 5, upper boundary of a crevassed zone on Lange Glacier; 6,50 m ice-core borehole drilled in December 1995 (Reference Macheret, Moskalevsky, Simoes and LadouchMacheret and others, 1997); 7 and 8, ground-based RES sites from December 1995 and December 1996-January 1997, respectively, with their station numbers; 9, airborne RES measurement sites of BAS flight 38 in 1975 (personal communication from D. Vaughan, 1997); 10, RES profiles and profile numbers; 11, glacier surface-elevation contour lines in meters; 12 and 13, ice front positions of Lange Glacier from an aerial photographic survey by the FIDS in December 1956 and a SPOT image taken on 30 March 1991, respectively; 14, upper boundary of basal radar reflections recorded in 1995 and 1996-97 with amplitudes exceeding the signal/noise level.
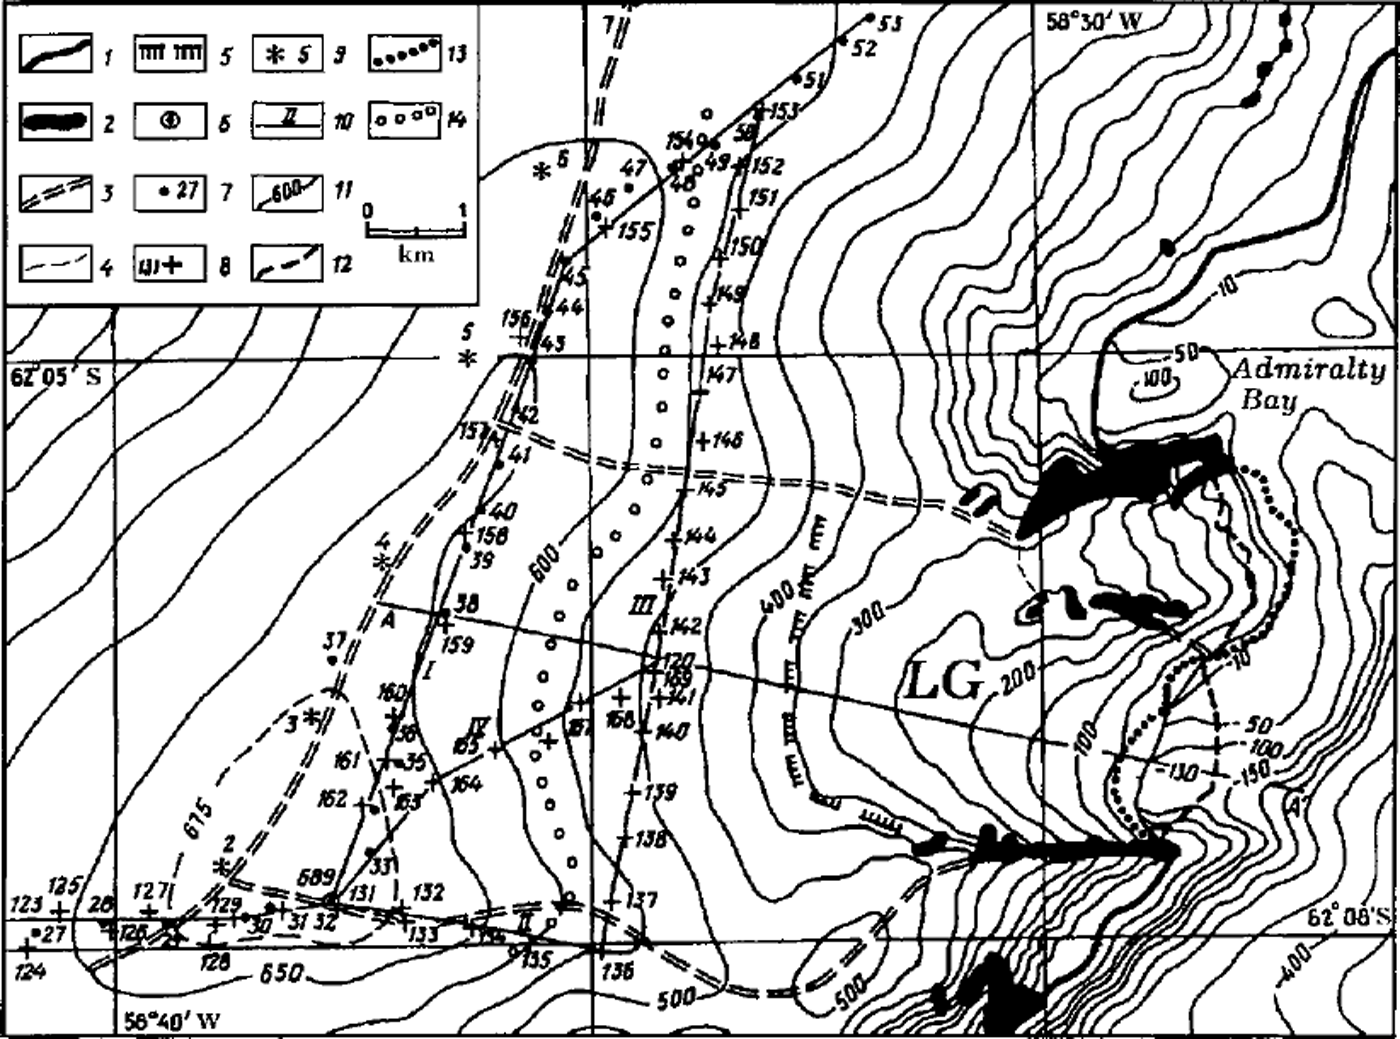
The RES data obtained in both 1995 and 1996/97 in the drainage basin of Lange Glacier are presented and discussed in this paper. For their interpretation and analysis we used the topographic map of Lange Glacier constructed at a scale of 1:50 000 at the Institute of Ecology of the Polish Academy of Sciences from a photogrammetric survey in 1988-89; ice-thickness data (albeit sparse) from airborne RES (Fig. 2) collected by the British Antarctic Survey (BAS) flight 38 in 1975 (personal communication from D. Vaughan, 1997); aerial photographs taken by the Falkland Islands Dependencies Survey (FIDS) in December 1956; and Système probatoire pour l’observation de la terre (SPOT) satellite images taken on 30 March 1991.
Radar Measurements
Ground-based RES was carried out using a monopulse radar with the following parameters: transmitted pulse duration 0.25 µs; central frequency of transmitted signal 40 MHz; transmitted output power 2.0 kWand 5.0 kW; pulse repetition period 50 ms; receiver sensitivity 60 mV; receiver bandwidth 40 MHz; input and output dynamic range 80 and 30 dB, respectively. Antennas are identical 1700 Ω resistively loaded dipoles 5.8 m long with antenna gains of 10 dB. A portable oscilloscope and camera were used to record reflected signals. The transceiver and recorder, together with 12 V batteries, were mounted on two wooden sledges that were towed by an oversnow vehicle. The distance between the centers of receiving and transmitting antennas was 14.6 m.
Four RES profiles of total length 28 km were collected in the upper non-crevassed part ofLange Glacier basin, which was accessible for ground-based operations (Fig. 2). Profiles I and II passed along the upper (main) and southern (lateral) ice divides, while profiles III and IV passed across and roughly along the ice flowlines. Profile I coincided with the 1995 profile between points 26 and 53 (Fig. 1), where the identification of bed reflections was partially hampered by strong attenuation and scattering of the radio waves (Reference Macheret, Moskalevsky, Simoes and LadouchMacheret and others, 1997).
The SPOT images were used to identify the lower, dangerous, crevassed part of Lange Glacier and its lateral ice divides and to choose the radar profiles. The co-ordinates of reference points in profiles II-IV, determined from this image, served for preliminary selection of safe routes and were used to support satellite navigation even in bad weather conditions. A Trimble global positioning system receiver was used to determine the coordinates of RES sites with an accuracy of ±200 m, and the altitudes of the sites were obtained from the topographic map.
Results
Clearly identified radar reflections from the bed were obtained at 65% of RES sites located at <575ma.s.l. (Fig. 2). At the other sites the amplitude of bed reflections was comparable with signal/noise level. Nevertheless, at 47% of these sites, the bed reflections were just distinguishable on the film.
Ice-thickness and bedrock-elevation maps that cover the investigated upper part of Lange Glacier and the adjoining area of ice dome B are shown in Figures 3 and 4. Because the ice in the accumulation areas of the ice cap on King George Island is at the pressure-melting point (Reference Orheim and GovorukhaOrheim and Govorukha, 1982), a radio-wave velocity of 161 m µs−1, characteristic of temperate glaciers (Reference Macheret, Moskalevsky and VasilenkoMacheret and others, 1993), was used for ice-thickness calculation.
Ice-thickness map for the investigated part of Lange Glacier from ground-based RES data collected in 1995 and 1996/97 Contour lines are given in meters. Other symbols are shown in Figure 2

Bedrock-elevation map for the investigated part of Lange Glacier from ground-based RES data collected in 1995 and 1996/ 97. Contour lines are given in meters. Dotted area and arrows denote subglacial rises and main directions of ice runoff from the ice-divide area. Other symbols are shown in Figure 2.

Ice thickness
The thickest ice in the drainage basin of Lange Glacier is found near its upper (main) ice divide, where there are three sites with ice thickness > 300 m. The maximum measured ice thickness is 308 m, which is in good agreement with the airborne RES data of 1975 (Figs 2 and 3). Ice thickness decreases down-glacier and is 144-194 m on transverse profile III, located 2-3 km from the main ice divide and 5-5.5 km from the glacier front. Taking into account the bathymetric data (Fig. 2), we estimate that the ice thickness in the lower, non-investigated part of the glacier changes along the longitudinal profile AA’ from 170 m on Profile III to 100-130 m at the ice front. Unfortunately, we do not know the position of the ground-based RES profile of 1970 (Reference Govorukha, Chudakov and ShalyginGovorukha and others, 1974) near ice dome B (Fig. 1) accurately enough to compare those data with the results of our RES measurements.
Subglacial relief
The upper part ofLange Glacier basin is characterized by a complex subglacial relief (Fig. 4). Three bed rises and two subglacial hollows between them with bedrock elevation differences up to 100 m are revealed near the main ice divide. These hollows underlie the main ice-runoff channels from the ice-divide area through transverse profile III to the lower part of the glacier. There is also one more ice-runoff channel that starts from the saddle separating ice dome B and a small ice rise to the east (Fig. 2). The ice runoff from the ice-divide area of neighboring Domeiko Glacier is also controlled by subglacial rises (Fig. 4).
Thus, the data obtained indicate a close link of glacier surface and subglacial topography. The main and lateral ice-divide areas are related to the bed rises, while concave areas of the glacier surface correlate to subglacial hollows, and the main ice runoff from the ice-divide area comes through these subglacial hollows. The intensity of ice runoff and its temporal changes, determined by variations in accumulation/ablation rates, should be reflected in fluctuations of the glacier terminus.
Ice-front fluctuations and short-term climate change
Lying in the deepest coastal part of Admiralty Bay, where the sea is 130 m deep, the ice front of Lange Glacier, from comparison of aerial photography, topographic map and SPOT imagery, retreated 0.7 ±0.1 km and 1 ± 0.1 km over the periods 1956-88 and 1956-91, respectively (Fig. 2), with a reduction in area by about 2 km2, or 6.6% over a total period of 35 years (Reference Simoes, Bremer, Aquino and FerronSimões and others, 1999).
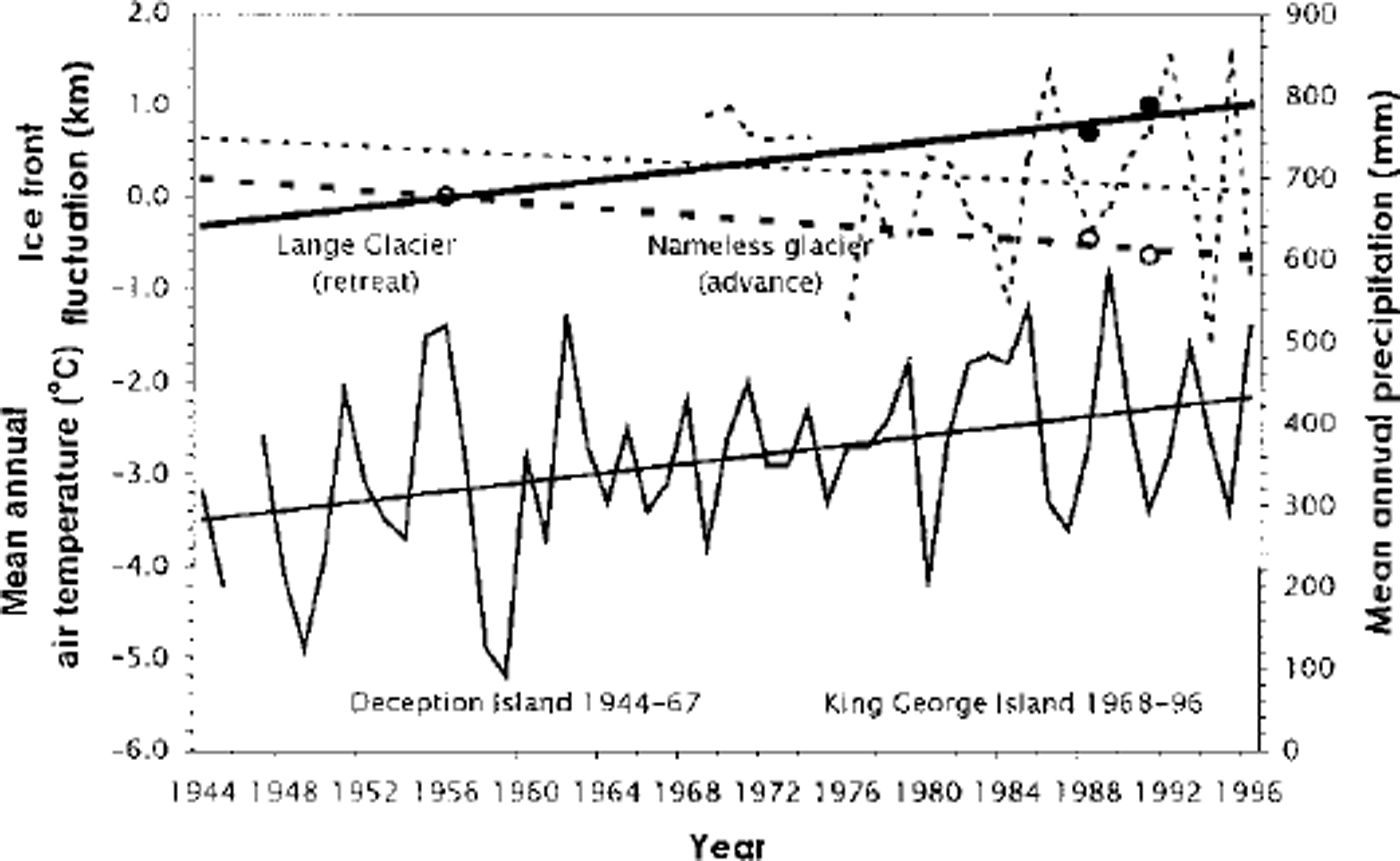
The data from meteorological observations collected on Deception Island and King George Island (Bellingshausen station) over the periods 1944-67 and 1968-96, respectively (personal communication from M. Kejna, 1998), indicate a positive trend of 1.4°C in mean annual air temperature and a negative trend in precipitation over the period 1969-96 (Fig. 5). Isotope studies of ice cores from Dolleman Island and Palmer Land Plateau in the southern part of the Antarctic Peninsula have also shown that the mean annual temperature has risen by 1.3°C since 1960 (Reference Peel, Mulvaney and DavisonPeel and others, 1988). Therefore one can suppose that the front of Lange Glacier has retreated during the last 35 years synchronously with a regional climate change (Fig. 5). However, an unnamed glacier neighboring Lange Glacier, that is situated between Wegger Peak and Komandor Peak and terminates in the sea (Fig. 4), advanced 0.6 ±0.1 km over the same period, i.e. the response of the two glaciers to the same climate change was opposite in phase (Fig. 5). Perhaps this can be explained by differences in subglacial topography, ice flow and bottom conditions or surging behavior of the glacier. At the same time, the northern ice-cap margin, from comparison of aerial photographs of 1956 and Landsat multispectral scanner, SPOT, and European Remote-sensing Satellite (ERS-1) synthetic aperture radar images taken in 1978-92, was approximately stationary, with changes of ∼± 5 0 m, comparable with the accuracy of the satellite images (Reference Simoes and BremerSimões and Bremer, 1995).
Variations in mean air temperature and precipitation on the South Shetland Islands over the periods 1944-96 and 1969-96, respectively, and ice-front fluctuations of Lange Glacier and an unnamed neighboring glacier (see Fig 2) over the period 1956-91. Thin solid and dashed lines are mean air temperature and precipitation and their linear approximation from data from meteorological observations on Deception Island in 1944-67 and on King George Island (Bellingshausen station) in 1968-96, respectively. Solid and open circles are ice front retreat of Lange Glacier and advance of the neighboring unnamed glacier (in km) between 1988 and 1991, and 1956,1988 and 1991, respectively. Solid and dashed bold lines are linear approximations of ice front fluctuations of Lange Glacier and the neighboring unnamed glacier, respectively, between 1956 and 1991.
With regard to the global climate warming expected over the next few decades, and linked with increasing atmospheric greenhouse-gas concentration (Reference Bretherton, Bryan, Woods, Houghton, Jenkins and EphraumsBretherton and others, 1990), Lange Glacier can be considered a particularly sensitive and dynamically active element of the ice cap on King George Island and as a suitable object for further monitoring of fluctuations and response to short-term climate warming.
Conclusion
Ground-based RES was performed in 1995 and 1996-97 in the upper non-crevassed part of Lange Glacier. The results indicate a close link between glacier surface and subglacial topography and suggest that the main direction of ice runoff from the ice-divide area, where ice thickness reaches 308 m, is through relatively deep (up to 50-100 m) subglacial troughs. With measured ice velocities, these data would allow estimation of ice runoff through the transverse profile, and can also aid in choosing a suitable site for deep ice-core drilling.
A comparison of available aerial photographs, topographic maps and satellite images obtained in 1956,1988-89 and 1991 shows that the front ofLange Glacier, located on the southern coast of the ice cap, has retreated by 1km over a period of 35 years. This retreat has coincided with a warming of the regional climate on the South Shetland Islands since 1944 (Fig. 5) and in the northern part of the Antarctic Peninsula since 1960 (Reference Peel, Mulvaney and DavisonPeel and others, 1988). By contrast, the position of the northern ice-cap margin on King George Island has been approximately stationary and most of the outlet glaciers on the southern coast of the ice cap have also retreated (Reference Simoes and BremerSimões and Bremer, 1995; Reference Simoes, Bremer, Aquino and FerronSimoes and others, 1999). The exception is an unnamed glacier neighboring Lange Glacier (Fig. 2).
We consider Lange Glacier to be a sensitive and dynamically active element of the ice cap on King George Island, suitable for further monitoring of fluctuations and response to short-term climate warming in this region of West Antarctica. To understand the reasons for the different responses of the ice masses to the current climate warming in this region, further studies including mass-balance and ice-velocity observations, satellite monitoring and numerical modeling are needed.
Acknowledgements
This work was carried out with the financial support of Russian Foundation of Basic Research grants 96-05-065680 and 96-05-79109, the Russian Antarctic Expedition (RAE), the Ministry of Science of the Russian Federation, the Institute of Geography of the Russian Academy of Sciences (RAS), the Brazil Antarctic Expedition and the Federal University of Rio Grande do Sul, Porto Alegre, Brazil. The authors express deep thanks to V. M. Kotlyakov, Director of the Institute of Geography of RAS, V. V. Lukin, Head of RAE, and J. C. Simões, Head of the International Antarctic Expedition, for help with the organization and carrying out of field investigations. We thank Ye.V. Vasilenko for modification of radar equipment, D. Vaughan, J. Thomson and S. Dobson of the BAS for data from airborne RES, aerial photographs and topographic maps of the area, and M. Kejna from Nicolas Copernicus University in Toruń, Poland, for meteorological data from the South Shetland Islands.



