Implication
There are evidences that maternal nutrition level during gestation may affect fetal growth, and newborn’s growth and development and therefore, have the potential to have long-term effects on body composition as well as metabolic health of the offspring by fetal programming. The results of this research may help to increase understanding of the effects of maternal nutrition level during the periconception period on the fetal growth, muscle development and plasma hormone concentrations. Maternal undernutrition during the periconception period may alter muscle fiber diameter which may have implications for the postnatal performance of lambs.
Introduction
Level of maternal nutrition during gestation not only affects nutrient and hormone concentrations in blood (Picciano, Reference Picciano2003; Rumball et al., Reference Rumball, Bloomfield, Oliver and Harding2009) but can also change intrauterine micro-environment with its effects on placental–fetal development (Sen et al., Reference Sen, Sirin and Kuran2013) and thereby may influence subsequent development, health and productivity of the offspring (Wu et al., Reference Wu, Bazer, Wallace and Spencer2006; Kenyon and Blair Reference Kenyon and Blair2014; Sen et al., Reference Sen, Sirin, Aksoy, Ensoy, Ulutas and Kuran2015). It is known that nutritional status of ewes around the mating period alters ovarian activity and lambing rates after mating in many sheep breeds (Lassoued et al., Reference Lassoued, Rekik, Mahouachi and Ben Hamouda2004). Low feed intake before mating reduces the mean ovulation rate and inadequate nutrition after mating induces a higher rate of ova wastage (Rhind et al., Reference Rhind, McKelvey, McMillen, Gunn and Elston1989). Moreover, over-feeding during early gestation reduces pregnancy rate and reproductive performance (Parr et al., Reference Parr, Davis, Fairclough and Miles1987). However, the effect of maternal feed intake during periconception period on embryonic development and its subsequent growth and/or development has usually been ignored.
Maternal dietary level affects fetal muscle fiber growth and development during the differentiation period of myogenesis (Costello et al., Reference Crosier, Farin, Rodriguez, Blondin, Alexander and Farin2008). Myogenesis and protein synthesis in muscle during periconception period (Lie et al., Reference Lie, Morrison, Williams-Wyss, Suter, Humphreys, Ozanne, Zhang, MacLaughlin, Kleemann, Walker, Roberts and McMillen2015) have received attention for research as muscle is one of the affected tissues by maternal nutrition level. Recent studies have shown that maternal nutrition level during pre-mating and early gestation period can change intrauterine conditions and maternal endocrine status (Annett and Carson, Reference Bispham, Gopalakrishnan, Dandrea, Wilson, Budge, Keisler, Broughton Pipkin, Stephenson and Symonds2006; Laporte-Broux et al., Reference Laporte-Broux, Roussel, Ponter, Perault, Chavatte-Palmer and Duvaux-Ponter2011). Maxfield et al. (Reference Maxfield, Sinclair, Broadbent, McEvoy, Robinson and Maltin1998a) reported that early embryo manipulations may have impact on muscle development and/or growth of the fetus and may influence on fetal and neonatal or postnatal size of the offspring. Recently, Lie et al. (Reference Lie, Morrison, Williams-Wyss, Suter, Humphreys, Ozanne, Zhang, MacLaughlin, Kleemann, Walker, Roberts and McMillen2015) have demonstrated that maternal undernutrition during the periconception period changes expression of mRNA and/or protein abundance of factors that regulate myogenesis and protein synthesis in the fetal muscle during the late gestation. Moreover, alterations in the intrauterine environment and natural hormone status of the preimplantation embryo may result in developmental adaptations that permanently change the structure, physiology, metabolism, endocrine status and growth of the fetus (Quigley et al., Reference Quigley, Kleeman, Kakar, Owens, Nattrass, Maddocks and Walker2005). Taken together, these studies show that the periconception period may be a rather critical time for subsequent muscle fiber development and/or growth of the fetus.
Fetal muscle fibers are of two types, primary and secondary, and maternal nutrition level during early- and mid-gestation can influence fetal muscle number and type (Maltin et al., Reference Maltin, Delday, Sinclair, Steven and Sneddon2001). Especially secondary muscle fibers have been shown to be more susceptible to many environmental factors, including maternal nutrition level during early-mid gestation in pigs (Dwyer et al., Reference Edwards and McMillen1994) and ewes (Quigley et al., Reference Quigley, Kleeman, Kakar, Owens, Nattrass, Maddocks and Walker2005). Skeletal muscle fiber hyperplasia is completed during gestation and fixed at birth (Fahey et al., Reference Gallaher, Breier, Keven, Harding and Gluckman2005). Therefore, the number and type of skeletal muscle fiber are important for growth potential of muscle mass and meat production in livestock (Dwyer et al., Reference Edwards and McMillen1994; Fahey et al., Reference Gallaher, Breier, Keven, Harding and Gluckman2005). It is well known that skeletal muscle fibers in vertebrates are formed from the mesoderm layer of the embryo (Maltin et al., Reference Maltin, Delday, Sinclair, Steven and Sneddon2001). Therefore, changes in the intrauterine conditions and endocrine milieu induced by maternal nutrition level may cause perturbations in differentiation of the inner cell mass and may alter embryonic and myogenic development.
Although previous studies have indicated that maternal undernutrition during periconception period can influence fetal myogenesis (Quigley et al., Reference Quigley, Kleeman, Kakar, Owens, Nattrass, Maddocks and Walker2005; Costello et al., Reference Crosier, Farin, Rodriguez, Blondin, Alexander and Farin2008; Lie et al., Reference Lie, Morrison, Williams-Wyss, Suter, Humphreys, Ozanne, Zhang, MacLaughlin, Kleemann, Walker, Roberts and McMillen2015), but these studies were conducted in a comparatively wide window of periconception period (~1 month of nutritional insult). As there are reports to suggest that an insult to embryo even for a very short period of time can alter fetal myogenesis in sheep (Maxfield et al., Reference Maxfield, Sinclair, Broadbent, McEvoy, Robinson and Maltin1998a), we hypothesized that nutritional insult for a narrower period of time during the periconception period than the periods reported in the literature may be enough to influence fetal myogenesis. The main objective of the present study was to investigate whether maternal nutrition level during the periconception period influences the fetal growth, skeletal muscle development of the fetus and the maternal-fetal plasma hormone concentrations in sheep.
Material and methods
The experimental procedures were approved by the Local Animal Care and Ethics Committee of Gaziosmanpasa University, Tokat, Turkey ensuring compliance with EC Directive 86/609/EEC for animal experiments. A total of 55 Karayaka sheep, ~3 years of age, were used as experimental animals within the natural breeding season (September to March) of sheep in Turkey. These animals were reared at the Sheep Farm of Gaziosmanpasa University, Tokat, Turkey (40°31′N, 36°53′E and 650 m above sea level). All ewes were weighed and their muscle depth (MD) and fat depth (FD) of longissimus dorsi (LD) muscle were measured by an ultrasonic linear prop (Falco Vet. Lineer probe 8.0 MHz; Pie Medical Equipment Co., Maastricht, the Netherlands) at the beginning of the experiment. The ewes were allocated into two treatment groups; well-fed (WF; n=23) and under-fed (UF; n=32) before estrus synchronization. It was anticipated that the number of fetuses from UF ewes would be low due to the effects of undernutrition on ovulation rate and/or pregnancy rate. A higher number of ewes, therefore, were allocated to UF group. However when the fetuses were secured, their number was even lower than expected. This resulted in an unbalanced number of fetuses between the two treatment groups. The groups were balanced for BW, MD and FD values.
Estrus was synchronized in the ewes using the standard protocol of intravaginal sponges containing 30 mg flugestone acetate (Chronogest; Intervet, Istanbul, Turkey) for 12 days followed by an intramuscular injection of 1 ml of PGF2α (Dinolytic; 5 mg PF2α /ml; Pharmacia, Puurs, Belgium) at the time of sponge removal. Karayaka rams were introduced to ewes 48 h after sponge removal (two rams were used for mating and they were represented equally in both experimental groups) and the mating was monitored to determine day 0 of gestation.
The ewes were fed with diets, either ad libitum (WF) or 0.5×maintenance (UF) 6 days before and 7 days after mating in individual pens. Diets were composed of concentrate (89.4% DM, 22.9% CP and 11.0 MJ ME/kg DM), and good quality alfalfa hay (88.6% DM, 17.1% CP and 8.1 MJ ME/kg DM). During rest of the experimental period ewes in both the groups were fed with a diet to meet 100% of their daily maintenance requirements which were calculated on an individual ewe BW basis (AFRC, 1993). Diets were given daily in two equal meals at 0830 and 1630 h.
The ewes were scanned using an ultrasound scanner on day 30 of gestation for pregnancy and non-pregnant ewes were removed from the experiment. Pregnant ewes in both the groups (WF=10 and UF=8) were killed by lethal intravenous injection of sodium pentothal on day 90 of gestation and any pregnant ewe carrying twin fetuses (one ewe in the WF group) or female fetuses (one ewe in the WF group and three ewes in the UF group) were removed from the experiment to avoid the effects of sex and twinning. Therefore, only singleton male fetuses were used in the present study (WF=8 and UF=5). The sheep breed used in the study has low fecundity, therefore the number of twins is low and it was decided to use only singletons. Indeed only in WF group there was one twins and this was excluded from the experiment to avoid any possible effect of twins on studied parameters. Additionally all fetuses except one in WF group were males and three fetuses in UF were females. These numbers did not allow analyzing the effect of sex on parameters studied. Therefore the female fetuses were excluded from the experiment to compare the treatment groups objectively and to have unbiased results due to sex differences. Once ewes were killed, their uteri were weighed and the singleton male fetuses were collected. Fetal BWs, placental characteristics (total placental weights, fetal membranes weights and total cotyledon weights), fetal body dimensions (crown-rump lengths (CRL) and thoracic girth), fetal femur and tibia lengths, and weights of fetal organs (heart, liver, lungs, spleen, kidneys, brain and testes) were then recorded. Weights of fetal LD, semitendinosus (ST), semimembranosus (SM) and gastrocnemius (GN) muscles were also determined.
Maternal jugular vein blood samples were taken on day 7 post mating and fetal blood samples were taken by cardiac puncture at day 90 of gestation. Blood samples were collected in sodium ethylenediaminetetraacetic acid (sodium heparin) containing vacutainer tubes and plasma was separated following centrifugation at 2500×g (gmin=1636 g, gmax=3720 g, gav=2678; Beckman Coulter, Allegra X-12R Benchtop Centrifuge, refrigerated, 60 Hz, 208 V) for 10 min at 4°C and then stored at −20°C until analyzed for hormones. All the hormone concentrations were determined in duplicate. Plasma concentrations of insulin (EIA-2339), IGF-I (EIA-2947), cortisol (EIA-1887), progesterone (EIA-1561), free triiodothyronine (T3; EIA-2385) and free thyroxine (T4; EIA-2386) were determined using commercial enzyme immunoassay kits (DRG Instruments GmbH, Marburg, Germany).
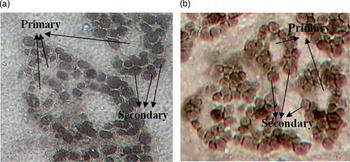
Within 30 min of removal of the fetus from the uterus the whole ST and LD muscles excised from the right side of fetuses were rapidly frozen in liquid nitrogen and stored at −80°C until histochemical (ATPase staining) analysis of primary and secondary muscle fibers. Type of muscle fibers in LD and ST muscles was determined using myosin ATPase staining technique described by Brooke and Kaiser (Reference Cam, Kuran, Yildiz and Selcuk1970) with some modifications. At least four transverse serial muscle sections (10 µm thick) were cut across the mid-belly section of the muscles using a cryostat at −20°C (Cryotome E; Thermo Electron Corporation, Cheshire, UK). Sections were allowed to dry and then stained for myosin ATPase after pre-incubation for 12 min at 4°C at pH 4.2 in 1 N formic acid buffer. Sections were then washed twice for 1 min each time at pH 7.4 with 18 mM CaCl2 and 100 mM Tris. Sections were then incubated for 60 min at 37°C in 18 mM CaCl2, 20 mM Tris buffer (pH 9.4) and 2.7 mM ATP. After the incubation, sections were washed twice for 5 min each time in 1% CaCl2 solution followed by 3 min of incubation in 2% CoCl2 solution at room temperature. Sections were then washed in distilled water before being stained with 1% ammonium sulfide (wt/vol; Fluka, Turkey) solution for 2 min. The stained sections were finally washed for 10 min with distilled water. Sections were then dehydrated for 15 s in ethanol (80%, 95% and 100%) and acetone (100%). The cover slips were mounted onto glass slides with Canada balsam (Fluka 60610, Istanbul, Turkey) before viewing under a microscope. Primary fibers were identified as centrally located vacuoles like fibers or reacted less intensely to ATPase at pH 9.4 fibers; intensely stained fibers were classified as secondary fibers (Quigley et al., Reference Quigley, Kleeman, Kakar, Owens, Nattrass, Maddocks and Walker2005). The muscle cross-sectional areas (MCSA) of the mid-belly section of the LD and ST muscles, and numbers and cross-sectional areas of primary and secondary muscle fibers were determined using a microscope (10×; Nikon Eclipse E600; Nikon Corporation, Tokyo, Japan) linked to an image capture system (Clemex, Image Analysis Software; Vision Lite, Longueuil, Canada). Four areas were selected randomly from the sections to determine fiber type composition. Myofiber cross-sectional areas were determined by tracing the perimeter of individual fibers displayed on the computer monitor attached to a microscope at ~20 primary and 150 secondary muscle fibers (Maxfield et al., Reference Maxfield, Sinclair, Broadbent, McEvoy, Robinson and Maltin1998a). Images of primary and secondary muscle fibers from LD and ST muscles stained for myosin ATPase are presented in Figure 1.
Pictures of myosin ATPase staining (at pH 4.2) of fetal longissimus dorsi (a) and Semitendinosus (b) muscles.

The maternal nutrition levels during the periconception period were used as factor in the model and effects on BW, muscles weights and organs weights of fetus and placental characteristics were analyzed as a complete randomized design using the general linear model of the Statistical Analysis System (Minitab 1998). MCSA, fetal muscle fiber characteristics and hormone concentrations were analyzed after log10 transformation. The sire was used as a cofactor in the model to eliminate sire effect on feto-placental data. The differences in the mean values were compared by the Tukey’s multiple comparison tests. The pregnancy rates were compared between the two groups by χ 2 test. The power of test was calculated by Power and Sample Size utilities of MINITAB software for all variables. The results showed that the minimum power of the tests was 0.936 which indicates that the sample size was adequate for this study. The data on MCSA, fetal muscle fiber characteristics and hormone concentrations have been presented as untransformed means values±standard error of the mean in the tables or figures. Statistical significance was determined at the level of 0.05.
Results
The BWs of the ewes in WF (48.5±0.6 kg) and UF (48.8±0.9 kg) groups were not different at the start of the experiment. Ewes in the under-fed group lost (−3.38±0.2 kg) and those in the well-fed group gained (3.09±0.2 kg) weight during the periconception period (P<0.05). MD and FD values of the ewes in WF (20.8±1.1 and 4.7±0.6 mm, respectively) and UF (21.1±1.3 and 4.5±0.4 mm, respectively) groups were similar at the beginning of the experiment. However, there was a decrease in FD values of ewes in the UF (−0.45±0.03 mm) and an increase in the WF (0.15±0.01 mm) group during the periconception period (P<0.05). Pregnancy rate was significantly (P<0.05) lower in UF (25%) compared with WF (44%) ewes.
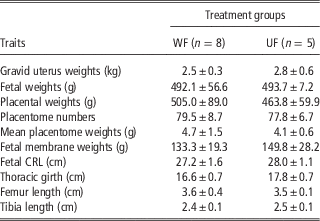
Feto-placental weights and measurements on day 90 of pregnancy in ewes from both nutritional groups are presented in Table 1. The level of maternal feed intake during the periconception period did not affect the gravid uterus weights, fetal BWs, placental characteristics (total placental weights, fetal membranes weights and total cotyledon weights), fetal body dimensions (CRL and thoracic girth), fetal femur and tibia lengths.
Feto-placental weights and measurements (mean±SEM) on day 90 of pregnancy in ewes that were fed at different levels from 6 days before and 7 days after mating

WF=well-fed (ad libitum feeding); UF=under-fed (0.5×maintenance); CRL=crown-rump lengths.
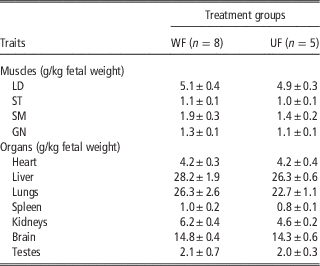
Relative muscles and organs weights of fetuses at day 90 of gestation from ewes in both the groups are presented in Table 2. Heart, liver, lungs, spleen, kidneys, brain and testes weights of the singleton male fetuses were not significantly affected by maternal nutrition level during the periconception period. Moreover, the fetal LD, ST, SM and GN muscles weights were not significantly affected by the level of maternal feed intake during the periconception period.
Relative muscles and organs weights (mean±SEM) of fetuses at 90 days of gestation from ewes that were fed at different levels from 6 days before and 7 days after mating

WF=well-fed (ad libitum feeding); UF=under-fed (0.5×maintenance); LD=longissimus dorsi; ST=semitendinosus; SM=semimembranosus; GN=gastrocnemius.
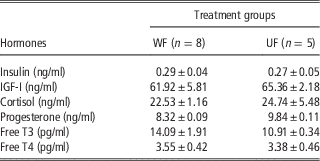
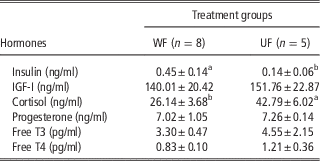
Plasma hormone concentrations of fetuses (on day 90 of pregnancy) and ewes (on day 7 after mating) in both the groups are presented in Tables 3 and 4, respectively. Maternal nutrition level during the periconception period did not cause significant changes in neither fetal plasma insulin nor maternal and fetal plasma IGF-I, cortisol, progesterone, and free T3 and T4 concentrations. However, maternal cortisol concentrations were lower and maternal insulin concentrations were higher in WF ewes than those in UF ewes (P<0.05).
Plasma hormone concentrations (mean±SEM) in fetuses on day 90 of pregnancy in ewes that were fed at different levels from 6 days before and 7 days after mating

WF=well-fed (ad libitum feeding); UF=under-fed (0.5×maintenance); Free T3=free triiodothyronine; Free T4=free thyroxine.
Plasma hormone concentrations (mean±SEM) at day 7 post mating in ewes that were fed at different levels from 6 days before and 7 days after mating

WF=well-fed (ad libitum feeding); UF=under-fed (0.5×maintenance); Free T3=free triiodothyronine; Free T4=free thyroxine.
a,bDifferent letters in the same row indicate significant difference (P<0.05).
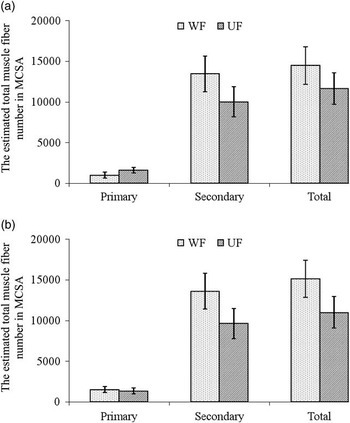
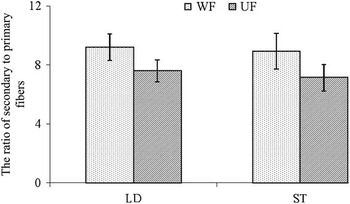
The estimated total muscle fiber number of primary and secondary fibers in MCSA and the ratio of secondary to primary fibers in fetal LD and ST muscle samples of fetuses are presented in Figures 2 and 3, respectively. Secondary, primary and total muscle fiber numbers in MCSA of LD and ST muscles from fetuses were similar to each other. The ratio of secondary to primary fibers in LD muscle samples of fetuses from ewes in UF group was similar to those from ewes in WF group. Only a tendency was found for change in secondary to primary fiber ratio and only in ST in low maternal feed intake group (P=0.07).
The estimated total muscle fiber number of primary and secondary fibers in the muscle cross-sectional area (MCSA) in longissimus dorsi (a) and Semitendinosus (b) muscles of fetuses from ewes that were fed at different levels from 6 days before and 7 days after mating. The error bars represent the standard error of the mean. WF=well-fed (n=8, ad libitum feeding); UF=under-fed (n=5, 0.5×maintenance).

The ratio of secondary to primary fibers in longissimus dorsi (LD) and Semitendinosus (ST) muscles samples of fetuses from ewes that were fed at different levels from 6 days before and 7 days after mating. The error bars represent the standard error of the mean. WF=well-fed (n=8, ad libitum feeding); UF=under-fed (n=5, 0.5×maintenance).

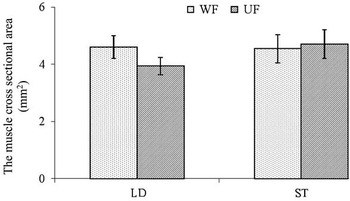
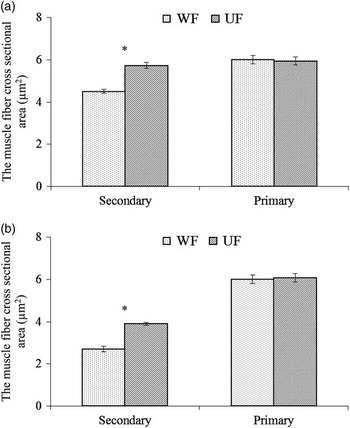
The MCSA of the fetal LD and ST muscles and the cross-sectional area of secondary and primary fibers in the fetal LD and ST muscles of fetuses from ewes in both the groups are presented in Figures 4 and 5, respectively. Maternal feed intake level during the periconception period had no significant effect on MCSA of the fetal ST, but MCSA of LD of the fetuses from ewes in the UF group tended to be lower than those from the ewes in the WF group (P=0.09). A reduced maternal feed intake compared with high feed intake increased the cross-sectional area of secondary fibers in the fetal LD and ST muscles (P<0.05).
The muscle cross-sectional area (MCSA) of longissimus dorsi (LD) and Semitendinosus (ST) muscles of fetuses from ewes that were fed at different levels from 6 days before and 7 days after mating. The error bars represent the standard error of the mean. WF=well-fed (n=8, ad libitum feeding); UF=under-fed (n=5, 0.5×maintenance).

The cross-sectional area of secondary and primary fibers in longissimus dorsi (a) and Semitendinosus (b) muscles of fetuses from ewes that were fed at different levels from 6 days before and 7 days after mating. The error bars represent the standard error of the mean and asterisks indicate differences between treatment groups (P<0.05). WF=well-fed (n=8, ad libitum feeding); UF=under-fed (n=5, 0.5×maintenance).

Discussion
The results of the present study have shown that low nutrient intake during the periconception period from 6 days before and 7 days after mating increases the cross-sectional area of secondary fibers (in LD and ST muscles) and changes the ratio of secondary to primary fibers (in ST muscle) in fetal muscles. Maternal nutrition level during the periconception period had, however, no effect on fetal weights, placental characteristics, fetal organ developments, fetal plasma hormone concentrations, MCSA and secondary and primary muscle fiber numbers of the fetal LD and ST muscles. It is interesting that the level of nutrition around the mating period had a dramatic effect on pregnancy rate and lower pregnancy rate was observed in UF than WF ewes.
In the present study maternal under- or over-nutrition level during the periconception period did not result in a change in either maternal or fetal plasma progesterone concentrations and also gravid uteri weight, fetal weight, fetal membrane weights, mean placentome weights, total placental weights and the number of placentomes at 90 days of gestation. Similarly, MacLaughlin et al. (Reference MacLaughlin, Walker, Roberts, Kleemann and McMillen2005) reported that short-term undernutrition from 45 days before mating until 7 days after mating in singleton gestations did not affect uterine, fetal weights, weight of fetal membranes, placentome number, mean placentome weight and total placental weight at 53 to 56 days of pregnancy in the sheep.
Quigley et al. (Reference Quigley, Kleeman, Kakar, Owens, Nattrass, Maddocks and Walker2005) reported that maternal nutrition level in ewes during periconception period from 18 days before until 6 days after ovulation did not affect the primary fiber numbers of singleton fetus, but maternal over nutrition increased total muscle fiber numbers, secondary fiber numbers and secondary to primary fiber ratio in the ST muscles of singleton fetuses on day 75 of gestation compared with fetuses from undernutrition ewes. On the contrary, in the present study, maternal high or low nutrition during periconception period did not change secondary, primary and total muscle fiber numbers in MCSA of LD and ST muscles of singleton male fetuses on day 90 of gestation. However, secondary to primary fiber ratio in ST muscle of fetuses from undernourished ewes tended to be lower compared with fetuses from well-fed ewes. Increase or decrease in secondary to primary fiber ratio as the result of nutritional treatments in the present study is compatible with the reported results in response to nutritional manipulations (Maxfield et al., Reference Maxfield, Sinclair, Broadbent, McEvoy, Robinson and Maltin1998a and 1998b; Crosier et al., Reference Dwyer, Stickland and Fletcher2002; Quigley et al. Reference Quigley, Kleeman, Kakar, Owens, Nattrass, Maddocks and Walker2005).
The cross-sectional area of secondary fibers in the LD and ST muscles of fetuses from under-fed ewes was higher than those from well-fed ewes in the present study. Additionally, restricted maternal feed intake during the periconception period tended to decrease MCSA of the fetal LD muscle. Maxfield et al. (Reference Maxfield, Sinclair, Broadbent, McEvoy, Robinson and Maltin1998a) reported that short-term in vitro co-culture of in vivo produced zygotes for a period of 5 days increased primary and secondary fiber cross-sectional area in plantaris muscle of fetus at day 125 of gestation. Conversely, Quigley et al. (Reference Quigley, Kleeman, Kakar, Owens, Nattrass, Maddocks and Walker2005) showed that the cross-sectional area of secondary fibers in ST muscle of singleton fetuses (on day 75 of gestation) was unaffected by maternal feed intake during the periconception period. Similarly, Costello et al. (Reference Crosier, Farin, Rodriguez, Blondin, Alexander and Farin2008) showed that maternal undernutrition during peri-implantation period did not influence fiber cross-sectional area in triceps brachii muscle of sheep fetuses. Results of the present study, agreeing with the findings of Wigmore and Stickland (Reference Wigmore and Stickland1983), confirm that secondary muscle fiber population in fetal muscles appear to be more sensitive to environmental impacts than primary muscle fiber populations. Therefore, it is possible that increased maternal feed intake during the periconception period changes the secondary fiber development in the fetal LD and ST muscles.
Quigley et al. (Reference Quigley, Kleeman, Kakar, Owens, Nattrass, Maddocks and Walker2005) found that despite high fed ewes (1.5×maintenance) during periconception (from 18 days before until 6 days after ovulation) period had an increased muscle fiber numbers in fetuses compared to low fed ewes (0.5×maintenance), maternal feed intake during the periconception period did not affect fetal LD, supraspinatus and semitendinosus muscle weights in fetuses. Costello et al. (Reference Crosier, Farin, Rodriguez, Blondin, Alexander and Farin2008) showed that maternal undernutrition in sheep during peri-implantation period reduced total myofibers numbers in triceps brachii muscle of the fetus and fast myofiber (defined as secondary muscle fibers) numbers tended to be lower. Maxfield et al. (Reference Maxfield, Sinclair, Broadbent, McEvoy, Robinson and Maltin1998a) reported that plantaris muscle weights of fetuses from co-cultured embryos were increased compared with controls at day 125 of gestation, but co-culture did not alter primary fiber number in plantaris muscle at day 61; however, the secondary to primary fiber ratio was increased at both day 61 and day 125. In the present study neither muscle fiber number in muscle cross section area nor muscles weight of the fetuses differed significantly between the treatments groups, but the tendency was only observed change in secondary to primary fiber ratio for ST muscle. In the present study, similar muscle weights of fetuses from good or poor fed ewes may be due to the stage of gestation at which fetuses were secured (day 90). Initiation of actual muscle hypertrophy is completed around day 115 of gestation in normal fetal sheep (Brameld et al., Reference Branca, Molle, Sitzia, Decandia and Landau2010). Greenwood et al. (Reference Annett and Carson1999) demonstrated that in well-grown fetal sheep the period of true muscle hypertrophy, when the ratio of muscle protein to DNA begins to increase rapidly, commences between 115 and 130 days of gestation. Therefore, it is a possibility that the differences may appear after this period. However, whether the altered fetal muscle development observed in the present study is permanent, remains to be established. Investigation of time points later in gestation, when myogenesis is completed, may reveal whether myogenesis continues longer in fetuses from undernourished ewes, allowing them to attain normal potential for muscle growth. Nevertheless, the evidence indicates that, even after myogenesis is completed, there are still marked differences in muscle fiber characteristics because of nutritional manipulations in sheep suggesting that the early embryonic period may irreversibly program myogenic potential (Maxfield et al., Reference Maxfield, Sinclair, Dunne, Broadbent, Robinson, Stewart, Kyle and Maltin1998b; Quigley et al., Reference Quigley, Kleeman, Kakar, Owens, Nattrass, Maddocks and Walker2005).
In the present study fetal body dimensions and organ development were not influenced by maternal nutrition level during periconception period. These results are in contrast to some of previous studies in which the differences in fetal development and body dimensions occurred as response to artificial environmental manipulations during early embryonic period (Kleemann et al., Reference Kleemann, Walker, Hartwich, Fong, Seamark, Robinson and Owens2001; Crosier et al., Reference Dwyer, Stickland and Fletcher2002; Cam et al., Reference Costello, Rowlerson, Astaman, Anthony, Sayer, Cooper, Hanson and Green2002). However, the unresponsiveness of gross fetal development to maternal nutrition level during periconception period in the present study is similar to those reported by others (Oliver et al., Reference Oliver, Hawkins, Breier, Van Zijl, Sargison and Harding2001; Edwards and McMillen, Reference Fahey, Brameld, Parr and Buttery2002; Quigley et al., Reference Quigley, Kleeman, Kakar, Owens, Nattrass, Maddocks and Walker2005). Although maternal nutrition level during periconception period did not affect gross measurements of fetus at mid gestation, programming of specific events may affect subsequent development and health of fetus. For example, Edwards and McMillen (Reference Fahey, Brameld, Parr and Buttery2002) and Gallaher et al. (Reference Greenwood, Slepetis, Hermanson and Bell1998) reported that maternal nutrition level during periconception period irreversibly affected the development of the hypothalamic–pituitary–adrenal and IGF axis, and were not influenced by subsequent nutrition during late gestation. Jaquiery et al. (Reference Jaquiery, Oliver, Honeyfield-Ross, Harding and Bloomfield2012) reported in a recent study that periconception undernutrition in sheep alters adult body composition only in male offspring. In the present study only male fetuses were used and alterations in some of the parameters may be due to sex-specific effects of periconceptional nutrition. It would be interesting to see whether effect of periconception nutrition on muscle fiber characteristics is evident in adult offspring from these pregnancies, as it affects body composition as reported by Jaquiery et al. (Reference Jaquiery, Oliver, Honeyfield-Ross, Harding and Bloomfield2012).
Bispham et al. (Reference Brameld, Greenwood and Bell2003) showed that IGF-I concentrations were lower in nutrient restricted ewes between 28 and 80 days of gestation. Maternal undernutrition during the periconception period may reduce maternal IGF-I levels resulting in delayed embryonic and subsequent fetal development, including myogenesis. On the contrary, high maternal feed intake for a prolonged period may increase embryonic IGFs and myogenesis could be directly affected. However in the present study, neither maternal nor fetal IGF-I concentrations were influenced by maternal nutrition level during the periconception period. Viñoles et al. (Reference Viñoles, Forsberg, Martin, Cajarville, Repetto and Meikle2005) reported that short-term maternal nutrition level from days 9 to 14 of estrus cycle did not affect plasma IGF-I concentrations.
Edwards and McMillen (Reference Fahey, Brameld, Parr and Buttery2002) reported that restricted periconception nutrition had no significant effect on neither maternal nor fetal plasma cortisol concentrations during late gestation (115 to 146 days of gestation) in ewes bearing singleton fetuses. Oliver et al. (Reference Oliver, Hawkins, Breier, Van Zijl, Sargison and Harding2001) determined that maternal undernutrition during periconception period did not alter the insulin levels in neither maternal nor fetal plasma at 119 days of gestation. Similarly, Branca et al. (Reference Brooke and Kaiser2000) showed that short-term dietary treatment from day 14 before day 2 after artificial insemination did not change maternal insulin concentrations in plasma after nutritional treatments. In the present study maternal nutrition level during the periconception period did not change fetal plasma cortisol and insulin concentrations on day 90 of pregnancy, but increased cortisol and decreased insulin concentrations in maternal plasma in undernourished ewes measured at day 7 of pregnancy. These results are consistent with the stress response to undernutrition, so release of cortisol from adrenal cortex may increase associated with decreased plasma insulin concentrations. Previous studies have indicated that long-term maternal undernutrition in sheep influences both maternal and fetal plasma free T3 and T4 hormone concentrations (Rae et al., Reference Rae, Rhind, Kyle, Miller and Brooks2002; Todini, Reference Todini2007). However, maternal nutrition intake during periconception period did not alter both maternal and fetal T3 and T4 concentrations in the present study.
In conclusion, results of the present study have shown that reduced maternal feed intake during the periconception period in naturally mated ewes may alter myogenesis without affecting fetal weights and organ developments in fetal sheep. Future studies may explain the underlying mechanisms involved in early embryonic development and programming of the muscle cell lineage.
Acknowledgements
The authors are grateful to Dr H. Onder for his guidance and advice in statistical analysis of the data. The authors also acknowledge the financial support by TUBITAK (TBAG-U/148) to carry out this study.