How do states and societies successfully incorporate immigrant populations? Although policy makers have grappled with this issue for the better part of a century, the question has gained renewed importance in Europe in the wake of increasing flows of refugees and internal labor migrants. In 2015, for instance, European Economic Area (EEA) countries reported that 33.7 million foreign nationals resided within their borders, representing a 43 per cent increase over 2005.Footnote 1
While much attention has focused on policies that foster economic integration, governments have also engaged in extensive efforts to promote the political and civic incorporation of immigrants. Historically, political rights have been closely tied to citizenship. Yet in recognition of the large (and growing) number of non-naturalized citizens within Europe, policy makers have sought other means to channel immigrant sentiments and concerns through formal political institutions. Building on normative arguments that non-citizens are ‘members of a community of shared political fate’,Footnote 2 and on the assumption that the exercise of political rights will accelerate engagement with and adaptation to the host society,Footnote 3 a number of European states have extended voting rights to foreign residents in local elections. Currently, all European Union (EU) states allow EU citizens to vote in local elections, while fifteen European states have extended some degree of local voting rights to third-country nationals.Footnote 4
Given the widespread adoption of foreign voting rights, it is surprising how little empirical evidence exists concerning whether rights extension promotes subsequent integration. This can be partly attributed to the selection bias researchers face when seeking to identify the effect of non-compulsory rights: individuals who take advantage of opportunities to express their preferences are precisely those who are most likely to exhibit positive integration outcomes. However, the existing evidence suggests that the consequence of rights extension goes beyond mere selection effects. For instance, Hainmueller, Hangartner and PietrantuonoFootnote 5 leverage a regression discontinuity related to citizenship referendums in Switzerland, in which ostensibly similar individuals were either granted or denied citizenship on the basis of a few votes. Studying long-term outcomes between the two groups, they find that naturalization has clear positive effects on subsequent political participation.
Why might the extension of local voting rights similarly promote integration? First, granting voting rights to foreign residents provides local politicians with embedded incentives to seek immigrant votes. These efforts – regardless of their ultimate success in influencing turnout – should raise levels of political knowledge and engagement among foreign residents.Footnote 6 Secondly, and perhaps more importantly, the extension of rights may increase levels of trust and promote identification with the host society, providing foreign residents with incentives to avoid political exclusion by engaging with civil society and local governments.Footnote 7
In this article, we extend this perspective by arguing that the timing of rights extension plays a key role in shaping integration trajectories. Immigrants’ level of civic and political engagement tends to be correlated with the length of their stay, likely due to the cumulative effect of exposure to host institutions,Footnote 8 or increasing social and economic capital.Footnote 9 However, regardless of the length of this socialization period, we hypothesize that formative early experiences will shape subsequent patterns of engagement in a path-dependent manner. The literature on habit formation and disruption finds that shocks to context may provide temporally limited opportunities to set new modes of behavior.Footnote 10 Consistent with this process, an emerging body of research has suggested the presence of an ‘integration window,’ during which the likelihood of integration is shaped by initial experiences in the host country. For instance, as-if random delays in access to labor markets have been shown to depress long-term economic integration among asylum seekers in Switzerland.Footnote 11 Thus if immigrants become habituated to exclusion from economic, political or civic institutions, these patterns may persist.
We thus expect that early opportunities to participate in the political process will influence immigrants’ subsequent level of engagement. In addition to creating a sense of active inclusion,Footnote 12 research in other contexts has suggested that initial political engagement is particularly habit forming.Footnote 13 For instance, MeredithFootnote 14 finds that California voters who were born six weeks too late to be eligible to vote in the 2000 US presidential election were less likely to vote in the subsequent presidential election, compared to voters who were born six weeks prior to the eligibility date.Footnote 15
While our empirical approach is similar to Meredith,Footnote 16 our design focuses on immigrant residency periods rather than age, and estimates the effect of early access on downstream integration outcomes. Examining the Norwegian context, which grants local voting rights to foreigners after three years of continuous residence, we draw on validated voting records and registry data for the complete population of eligible foreign residents in twenty-seven of the largest Norwegian municipalities. Leveraging the exogenous timing of elections relative to the exact date of immigrants’ arrival in Norway, we use a regression discontinuity (RD) design to identify the effect of early access to voting rights. Our findings suggest that immigrants who were just barely eligible for the 2011 elections (by a matter of days) participated at higher rates in the 2015 elections than their counterparts who missed the eligibility cutoff and had to wait an additional four years to vote in local elections. The positive results of early access are not strictly limited to electoral participation: while we find no evidence that early access to voting rights improves economic integration, we find suggestive evidence for spillover effects when assessing other aspects of integration such as continuing education, group membership and political engagement.Footnote 17
Immigrants arrive in Norway with vastly different experiences and motivations to integrate. As a result, it is reasonable to expect heterogeneity in the effect of early eligibility across national origin. In particular, we evaluate whether prior experiences with democratic institutions moderate the relationship between voting rights and subsequent integration. Theoretical and empirical research suggests that these varying life experiences matter: individuals systematically differ in their ‘democratic capital’, which may affect political preferences and modes of behavior.Footnote 18 Moreover, nationality of origin has been demonstrated to play an important role in moderating immigrants’ likelihood of acquiring citizenship and voting, even after accounting for socio-economic factors,Footnote 19 because immigrants may initially ‘transfer’ prior knowledge and modes of behavior to new contexts.Footnote 20
While the consensus is that immigrants from non-democracies will, on average, initially participate at a lower rate in elections,Footnote 21 we should also expect these individuals to be more sensitive to the timing of rights extension. Whereas migrants from strong democracies are familiar with democratic institutions and may have been habituated into voting or abstaining early on in their lives,Footnote 22 immigrants from dictatorships and weak democracies encounter a greater institutional and contextual shock that may promote subsequent behavioral change.Footnote 23 Our empirical results support this conditional relationship: we find that early access to voting rights sharply improves political participation by, on average, 8 percentage points among foreign residents originating from dictatorships or weak democracies. In contrast, early access appears to have a limited effect for immigrants with prior exposure to democratic institutions, who may already be habituated towards voting or abstaining.Footnote 24
These findings have important policy implications. When contrasted with lowering naturalization barriers, extending local voting rights to non-citizens may provide a potentially less radical tool to improve immigrants’ engagement with the host society. Although many European countries have recognized this possibility by extending local voting rights, eligibility criteria and the timing of rights extension vary extensively across states. Our findings suggest that policy makers seeking to improve the integration of foreign residents within these states should consider lowering the eligibility threshold. In particular, our results show that early access increases engagement for immigrants from non-democratic backgrounds, a group that typically integrates at a slower pace and faces substantial integration challenges.
INSTITUTIONAL SETTING
At first glance, the extension of local – rather than national – voting rights may seem inconsequential.Footnote 25 Yet in Norway, as in many other European states, local governments play an important role in shaping policy. Although Norway has a unitary system of government, in which all constitutional power rests in the national parliament (Stortinget), significant powers have been granted to the municipal level, particularly in the area of social provision. Core services and benefits of the Norwegian welfare state (such as social assistance payments, elementary and middle schools, local health care, eldercare and children’s welfare services) are in large part determined and administered by municipal governments, using revenues financed by local income and property taxes, as well as transfers from the central government. In 2012, these expenditures accounted for 14.8 per cent of national GDP.Footnote 26
Local governments are controlled by partisan municipal councils, which are democratically elected by the residents of each municipality. Local elections are held every four years, in September, two years after the last parliamentary elections. Although parliamentary elections receive a greater level of interest, media coverage and voter turnout, the level of decentralization in Norway ensures that local elections are nonetheless a major event in Norwegian politics. The election campaign is widely covered in the media, and voter turnout remains high: in 2015, for instance, 60 per cent of all eligible voters participated in local elections.
Eligibility rules for foreign nationals in Norway are among the most liberal in Europe, as local voting rights are granted to all foreign nationals after a brief period of residence. On the basis of reciprocal agreements, citizens of Nordic countries gain voting rights after less than three months of residence. More importantly, since 1983, all other foreign nationals with at least three years of continuous legal residence have had the right to vote in local elections. Although local voting rights for third-country nationals have been extended in other contexts, the Norwegian Government has followed the Nordic tradition of lowering eligibility barriers and actively promoting foreign voter participation. Voter registration is automatic, and individuals receive a letter in the mail a month before the elections informing them of their rights and the location of their polling place.
In the 2015 Norwegian local elections, 309,593 foreign nationals possessed voting rights, constituting 7.7 per cent of the electorate. Despite efforts to encourage voting among foreign nationals, immigrant turnout remained substantially lower than that of the native population. In the twenty-seven municipalities we study in this article, foreign nationals voted at a rate of 28 per cent, whereas 65 per cent of those with Norwegian citizenship participated.Footnote 27 When we limit the population of foreign nationals to those with non-Nordic citizenship (as we do in the main analysis), turnout among foreign voters declines to 25 per cent.
DATA
Our data are provided by the Norwegian Government, drawing on two distinct sources. We leverage data from a new program implemented in twenty-seven of Norway’s largest municipalities that recorded whether an individual participated in the 2015 local elections.Footnote 28 This dataset includes individual-level, validated records of voter participation for the complete population of foreign and native voters in these municipalities. In total, these data cover 42 per cent of the electorate, and 49 per cent of eligible third-country nationals (108,744 unique cases, after excluding Nordic citizens).Footnote 29 The majority of eligible foreign voters are from Europe. In the sample we rely on below, Poland (23 per cent), Germany (6 per cent) and Lithuania (6 per cent) are the largest European immigrant groups, while the largest non-Western groups are from Somalia (3 per cent), the Philippines (2 per cent) and Iraq (2 per cent).
Using unique identifiers, we match voting records with official registry data provided by Statistics Norway. These data include basic demographic and background characteristics for each individual, including age, gender, marital status and national origin, which we leverage to evaluate the validity of the RD design. The administrative data also include information on labor market participation, social assistance, union membership and continuing education, which we use as alternate dependent variables for our analysis. Finally, the administrative data include the precise date that the individual began their residency period in Norway. Since the national electoral authorities use these records to determine individual-level eligibility, they provide a highly accurate measure of whether an individual was eligible to vote in previous elections.
EMPIRICAL STRATEGY
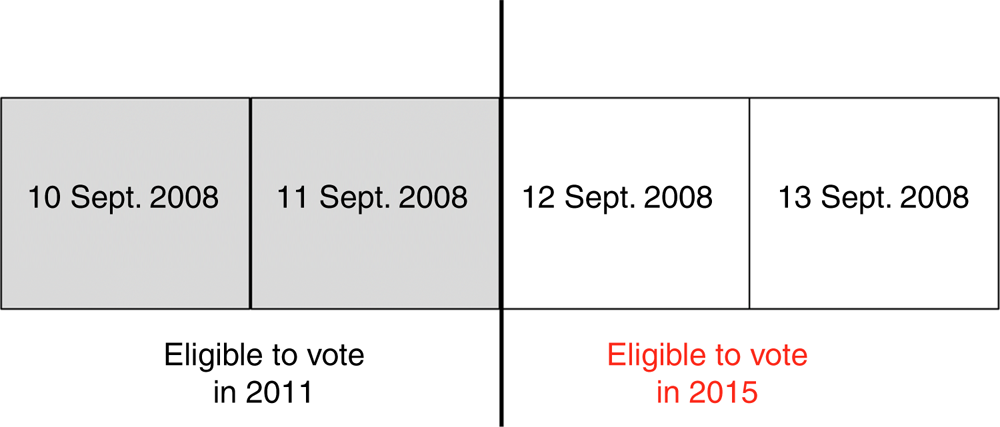
Immigrants coming to Norway have the right to vote in local elections after three consecutive years of residency. The 2011 local elections took place on 12 September, implying that immigrants had to arrive in Norway on or before 11 September 2008 in order to be eligible to vote. Election authorities have confirmed by personal communication that this rule was strictly enforced: those who arrived on 12 September 2008 had to wait an additional four years before they gained the right to vote in local elections. Figure 1 illustrates the rule. As we outline next, this institutional rule makes it possible to estimate the causal effect of early access to voting rights on subsequent political participation.
Eligibility is determined by date of arrival

We assume that each immigrant’s decision to vote in the 2015 election has two potential outcomes:  $$Y_{i} (1)$$
, which is the observed decision to vote if the individual was eligible to vote in the 2011 election, and
 $$Y_{i} (0)$$
, which is the observed decision if the individual was not eligible to vote in the 2011 election. The causal effect of eligibility to vote in 2011, τ i, is the difference between these two potential outcomes:
 $$\tau _{i} \,{\equals}\,Y_{i} (1){\minus}Y_{i} (0)$$
. Unfortunately, we can only observe one potential outcome for each immigrant i. If the immigrant arrived on or before 11 September 2008, we observe
 $$Y_{i} (1)$$
; if s/he arrived after 11 September 2008, we observe
 $$Y_{i} (0)$$
.
The key empirical problem is to obtain plausible counterfactuals for each scenario. To do so, we exploit the strict eligibility rule and leverage an RD design. Specifically, we estimate whether immigrants who barely missed the cutoff for eligibility (by a matter of days) participated at different rates in the 2015 elections compared to similar immigrants who arrived a few days earlier, and subsequently had early access to voting rights. By focusing on individuals close to this arbitrary cutoff, we can generate plausible counterfactuals:  $$E[Y_{i} (1)\!\mid\!X_{i} \,{\equals}\,c]$$
for those arriving on or prior to 11 September 2008 and eligible to vote, and
 $$E[Y_{i} (0)\!\mid\!X_{i} \,{\equals}\,c]$$
for those arriving after 11 September 2008. Provided that the two groups of immigrants are similar, the distance between the means at the cutoff will provide a reasonable estimate of the effect of early voting rights on participation in the 2015 local elections.
Whether  $$\hat{\tau }$$
provides an unbiased estimate of τ, the average effect of early eligibility, hinges on individuals’ ability to influence their position with respect to the cutoff. In our case, some migrant groups need visa approval to enter Norway, but other groups are able to influence the date on which they arrive in Norway. However, despite this degree of individual agency, it is highly implausible that the decision to migrate was based on eligibility to vote in the next round of local elections. Most likely, prospective immigrants had no knowledge of the eligibility date when they arrived in Norway, which makes our RD approach similar to an experiment in which immigrants are as-if-randomly assigned into treatment and control groups. However, this assumption only holds close to the eligibility date, since changes in immigration flows might imply that the characteristics of immigrants – and hence the average potential outcomes – deviate as we move away from the cutoff date.Footnote 30
Accordingly, we estimate  $$\tau _{i} $$
using a local polynomial, which we fit to narrow bandwidths around the cutoff date. Given that the data include the precise day on which an individual registered in Norway, our design permits these bandwidths to be highly granular. Nevertheless, the selection of the optimal bandwidth remains important: while the precision of the treatment estimate increases with the size of the bandwidth, the bias at larger bandwidths might increase. We follow recent recommendations and developments in RDD methodology and select the optimal bandwidth using a data-driven, non-parametric approach.Footnote 31 In our main analyses, we rely on the Calonico, Cattaneo and TitiunikFootnote 32 approach to select the bandwidth, but report results using an alternative approach. Given recent advice on the dangers of over-fitting when using more than two polynomials,Footnote 33 we rely on linear or quadratic specifications using a triangular kernel.
RESULTS
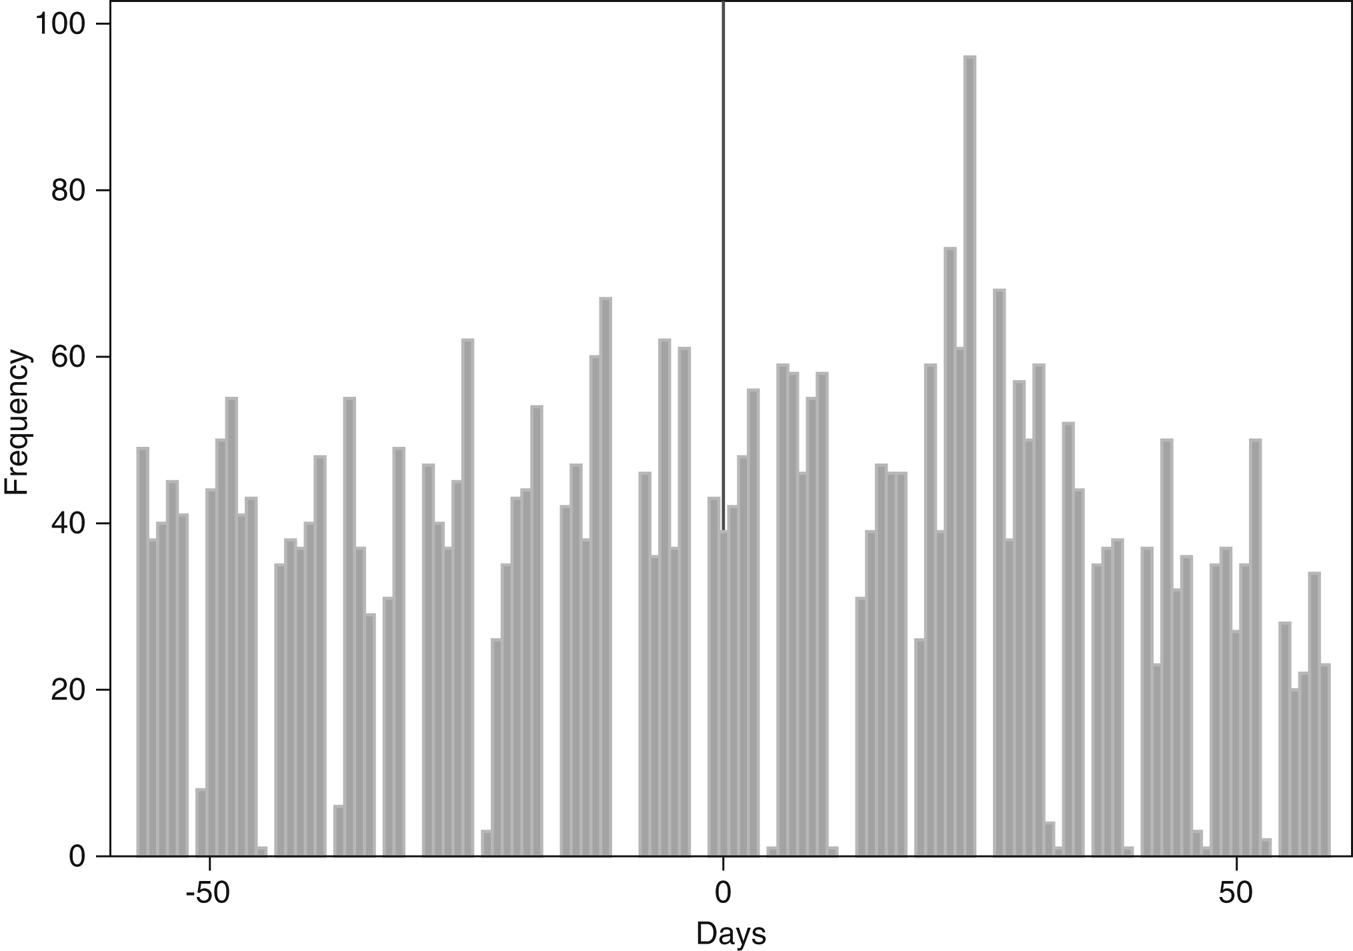
Before presenting the estimates, we first verify the RD design. Figure 3 plots the daily number of immigrants registered in Norway around the cutoff date of 11 September 2008. The figure demonstrates that immigrants are usually registered on weekdays (11 September 2008 fell on a Thursday), and that the daily number of registrations varies between forty and sixty individuals.Footnote 34 Relatively few foreigners registered on 11 September (39), but the same is true for 10 September (42) and 12 September (43). There is a spike in number of immigrants on 9 September and 8 September, but similar upticks can be observed for most weeks, reflecting the fact that immigrants are likely to be registered on Mondays and Tuesdays. We argue that this distribution suggests that immigrants did not sort around the eligibility date. Our interpretation is strengthened by Cattaneo et al.’s formal density test,Footnote 35 which provides no evidence of a discontinuity in the timing of arrival (p=0.32).
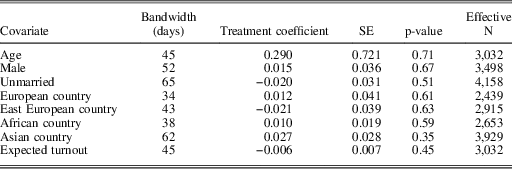
Next we run the analysis on a set of pre-determined covariates. If immigrants are as-if randomly assigned to either side of the eligibility date, we should not observe any discontinuities with respect to background characteristics: immigrants who were barely eligible should resemble those who were ineligible to vote in the 2011 elections. In Table 1, we report estimates from the RD design, using optimal bandwidths. Additionally, Appendix Figure A-7 graphs each covariate using first- and second-order polynomials and assesses alternate bandwidths.Footnote 36 In addition to exploring discontinuities for age, gender, civic status and regional background, we rely on information on voter turnout in different immigrant groups in the 2007 election to calculate the expected probability of turnout for each immigrant.Footnote 37 Using these probabilities, we test for imbalance across the threshold. We find no evidence that individuals who were eligible to vote early were drawn disproportionately from nationalities with high participation rates. We also assess balance for all large nationality groups within the sample (Table A-15). Across each specification, we find no significant discontinuities, suggesting that immigrants on either side of the arbitrary cutoff are statistically similar.Footnote 38
RD on Pre-determined Covariates

Note: local polynomial.
Did Early Eligibility Influence Electoral Participation?
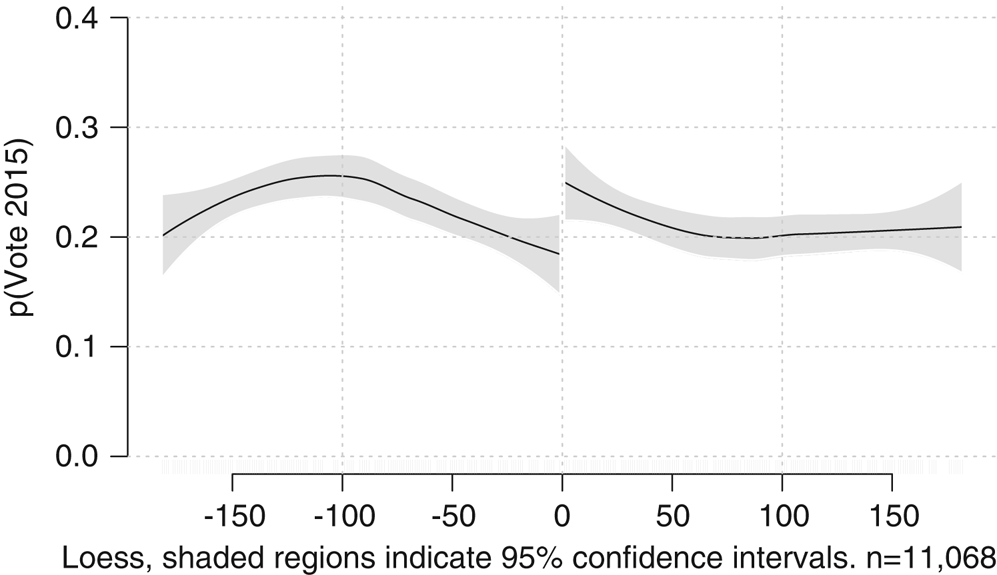
Given that individuals are similar on either side of the threshold, we can plausibly identify whether early access to voting rights generated differences in subsequent political participation. Figure 2 fits a flexible local polynomial to either side of the cutoff, using a half-year window. A clear discontinuity in 2015 electoral participation is visible between individuals who barely missed eligibility for the 2011 elections (left-hand side of plot), and those who were eligible to vote (right-hand side of plot). Given the balance in background characteristics between immigrants close to the cutoff (Table 1), this discontinuity indicates the effect of early eligibility on subsequent behavior.
Frequency of immigrants around 11 September 2008

Local polynomial fit: probability of voting in the 2015 election Note: loess, shaded regions indicate 95 per cent confidence intervals (n=11,068).

In Table 2, we formally estimate the degree to which early access to voting rights affected turnout in the 2015 local elections, using the RD approach. Given the linear trend of the data close to the threshold, we use single order polynomials (see Appendix Figure A-2). We first present results using a half-year cutoff on either side of the discontinuity, and then switch to optimal bandwidths.Footnote 39 Using the latter approach, the local linear estimate suggests that early access to voting rights increased subsequent participation by 5.9 percentage points, plus or minus 5.6 percentage points. However, when we switch from the mean squared error criteria to the Imbens-Kalyanaraman coverage error rate criteria, which utilizes narrower bandwidths, the treatment estimate drops to 3.9 percentage points, and the effect is less precisely estimated. Thus while the data suggest that eligibility to vote has a positive effect on subsequent electoral participation, the variance is likely too large to allow us to conclude that there is a global effect of early access on subsequent electoral participation for all categories of foreign residents.
RD on the Probability of Voting in the 2015 election (All Immigrants)

Note: local polynomial. MSE=mean squared error; CER=coverage error rate. **p<0.05
Early Access and Prior Exposure to Democracy
Immigrants in our sample are from very different backgrounds, which leads us to expect heterogeneity in response to early voting rights. Given that the focus of our analysis is on political behavior, we are particularly interested in the degree to which immigrants may already be habituated into modes of democratic participation. Although some immigrants within our sample arrived in Norway from dictatorships, war-torn states or fragile democracies, others migrated from countries with similar political institutions as Norway. According to our argument, immigrants with less prior exposure to democratic institutions should be more responsive to the treatment, given that these groups encounter a greater contextual shock that may promote subsequent behavioral change.
We use two approaches to measure foreign residents’ prior experiences with democracy.Footnote 40 The first is a ‘cultural’ approach. Drawing on data on each immigrant’s nationality, we leverage an indicator provided by the Economist Intelligence Unit (EIU) to measure the strength of democratic culture in each origin country in 2007 (the year prior to arrival). Using this indicator, we split the sample according to whether individuals arrived in Norway from countries with weak and strong democratic cultures, respectively.Footnote 41 Secondly, we adopt an institutional approach based on a dichotomous coding of democracy within each origin country. We utilize Boix, Miller and Rosato’s Political Regimes Dataset to measure the duration of democracy for each country year.Footnote 42 Using this classification of democratic years, we follow Fuchs-Schündeln and Schündeln’sFootnote 43 motivation and derive an individual-level measure of democratic exposure in 2008. To avoid arbitrary cutoffs, we rely on a binary measure that indicates whether an individual was born and raised in a stable democracy, or whether they experienced periods of dictatorship prior to emigrating to Norway.
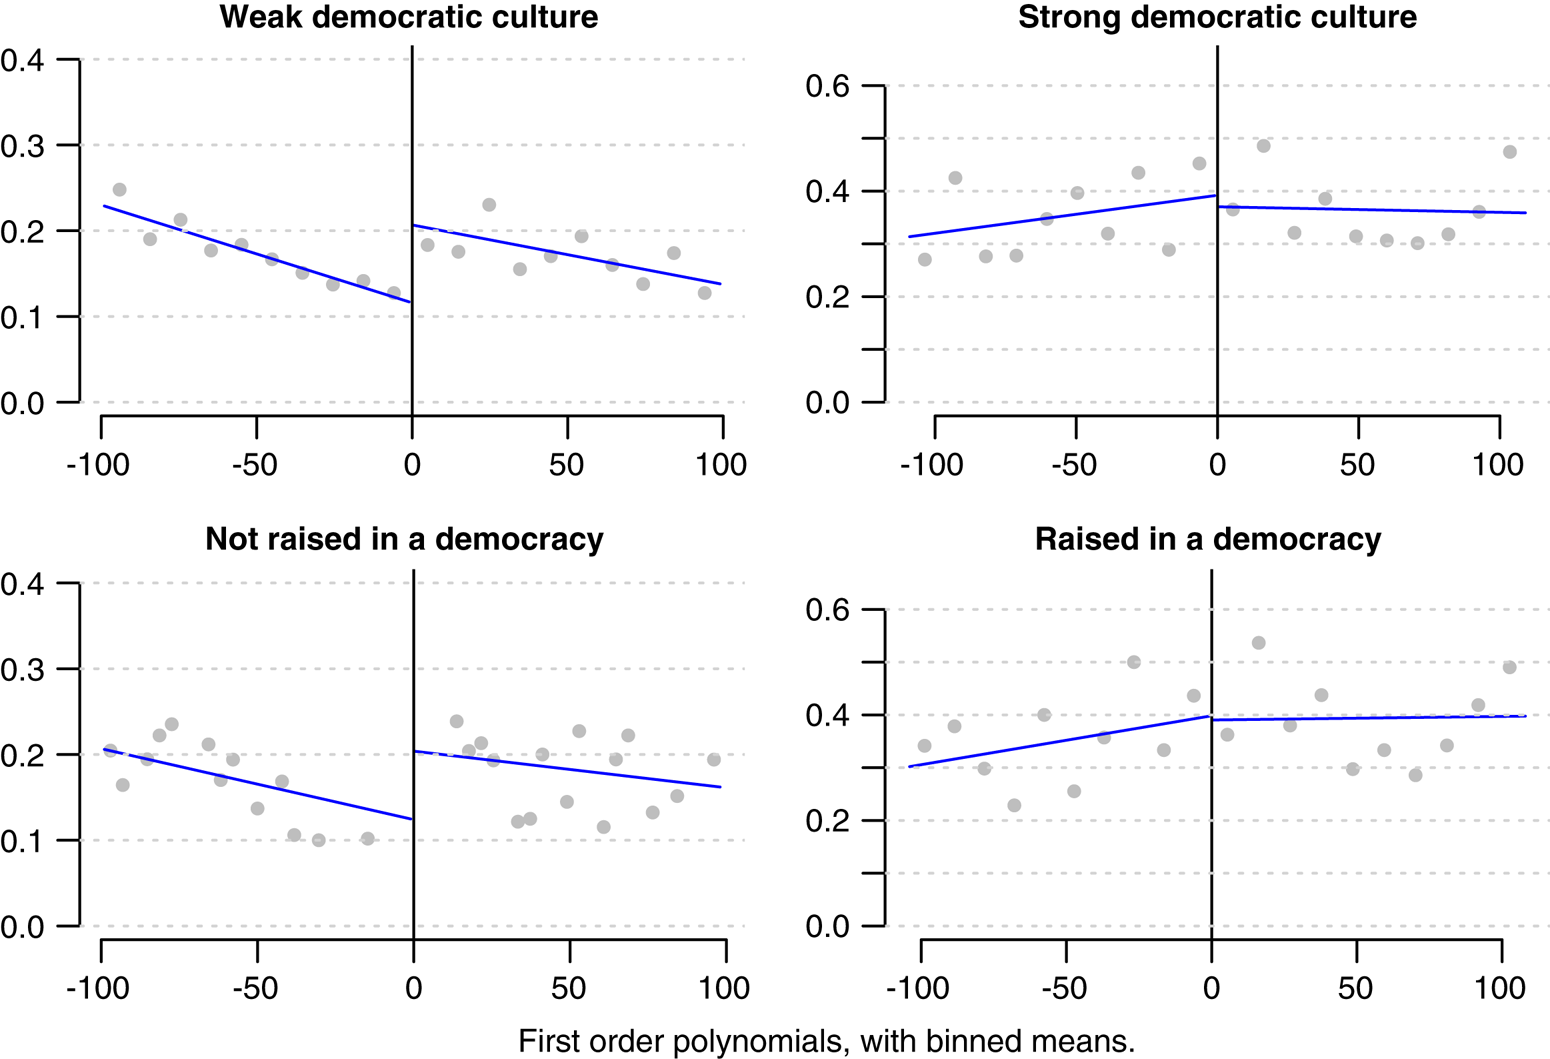
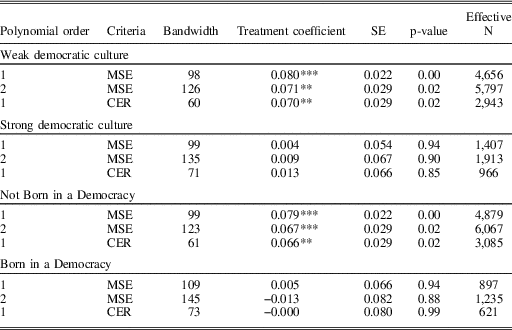
Table 3 presents RD estimates for each subsample.Footnote 44 The results suggest that immigrants’ level of democratic capital matters: early eligibility sharply increases subsequent participation rates for individuals with low exposure to stable democracy. For instance, the results suggest that immigrants from countries with weak democratic cultures were 8.0 percentage points, plus or minus 4.4 percentage points, more likely to vote in the 2015 elections compared to similar immigrants who missed the 2011 eligibility cutoff. These results are consistent with those obtained from the institutional approach, which suggests that individuals who experienced periods of non-democracy were 6.8 percentage points more likely to vote following early access to political institutions. Importantly, null results are obtained for individuals who migrated from strong democratic cultures or were raised in a democracy, suggesting that the positive effect of early eligibility may be conditional on prior exposure to democratic norms and institutions.Footnote 45 This conditional relationship is visible in Figure 4, which reveals sharp discontinuities for the group of migrants with low exposure to democracy, and no discontinuities for foreign residents originating from developed democracies.
RD on the probability of voting in the 2015 election (subset analysis) Note: first-order polynomials, with binned means.

RD on the Probability of Voting in the 2015 election (Subset Analysis)

Note: local polynomial. MSE=mean squared error; CER=coverage error rate. ***p<0.01, **p<0.05
Given that immigrants likely differ along other dimensions correlated with regime type, the research design does not permit us to establish that prior exposure to democracy is the only factor shaping divergent responses to voting rights extension.Footnote 46 However, the effect of heterogeneity does not appear to be driven by observable confounders. Similar results are obtained when examining discontinuities in residuals after partialling out pre-treatment background characteristics. Moreover, as Appendix Table A-7 demonstrates, the findings remain consistent when the analysis is restricted to young immigrants within each subsample.Footnote 47
The results are also robust to a variety of additional tests. When performing a placebo evaluation that alters the timing of cutoff eligibility, no significant treatment effects can be detected (Table A-8), suggesting that the findings do not represent a false positive. Parallel results are obtained for a placebo estimating the treatment effect for a group unaffected by the cutoff, namely immigrants from the Nordic countries who receive voting rights three months after arrival (Table A-8). Finally, the results remain similar when using alternate measures of democratic exposure (Table A-11), or when further subsetting the data. As seen in Table A-12, for instance, the largest treatment effects are visible for immigrants arriving from dictatorships.
DISCUSSION
What explains the positive relationship between early access to voting rights and subsequent political engagement? Evaluating the evidence, we argue that the results are consistent with a process of habit disruption and formation. Upon exposure to new institutions and norms, immigrants are likely to establish new modes of interaction with the state and society.Footnote 48 Yet this period is temporally limited: as immigrants become accustomed to life in the host society, the opportunity for habit disruption narrows, and initial modes of behavior are likely to persist in a path-dependent manner.
Before evaluating further implications of this argument, we focus on an alternative explanation and assess whether the gap in political participation follows from practical advantages possessed by early voters. For instance, it is possible that immigrants who were eligible for the 2011 elections received additional information or experienced higher levels of mobilization than their counterparts who missed the 2011 cutoff. But while gaps in information or mobilization have been found to influence long-term patterns of political participation in other contexts,Footnote 49 this mechanism is unlikely to be driving the results in the Norwegian case. Voter registration is automatic in Norway, and immigrants receive a letter indicating the location of their polling place prior to every election.Footnote 50 It is perhaps more plausible that new immigrants or those from non-democratic states were selectively mobilized by local governments and unions. Given the availability of registry data indicating eligibility, it is possible that local actors focused mobilization efforts on specific types of immigrants as an informational shortcut.Footnote 51 This mechanism would most directly affect turnout in the first election in our sample (2011), but if outreach is targeted rather than broad, this differential may have persisted over time.
Although direct data on local mobilization efforts do not exist, we assess this hypothesis using administrative data. First, we evaluate whether individuals received social assistance payments from local governments. A discontinuity will partially reflect (a lack of) labor market integration. However, social assistance is means tested and indexed at the local level, implying that local politicians have some discretion to influence levels and access to social assistance transfers. If immigrants were systematically mobilized by the delivery of local transfers and services, we should observe a discontinuity in benefit recipiency. Secondly, we evaluate whether a discontinuity exists in union membership. Although union membership is similarly conditional on employment, unions play a mobilizing role by providing political information to members. The results for both measures appear in Table A-9, measured prior to the 2011 election. No clear discontinuities are visible for union membership and benefit recipiency across the subsamples, suggesting that if mobilization was active, it was broad rather than targeted at specific types of immigrants.
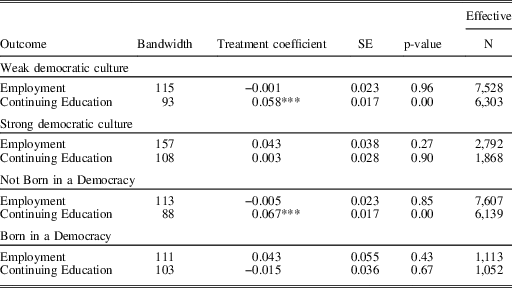
If immigrants with early access to voting rights do not appear to have experienced discontinuities with respect to information or mobilization, the process driving increased engagement over time likely reflects individual-level habituation to democratic society. To further evaluate this possibility, we turn to several alternative measures of integration. We first assess two validated outcomes present in the administrative data: whether an immigrant was successful in obtaining employment, and whether they enrolled in a voluntary education program (both measured five years after arrival).Footnote 52 From an integration perspective, the latter indicator is particularly important: educational programs are likely to substantially increase the speed of language acquisition and expand employment opportunities beyond sectors typically dominated by new immigrants.
As seen in Table 4, early access to voting rights appeared to have no discernable effect on labor market behavior. However, immigrants from non-democratic contexts were substantially more likely to be enrolled in continuing education if they were eligible to vote in the 2011 elections (+5.8 per cent). Although the data do not permit a direct assessment of the causal relationship that underlies this pattern, it suggests an increased motivation to integrate among immigrants who may otherwise face barriers to success within Norwegian society.
RD on Administrative Outcomes Measured in 2013

Note: local polynomial. This sample is based on the total population of immigrants (arriving around the cutoff date in 2008) who lived in Norway in the beginning of 2013. This sample is larger than the one used in the analysis of turnout because of out-migration between January 2013 and September 2015, and because of the eligibility criteria of continued residency in the 2015 sample. ***p<0.01
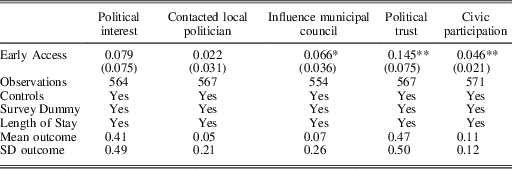
Given that administrative registries only cover a subset of relevant outcomes, we next evaluate survey data to assess other dimensions of engagement. This approach has its limits: representative surveys only include a small number of immigrants and tend to ask the year rather than the precise date of arrival in Norway. Nevertheless, two recent surveys – Innbyggerundersøkelsen (‘The Citizen Survey’) from 2013 and 2015 – permit a coarse analysis of spillover effects to other aspects of political and civic integration. In these surveys, immigrants were asked the number of years they have lived in Norway, allowing us to construct two cohorts based on reported time of arrival. We define the treatment group as recently eligible immigrants, which includes those arriving in 2007, as well as those arriving in 2008 who report being eligible to vote in 2011. By contrast, the control group refers to those arriving in 2009 and those arriving in 2008 who report not being eligible.
We regress the treatment group indicator on five outcomes. Three outcomes measure aspects of political behavior: Political interest, whether the respondent has contacted a local politician and whether the respondent has attempted to influence a decision of the local government. The fourth outcome is general political trust in elected Norwegian officials, and the final outcome, civic participation, counts the number of civic associations the respondent has joined (re-scaled between 0 and 1).
Table 5 presents the regression results. Although the coarse data on time of arrival and small sample sizes imply that the findings should be viewed with caution, the results are suggestive of weak spillover effects. The difference between the treatment and control groups is imprecisely estimated for several dimensions, but statistically significant for attempts to influence the local municipal council, trust in politicians and the civic participation index.Footnote 53 When viewed in tandem with the higher rates of political participation observed among this group, these findings are consistent with the argument that initial habits of engagement with the host society (or lack thereof) may persist.
Survey Evidence: Political and Social Integration (OLS)

Note: robust standard errors in parentheses. All regressions include controls for age, gender, level of education, year of arrival and a survey-year dummy. For similar results when examining 2008 arrivals only, see Table A-10. Respondents were asked to express their political interest and political trust on a scale from −3 to 3. We coded positive answers as 1, and 0 otherwise. Civic participation: Respondents were asked about membership in resident associations, sports associations, music associations, trade unions, political associations, religious associations and ‘other associations’. To ease interpretation we re-scaled between 0 (member of none) and 1 (member of all types of associations). **p<0.05, *p<0.1
CONCLUSION
Faced with expanding foreign resident populations, European policy makers have increasingly sought means to promote immigrant integration. This process has resulted in the widespread extension of social and civic rights to migrants,Footnote 54 and more recently, the extension of local voting rights to foreign resident populations. Although this trend is increasingly prevalent and enshrined in EU law, the effects of extending the franchise to foreign voters nevertheless remain unclear. Does the extension of local voting rights foster immigrant incorporation? And to what extent do the timing and conditions attached to voting rights influence subsequent integration trajectories?
This article builds upon a growing literature that emphasizes that early access to institutions is consequential. Leveraging a natural experiment related to the exogenous timing of elections relative to immigrant arrival dates, we have demonstrated a causal relationship between early access to local voting rights and subsequent patterns of political engagement. Immigrants who received voting rights in 2011 participated at substantially higher rates in the next round of elections relative to similar immigrants who missed the eligibility cutoff. These effects appear to be broad rather than narrow, with spillovers to several alternate integration indicators. By demonstrating a clear connection between early access and subsequent engagement, these results thus nuance existing findings that immigrants’ political integration is shaped by socio-economics, length of stay and citizenship regimes.
However, our results suggest important heterogeneity in the effect of early access to institutions. Individuals from unstable democracies or dictatorships experience clear, positive effects. In contrast, migrants with prior exposure to stable democracy do not appear to adjust their political participation in response to early access. While one might interpret this conditional relationship as evidence that early access to voting does not unambiguously improve outcomes, it is important to keep in mind that immigrants who clearly benefit from early access – namely, those hailing from war-torn or weak states – are precisely those who often face the highest barriers to successful integration. As a result, a positive interpretation of our results is that the early extension of political rights provides a useful policy tool to improve vulnerable groups’ engagement and interaction with the host society. Given that all immigrants in our sample eventually receive voting rights, these treatment effects likely represent a lower bound on the integration effect of extending voting rights to foreign populations.
These findings are subject to some limitations. First, while our data demonstrate that immigrants have higher rates of turnout in local elections seven years after arrival, the time horizon is necessarily limited by the recency of the data. We expect political participation to persist, but future studies are needed to assess truly long-term effects. Secondly, our register-based measures cover a subset of outcomes under the rubric of integration. It is possible that engagement with local democracy stimulates other aspects of integration, such as social networks and identification with the host society. Our study suggests a useful foundation for subsequent analysis linking eligibility data with larger, targeted surveys of the immigrant population.
Despite these limitations, our findings have direct policy implications. When seeking to incorporate immigrants, policy makers should be cognizant of the fact that opportunities to integrate may be temporally limited. If foreign residents face delays in accessing institutions, this exclusion may persist, stymying subsequent efforts to incorporate these groups. Thus while the question of whether to extend political rights to migrants remains a normative and practical issue, our empirical results suggest that countries that choose to extend such rights should do so as expediently as possible.