Significant Outcomes
-
Spectral ratios alpha1/theta and alpha1/delta in the posterior cingulate cortex may differentiate MCI related to AD.
Limitations
-
Research markers indicating neuronal injury are absent in this study.
-
The medications taken during the intervention are not controlled and may affect the results.
Introduction
Mild cognitive impairment (MCI) is intermediate between normal cognition and dementia and is characterised by objective evidence of cognitive impairment yet not fulfilling the definition of dementia. The causes of MCI are remarkably diverse, and among them Alzheimer’s disease (AD) is the leading one. AD has prolonged preclinical and MCI stages (ADMCI) (Caselli and Reiman, Reference Caselli and Reiman2013). In the early phase, episodic memory and learning are the most affected neuropsychological functions. With the progress of the illness, cognitive decline from a previous level of performance may affect other domains, including attention, executive function, language, and social cognition (Albert et al., Reference Albert, Dekosky, Dickson, Dubois, Feldman, Fox, Gamst, Holtzman, Jagust, Petersen, Snyder, Carrillo, Thies and Phelps2011). For MCI not related to AD (nonADMCI), the neuropsychological impairment can be very heterogenous and may originate from various medical conditions, such as Parkinson’s disease (PD), fronto-temporal dementia, and cerebrovascular events. The preclinical stage of AD is clinically silent, but the pathophysiological impact has started to accumulate, which could occur as early as the fourth decade of life (Caselli and Reiman, Reference Caselli and Reiman2013). Early intervention relies on early and accurate diagnosis.
Given that clinical electroencephalography (EEG) is cost-effective, non-invasive, and informative, quite a few researchers have attempted to retrieve neural markers from the recordings to study the progression and differentiation of MCIs (Moretti et al., Reference Moretti, Frisoni, Fracassi, Pievani, Geroldi, Binetti, Rossini and Zanetti2011, Reference Moretti, Zanetti, Binetti and Frisoni2012, Babiloni et al., Reference Babiloni, Del Percio, Lizio, Noce, Cordone, Lopez, Soricelli, Ferri, Pascarelli, Nobili, Arnaldi, Fama, Aarsland, Orzi, Buttinelli, Giubilei, Onofrj, Stocchi, Stirpe, Fuhr, Gschwandtner, Ransmayr, Caravias, Garn, Sorpresi, Pievani, D'antonio, De Lena, Guntekin, Hanoglu, Basar, Yener, Emek-Savas, Triggiani, Franciotti, Frisoni, Bonanni and De Pandis2017). For example, Moretti et al. explored the theta/gamma and alpha3/alpha2 ratios to identify MCI patients who progressed to AD (or not) (Moretti et al., Reference Moretti, Frisoni, Fracassi, Pievani, Geroldi, Binetti, Rossini and Zanetti2011). Babiloni et al. found that the posterior alpha2 and alpha3 may possess diagnostic values in distinguishing MCI patients of AD from PD origins (Babiloni et al., Reference Babiloni, Del Percio, Lizio, Noce, Cordone, Lopez, Soricelli, Ferri, Pascarelli, Nobili, Arnaldi, Fama, Aarsland, Orzi, Buttinelli, Giubilei, Onofrj, Stocchi, Stirpe, Fuhr, Gschwandtner, Ransmayr, Caravias, Garn, Sorpresi, Pievani, D'antonio, De Lena, Guntekin, Hanoglu, Basar, Yener, Emek-Savas, Triggiani, Franciotti, Frisoni, Bonanni and De Pandis2017). The results are modest but promising, and their prospective and predictive values have been addressed (Moretti et al., Reference Moretti, Zanetti, Binetti and Frisoni2012). This study developed novel neural markers from (resting) EEG to differentiate ADMCI and nonADMCI based on two well-acknowledged observations, that is, background slowing and early abnormality in the posterior cingulate cortex (PCC). In brief, we hypothesised that compared with nonADMCI, the spectral ratios of alpha1 to delta and to theta in the PCC were lower for ADMCI, detailed below.
Background slowing is a non-specific condition for neurodegenerative disorders, which is associated with enhanced spectral power in the theta and/or delta frequencies. Babiloni et al. observed attenuated posterior alpha power, especially at alpha1, in amnestic MCI patients, named “alpha deterioration” (Babiloni et al., Reference Babiloni, Del Percio, Lizio, Marzano, Infarinato, Soricelli, Salvatore, Ferri, Bonforte, Tedeschi, Montella, Baglieri, Rodriguez, Fama, Nobili, Vernieri, Ursini, Mundi, Frisoni and Rossini2014). In addition, it is recognised that abnormality in posterior part of default-mode network (DMN), especially PCC as a key hub, occurs early during the disease course of AD (Caselli and Reiman, Reference Caselli and Reiman2013). For example, positron emission tomography (PET) scans revealed reduced glucose metabolism in the PCC, inferior parietal cortex (IPC), and middle temporal gyrus (MTG) (Del Sole et al., Reference Del Sole, Clerici, Chiti, Lecchi, Mariani, Maggiore, Mosconi and Lucignani2008, Marcus et al., Reference Marcus, Mena and Subramaniam2014). Put the evidence together, we surmised that neural markers by taking the spectral ratios of alpha1 to theta and to delta (widening the between group differences) in the PCC (incorporating network information; region of interest [ROI]) may help boosting the diagnostic power.
To substantiate the ROI-informed approach, exact low-resolution brain electromagnetic tomography (eLORETA) was adopted to analyse the EEG data, in contrast to surface- or topography-based counterpart (Pascual-Marqui et al., Reference Pascual-Marqui2007; Jurcak et al., Reference Jurcak, Tsuzuki and Dan2007). Frequency-wise normalisation strategy was applied to make the regional change more prominent (see Methods and Discussion). Amyloid PET scan as well as cortical functional assessments using comprehensive neuropsychological testing was administered to confirm the diagnoses. Exploratory analyses were conducted to the other two neural nodes in posterior DMN, that is, IPC and MTG.
Materials and methods
Participants, clinical, and neuropsychological evaluation
The data were collected from 2015 to 2017, during which the MCI patients visited NCI for neuropsychological assessment, neurobiological evaluation, and cognitive remediation, largely referred from regional hospitals and clinics. Compiled standardised neuropsychological tests were administered for each participant (iCODE system). Before obtaining signed informed consents, all procedures and equipment used were explained to the subjects. The authors retrospectively analysed the data set registered at NCI. To be enlisted in the MCI group, the participants must be 55 years or older and did not fulfill the diagnostic criteria for dementia. Scores on cognitive impaired domains were at least 1.5 standard deviations below the mean for their age and education matched peers based on normative data. The study was approved by an independent IRB (Pearl IRB; https://www.pearlirb.com).
Referring to previous literature (Albert et al., Reference Albert, Dekosky, Dickson, Dubois, Feldman, Fox, Gamst, Holtzman, Jagust, Petersen, Snyder, Carrillo, Thies and Phelps2011), the diagnostic criteria for ADMCI for this research were summarised below: (1) a change in cognition reported by patient, informant or clinician; (2) objective evidence of decline in episodic memory and learning, with memory test score(s) at least 1.5 SD below the mean of age-matched norms; (3) steadily progressive, gradual decline in cognition, without extended plateaus; (4) the disturbance is not better explained by cerebrovascular disease, another neurodegenerative disease, the effects of a substance, or other mental, neurological, or systemic disorders (interviewed by author GT and screened using The Neuropsychiatric Inventory Questionnaire); and (5) no evidence of mixed aetiology. MCI patients who did not meet ADMCI criteria constituted the nonADMCI group.
PET scan and analysis
PET scans were performed by a collaborative institution, University Radiology at Robert Wood Johnson New Brunswick. Before PET imaging, an intravenous catheter was placed in an antecubital vein for radiotracer injection. Another catheter was inserted into a radial artery for dynamic arterial blood sampling. To minimise head motion, the participant was fitted with a thermoplastic mask which was mounted to the scanner table. The participant was positioned in the scanner with imaging planes parallel to the cantho-meatal line and primary areas-of-interest (including cerebellum) within the central 7 cm of the FOV. The transmission scan was followed by a 90 min dynamic high specific activity PIB PET study (1,000 mCi/umol, 10–15 mCi injection over 20 s, 34 frames: 4 × 15, 8 × 30, 9 × 60, 2 × 180, 8 × 300, 3 × 600 s; 4 + 8 + 9 + 2 + 8 + 3 = 34). Heparinised arterial blood (2.5 mL) was centrifuged for 2 min at 12,900 g, and HPLC methods were used to calculate radiolabeled peaks.
PET data were reconstructed using filtered back-projection and corrected for photon attenuation (68Ge/68Ga rods), scatter, and radioactive decay. The final reconstructed image resolution was expected to be approximately 6 mm with respect to FWHM. Images were analysed using CapAIBL (Bourgeat et al., Reference Bourgeat, Dore, Fripp, Villemagne, Rowe and Salvado2015), a web-based freely available MRI-less methodology, to generate PET standardised uptake value (SUV) and ratios (SUVR). SUVs were summed and normalised to the cerebellar cortex SUV to yield the target-region to reference-region SUVR.
QEEG recording and ROI-based analysis
Following international 10–20 system, Brainmaster device (https://brainmaster.com/) was used to acquire 10 min eye-closed digital EEG data at 256 samples/s with linked-ear reference. It is a well-established phenomenon that the power of alpha rhythm was higher during eyes-closed compared to eyes-open condition, especially in the parietal and occipital regions. The software platform NeuroGuide (Key Institute and Applied Neuroscience Inc., http://appliedneuroscience.com/) was used to register and prune the EEG data. The clean EEG data (various artefacts, especially electro-ocular activities, were detected and deleted semi-automatically using artefact-free template matching method provided by NeuroGuide) were filtered at 2–45 Hz following Moretti et al. (their research revealed that higher delta power may differentiate several MCI groups, [Moretti et al., Reference Moretti, Zanetti, Binetti and Frisoni2012]), segmented to 2.5 s epochs (Levy, Reference Levy1987), then exported to eLORETA for subsequent ROI analysis. The eLORETA is a tomographic method for electric neuronal activity, where localisation inference is based on images of standardised current density, with zero localisation error. The eLORETA is an improved version of standardised LORETA by incorporating optimised lead field weights and may provide a more precise localisation regarding deeper structures. The power spectrum of fast delta (2–4 Hz), theta (4–8 Hz), alpha1 (8–10 Hz), alpha 2 (10–12 Hz), beta1 (12–18 Hz), beta2 (18–22 Hz), and beta3 (22–30 Hz) were derived by Fast Fourier Transformation (Benoit et al., Reference Benoit, Daurat and Prado2000). With eLORETA, these neural informatics from the electrodes (scalp) can be projected to a Talairach brain template (6,239 Gray matter voxels). Three ROIs of posterior DMN were selected: PCC (92 voxels), IPC (345 voxels), and MTG (344 voxels). Averaged current densities were extracted from these ROIs (Babiloni et al., Reference Babiloni, Del Percio, Lizio, Marzano, Infarinato, Soricelli, Salvatore, Ferri, Bonforte, Tedeschi, Montella, Baglieri, Rodriguez, Fama, Nobili, Vernieri, Ursini, Mundi, Frisoni and Rossini2014, Reference Babiloni, Triggiani, Lizio, Cordone, Tattoli, Bevilacqua, Soricelli, Ferri, Nobili, Gesualdo, Millan-Calenti, Bujan, Tortelli, Cardinali, Barulli, Giannini, Spagnolo, Armenise, Buenza, Scianatico, Logroscino, Frisoni and Del Percio2016).
In neuroimaging research, it is common to adopt normalisation procedure to discount interindividual variability. Frequency-wise normalisation forces the sum of adjusted power (of a defined frequency band) across all cortical voxels equals a fixed positive number (e.g. voxel number or 1). The normalisation strategy may render the regional change more prominent. For example, assume subjects A and B has similar spatial distributions in terms of alpha power at baseline. Decreased regional alpha power in subject A after entering MCI stage, say in the PCC, will be reflected in its smaller contribution to the total alpha power (a fixed number) even if subject A could have higher absolute alpha power in the PCC than subject B.
After normalisation, log-transformation of the spectral ratios (alpha1/theta and alpha1/delta in the PCC) was computed to obtain a more normal distribution. Independent t-tests with unequal variances were used to assess the differences between AD- and nonADMCI groups. The significance level for all statistical tests was set at p < 0.05 (two-tailed). Exploratory analyses with the same methods were applied to the IPC and MTG.
Results
Forty-six MCI patients were recruited in this research, with ADMCI 22 and nonADMCI 24 and overall clinical dementia rating (CDR) score of 0.5. ADMCI and nonADMCI were comparable in terms of age (78.5 vs. 79.3), education (15.1 vs. 16.8), and Mini-Mental State Examination (24.9 vs. 25.1). Their neuropsychological profiles did not show differences except language- and memory-related functions, such as modified Boston Naming Test (12.4 vs. 13.8, p = 0.02) and immediate free recall of categorical reasoning (2.3 vs. 4.0, p = 0.06). Scans of amyloid PET were available for 30 participants (17/22 for ADMCI). The diagnoses were retrospectively re-evaluated.
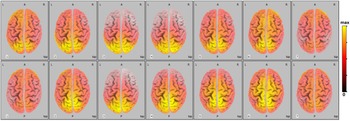
Our hypothesis was supported. The ADMCI group showed lower alpha1/theta and alph1/delta in the PCC, see the statistics summarised in Table 1. Exploratory analyses in the IPC revealed that the ratios of beta bands to alpha1 may also differentiate ADMCI and nonADMCI. Independent t-tests of power ratios in the MT did not show significant between-group differences (data not shown). The average powers for the seven frequency bands of the two MCI groups are illustrated in Fig. 1.
Grand average of LORETA solutions showing the distributed EEG sources (normalised relative power at the cortical voxels) for delta, theta, alpha 1, alpha 2, beta 1, beta 2, and beta3 bands (numbering from 1 to 7) of ADMCI (upper row) and nonADMCI groups. The relative power has been scaled to be between maximum and zero, with colorbar attached at right side.

Two-sample t-tests of spectral ratios between ADMCI and nonADMCI groups in the PCC and IPC

Note: The p-values and t-stats are calculated after log-transformation of the spectral ratios.
Discussion
Retrieving neural markers from clinical EEG has been under incessant investigation for various neurodegenerative disorders. Previous studies have demonstrated its potential in the differential diagnosis and in the tracking of disease courses (Moretti et al., Reference Moretti, Frisoni, Fracassi, Pievani, Geroldi, Binetti, Rossini and Zanetti2011, Reference Moretti, Zanetti, Binetti and Frisoni2012, Babiloni et al., Reference Babiloni, Del Percio, Lizio, Noce, Cordone, Lopez, Soricelli, Ferri, Pascarelli, Nobili, Arnaldi, Fama, Aarsland, Orzi, Buttinelli, Giubilei, Onofrj, Stocchi, Stirpe, Fuhr, Gschwandtner, Ransmayr, Caravias, Garn, Sorpresi, Pievani, D'antonio, De Lena, Guntekin, Hanoglu, Basar, Yener, Emek-Savas, Triggiani, Franciotti, Frisoni, Bonanni and De Pandis2017). For example, classification algorithms have been applied in qEEG for differentiating AD patients (mild to moderate dementia) from healthy controls (Lehmann et al., Reference Lehmann, Koenig, Jelic, Prichep, John, Wahlund, Dodge and Dierks2007). The Grand Total EEG score has been used to discriminate dementia with Lewy Bodies versus that with AD (Lee et al., Reference Lee, Brekelmans and Roks2015). However, the statistics seems to be modest at the MCI stage (see a review by Giannakopoulos et al., [Giannakopoulos et al., Reference Giannakopoulos, Missonnier, Gold and Michon2009]), and it is desirable to devise novel indices to enhance the power of detection. Rooted in the observation of background slowing and early involvement of the PCC, this study combined spectral ratio, network information (PCC), and normalisation strategy to develop novel neural markers. Our primary hypothesis was confirmed. The ADMCI group showed lower alpha1/theta and alph1/delta ratios in the PCC. In addition, the ratios of beta bands to alpha1 in the IPC may also differentiate ADMCI and nonADMCI. These findings altogether pointed out the central role of alpha1 in the posterior DMN, which was nicely concordant with “alpha deterioration” of ADMCI in the posterior brain region (Babiloni et al., Reference Babiloni, Del Percio, Lizio, Marzano, Infarinato, Soricelli, Salvatore, Ferri, Bonforte, Tedeschi, Montella, Baglieri, Rodriguez, Fama, Nobili, Vernieri, Ursini, Mundi, Frisoni and Rossini2014).
The neuropsychological functions of brain waves have been studied extensively. Alpha and theta brain rhythms are particularly implicated in the attention and memory functions (Klimesch, Reference Klimesch1999), which may further underlie the interplay between short-term and long-term memories (Sauseng et al., Reference Sauseng, Klimesch, Gruber, Doppelmayr, Stadler and Schabus2002). Specifically, upper alpha is implicated in cortical processes related to semantic memory, whereas lower alpha is implicated in processes related to attention (Klimesch, Reference Klimesch1999). Notably, it has been suggested that long-term (semantic) memory processes were reflected by oscillations in the posterior alpha rhythm (Klimesch, Reference Klimesch1996). Increased upper alpha and decreased lower alpha power have been observed in patients with MCI due to AD, relative to normal elderly subjects (Moretti et al., Reference Moretti, Zanetti, Binetti and Frisoni2012). The above evidence altogether indicates that the attenuation in the posterior alpha brain waves, and hence the decreased alpha1/theta ratio is concordant with the neurodegenerative changes of AD at the MCI stage.
The normalisation procedure discounted the variation in absolute spectral powers where previous reports showed very discrepant results, thus making the regional change more prominent (Babiloni et al., Reference Babiloni, Binetti, Cassetta, Dal Forno, Del Percio, Ferreri, Ferri, Frisoni, Hirata, Lanuzza, Miniussi, Moretti, Nobili, Rodriguez, Romani, Salinari and Rossini2006, Kwak, Reference Kwak2006, Rossini et al., Reference Rossini, Del Percio, Pasqualetti, Cassetta, Binetti, Dal Forno, Ferreri, Frisoni, Chiovenda, Miniussi, Parisi, Tombini, Vecchio and Babiloni2006, Luckhaus et al., Reference Luckhaus, Grass-Kapanke, Blaeser, Ihl, Supprian, Winterer, Zielasek and Brinkmeyer2008). Since the directionality of alpha and theta/delta power change is opposite in the posterior brain region of ADMCI (i.e. background slowing), taking spectral ratio would widen the between-group differences. In addition, our EEG analysis applied the brain-based eLORETA approach to incorporate network information into the neural markers, which contrasted with the study by say, Moretti et al., that lumped the alpha characteristics of all electrodes together to form a representative index (i.e. a scalp-based approach) (Moretti et al., Reference Moretti, Frisoni, Fracassi, Pievani, Geroldi, Binetti, Rossini and Zanetti2011). A combination of the above facets together with eye-closed requirement in EEG recording may underly the positive results. As to the finding of beta bands to alpha1 ratios in the IPC, it could result from the higher pathological impairment and hence a trend of decreased beta power in the outer cortex for the nonADMCI, rendering the beta/alpha1 ratio higher for the ADMCI.
We acknowledge several limitations of this preliminary report. First, research criteria of AD biomarkers suggest that the highest probability of ADMCI requires both amyloid beta peptide in the brain (e.g. from PET scan or cerebral spinal fluid [CSF]) and neuronal injury markers (e.g. tau protein in the CSF). In this study, 30 out of 46 subjects had amyloid PET data, and the information of Abeta42 and p-tau in the CSF were not available, despite that the diagnoses were retrospectively confirmed by clinical courses and neuropsychological profiles. Second, the two neurodegenerative groups of patients received various kinds of pharmacological treatment, which was hard to be strictly controlled. Lastly, healthy controls were not included. Nevertheless, we believe that EEG markers can enrich the instrumental assessment of brain dysfunctions in ADMCI patients.
Since our nonADMCI group had heterogeneous constituents, we regarded our results specific to ADMCI. It is worthwhile to apply our analytic pipeline to the preclinical stage of AD and examine its validity in early detection. The proposed strategies can be easily extended to EEG data of higher definition (e.g. 10–10), and applied to obtain neural markers that may differentiate AD and other neurodegenerative disorders, such as comparing AD with PD, or AD with vascular brain impairment (Moretti et al., Reference Moretti, Zanetti, Binetti and Frisoni2012, Babiloni et al., Reference Babiloni, Del Percio, Lizio, Noce, Cordone, Lopez, Soricelli, Ferri, Pascarelli, Nobili, Arnaldi, Fama, Aarsland, Orzi, Buttinelli, Giubilei, Onofrj, Stocchi, Stirpe, Fuhr, Gschwandtner, Ransmayr, Caravias, Garn, Sorpresi, Pievani, D'antonio, De Lena, Guntekin, Hanoglu, Basar, Yener, Emek-Savas, Triggiani, Franciotti, Frisoni, Bonanni and De Pandis2017, Reference Babiloni, Del Percio, Lizio, Noce, Lopez, Soricelli, Ferri, Pascarelli, Catania, Nobili, Arnaldi, Fama, Aarsland, Orzi, Buttinelli, Giubilei, Onofrj, Stocchi, Vacca, Stirpe, Fuhr, Gschwandtner, Ransmayr, Garn, Fraioli, Pievani, Frisoni, D'antonio, De Lena, Guntekin, Hanoglu, Basar, Yener, Emek-Savas, Triggiani, Franciotti, Taylor, De Pandis and Bonanni2018). Recently, there is a trend of incorporating various clinical and biological metrics into machine learning algorithm to boost the diagnostic power of AD. Our ROI-informed spectral ratio indices could be novel candidates to serve this purpose.
Acknowledgements
This work was supported by NeuroCognitive Institute (NCI) and NCI Clinical Research Foundation Inc.
Authors’ contributions
TW Lee and G Tramontano both contributed intellectually to this work. G Tramontano provided the conceptual framework and monitored the progress. TW Lee carried out the analysis and wrote the first draft.
Financial support
N/A.
Statement of interest
TW Lee and G Tramontano declare no conflicts of interest.
Compliance with ethical standards
This research analysed the databank registered at NeuroCognitive Institute. The authors assert that all procedures contributing to this work comply with the ethical standards of the relevant national and institutional committees on human experimentation and with the Helsinki Declaration of 1975, as revised in 2008.