The merger of the low back vowel phonemes /o/ (as in lot and cot) and /oh/Footnote 1 (as in thought and caught) is very widespread in North American English. The Atlas of North American English (hereafter ANAE; Labov, Ash, & Boberg, Reference Labov, Ash and Boberg2006) shows that the merger is complete or nearly complete in a collection of regions amounting to nearly one-half the population of Anglophone North America, including all of Canada, nearly all of the western United States, northern and eastern New England, and western Pennsylvania. In certain other regions, the merger is observed to be incomplete and in progress: notably the area identified as the Midland, including the major cities of central and southern Ohio, Indiana, and Illinois.
There remain three regions that ANAE describes as showing “stable resistance” to the low back merger, by virtue of the fact that in each one either /o/ or /oh/ has undergone some change that has increased the phonetic distance between the two phonemes. Among some speakers in the South, /oh/ is a diphthong with a rounded offglide. In the “Eastern corridor,” a collection of urban areas in the northeastern United States from Providence, Rhode Island, through New York City and down toward Baltimore, /oh/ is substantially raised out of the low back area of the vowel space. In the Inland North—the region on the south side of the Great Lakes reaching at least from Syracuse, New York, in the east to Milwaukee in the west—/o/ is fronted out of the low back area as part of the Northern Cities Shift (NCS), a chain shift involving /o/ and several other vowel phonemes.
However, Labov (Reference Labov1994) states what he identifies as Herzog's Principle: phonological mergers tend to expand across dialect geography, at the expense of distinctions. This is a corollary to Garde's Principle: once a merger is completed in a given community, it is impossible to reverse by the ordinary means of linguistic change. The reasoning is straightforward; once a merger that is established in one community manages to spread to an adjacent community and get established there, that new community becomes a permanent addition to the merger's territory. Thus the merger's geographic extent expands, while the distinction contracts.
If we take Herzog's Principle seriously, it implies that there should not be areas of “stable resistance” to the low back merger; there should only be areas that have not undergone the merger yet. Therefore, the key question being examined in this paper is the following: What is the nature of the “resistance” to the merger observed by ANAE? Do such regions only appear to resist the merger because the increased distance between the phonemes is merely delaying the inevitable? Or have some of them developed phonological structures that are somehow incompatible with diffusion of the caught-cot merger, as the phrase “stable resistance” seems to imply? Labov (Reference Labov2010:164) suggests the latter in the case of the Inland North, arguing that the fronting of /o/ is “locked into the larger context of the NCS” and “not easily reversed” toward merger with /oh/.
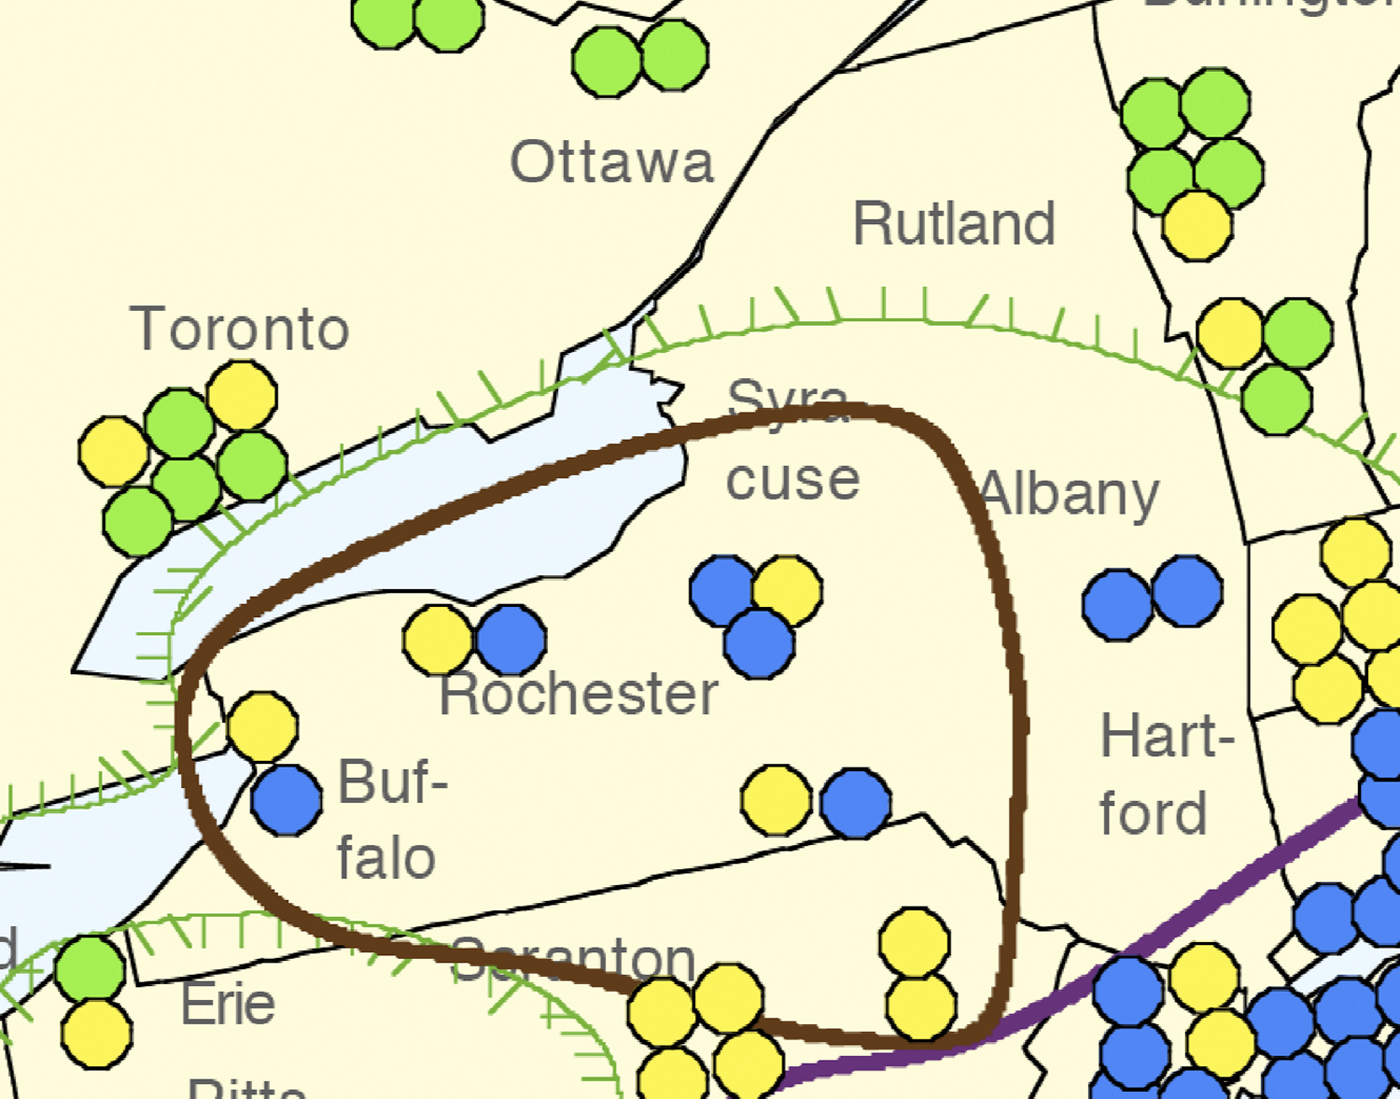
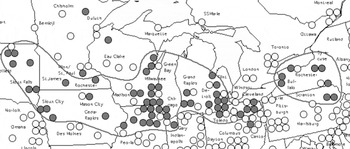
Upstate New York—the portion of the state of New York north and northwest of the New York City metropolitan area, a region encompassing about 90% of the state's land area, but only about 30% of its population—overlaps with or is adjacent to several regions with different /o/~/oh/ systems. For this reason, the Upstate region provides an ample laboratory for testing hypotheses about expansion of and resistance to the caught-cot merger. To the best of my knowledge, the merger has not been previously reported in Upstate New York. However, Upstate New York is adjacent to several regions where the merger is already known to be complete and of relatively long standing (ANAE): Northwestern New England, Canada, and Western Pennsylvania. These are shown on Figure 1. Vermont, Quebec, and eastern Ontario abut northern New York; and northwestern Pennsylvania and the Niagara peninsula of Ontario are adjacent to western New York. Given Herzog's Principle, we therefore expect the merger to have spread into Upstate New York to at least some extent.
(Color online) Distribution of the caught-cot merger around New York State, as shown in ANAE. Dark spots represent fully distinct speakers; medium gray, fully merged; and pale gray, intermediate speakers. The barred isogloss sets off the merged region, the dark loop the Inland North, and the dark line to the southeast the area of raised /oh/.

Upstate New York also overlaps with two of ANAE's three regions of resistance to the merger. One is the Inland North, where /o/ is fronted away from /oh/ as part of the NCS; the central and western parts of the state are within the Inland North, including the cities of Buffalo, Rochester, and Syracuse, labeled on Figure 1. The Eastern Corridor, where /oh/ is raised away from /o/, includes New York City, and it extends a considerable distance upstate as well. Thus, in Upstate New York, it is possible to examine what happens when fully merged regions and ostensibly merger-resisting regions coexist in relatively close quarters.
METHODOLOGY
The data presented in this paper are derived from a series of 119 sociolinguistic interviews carried out between 2006 and 2008 with natives of 23 cities and towns in Upstate New York. These communities were selected with the aim of locating the boundaries between the major dialect regions in and adjacent to the eastern half of the state: the Inland North, New York City, Western New England, and Canada.
In 12 of these communities—Amsterdam, Canton, Cooperstown, Glens Falls, Gloversville, Ogdensburg, Oneonta, Plattsburgh, Poughkeepsie, Sidney, Utica, and Watertown—interviews with European-American (or in one case, Turkish-American) native speakers were conducted in person, mostly following the protocol of Short Sociolinguistic Encounters described by Ash (Reference Ash2002). These are interviews of 10–25 minutes for which the researcher recruits subjects by approaching them in publicly accessible places such as parks, swimming pools, cafés, and shops. Conversation topics focused on everyday life, recreation, and travel; interviews ended with a few short formal data-elicitation methods, including a written list of approximately 50 words. Limited demographic information (age, occupation, education, residential history) and no personally identifying information were requested. Little to no attempt was made to balance the sample by gender, age, or socioeconomic class; subjects were recruited strictly by availability. A total of 91 such interviews were conducted and analyzed, a few with speakers who turned out to be natives of neighboring communities.
These 91 in-person interviews are supplemented by 28 telephone interviews with speakers from a few of the same communities and several additional communities chosen to deepen the geographic coverage of the sample: Amsterdam, Canton, Cobleskill, Cooperstown, Fonda, Geneva, Gloversville, Lake Placid, Ogdensburg, Saratoga Springs, Schenectady, Sidney, and Walton. These followed the Telsur protocol used in ANAE. Names were semi-randomly chosen from a telephone directory for a given city or village. Those names that seemed characteristic of the predominant ethnic groups in the community according to the United States Census were called. Interviews were conducted with the first two individuals called who were natives of the community and were willing to participate. These interviews were approximately 30 minutes long and included about 10 minutes of casual conversation and 20 minutes of formal elicitation of specific words and minimal pairs.Footnote 2
The full vowel system of each of these 119 speakers was measured and plotted for analysis, using the methodology described in ANAE to ensure comparability with ANAE data. For each speaker, first and second formant (F1 and F2) values were extracted for about 400–600 stressed vowel tokens whenever possible, including all tokens extracted through formal methods. For each vowel token, F1 and F2 were measured in Praat (Boersma & Weenink, Reference Boersma and Weenink2011) at a single point selected by hand as representative of the central tendency of the vowel nucleus. Each speaker's mean F1 and F2 values for each vowel phoneme were computed in Plotnik 8 (Labov Reference Labov2005), ignoring tokens before sonorants and after obstruent + liquid clusters. Each speaker's vowel measurements were log-mean normalized in Plotnik using the same group norm used in ANAE. The full corpus contains 57,464 vowel measurements across the 119 analyzed interviews.
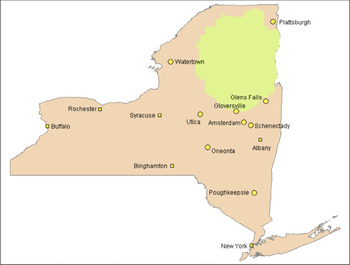
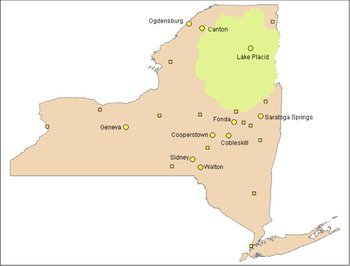
Data from the 10 Upstate New York speakers in the ANAE corpus (2 each from Albany, Binghamton, Buffalo, Rochester, and Syracuse) are also included in the analyses presented in this paper. Figures 2 and 3 display the locations of all of the New York State communities sampled for this project and ANAE.
(Color online) New York State communities sampled in ANAE, and in 2006 and 2007 for this project.

(Color online) Communities sampled in 2008.

THE DIALECT REGIONS OF UPSTATE NEW YORK
This paper will examine the status of the caught-cot merger in Upstate New York through two indices: the presence of merger in speakers' own minimal-pair judgments, and the distance in phonetic space between the phonemes /o/ and /oh/. As noted, Upstate New York includes several regions that are expected to exhibit different degrees of “resistance” to the merger due to differing configurations of low back vowels. To be able to properly interpret the results of this analysis, then, it will be necessary first to identify which communities are in dialect regions that are supposedly resistant to the merger.
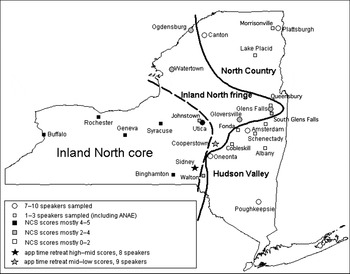
The cities of Buffalo, Rochester, Syracuse, and Binghamton are classified as part of the Inland North in ANAE and, therefore, ostensibly are resistant to the merger as a result of the NCS. In Dinkin (Reference Dinkin2009), I discussed at length the distribution of the NCS in the current Upstate New York corpus, and I found that the cities of Utica and Geneva can be added to that Inland North “core” region. In addition, there is found to be an Inland North “fringe” region, where some speakers in each community exhibit an advanced degree of NCS,Footnote 3 but many do not; this includes Ogdensburg, Watertown, Gloversville, Glens Falls, and Walton. Sidney and Cooperstown are both found to be retreating in apparent time from all criteria of the NCS. If it is true that the NCS lends resistance to the caught-cot merger, then, we might expect the Inland North core communities, where the NCS is more prevalent and advanced, to be more resistant to the NCS than are the fringe communities. The locations of these regions are shown in Figure 4.
The dialect regions of Upstate New York (from Dinkin, Reference Dinkin2009).

To the southeast of the Inland North fringe are the communities identified as the Hudson Valley dialect region, in which the characteristic raised /æ/ of the NCS is largely absent; this region includes Amsterdam and Oneonta, among other communities. Features of the NCS other than /æ/-raising do appear in the Hudson Valley, however, including, to some extent, the fronting of /o/. Therefore, to whatever extent the NCS fronting of /o/ protects against the merger, the Hudson Valley may partake in that resistance as well.
The second relevant feature that ANAE describes as conferring resistance to the merger is the raising of /oh/ away from /o/, as is found in New York City. ANAE's standard for inclusion in this category is that mean F1 of /oh/ must be less than 700 Hz. Only one community in the current sample meets that criterion: Poughkeepsie, in which all seven sampled speakers have mean F1 of /oh/ between 575 Hz and 675 Hz; in no other sampled community does more than one speaker have F1 of /oh/ less than 700 Hz. One other known community in Upstate New York has an overall mean /oh/ higher than 700 Hz, though: Albany, whose two ANAE speakers have /oh/ F1 at 603 Hz and 735 Hz, making for a city mean of 669 Hz. Albany and Poughkeepsie also both exhibit features of the pattern of /æ/ allophony identified by Labov (Reference Labov2007) as indicative of imperfect diffusion of New York City's phonemic split in /æ/ (see Dinkin, Reference Dinkin2009; Dinkin & Friesner, Reference Dinkin and Friesner2009, for more detail on this). On the basis of their shared /æ/ pattern and New York City–like raised /oh/, it is possible to describe Albany and Poughkeepsie as constituting a dialect region within the broader Hudson Valley region, characterized by showing the direct influence of dialect diffusion from New York City. Because these cities are both located directly on the Hudson River, this subregion can be called the Hudson Valley core (and the remainder of the Hudson Valley can be called the Hudson Valley fringe). By virtue of having raised /oh/, then, the Hudson Valley core is also predicted by ANAE to be resistant to the caught-cot merger.
That leaves the communities in far northern New York—Plattsburgh, Lake Placid, and Canton, but not Ogdensburg—as the only region in which no resistance to the caught-cot merger is predicted, as there is neither raising of /oh/ as in the Hudson Valley core nor fronting of /o/ as in the Inland North and (to a lesser extent) the noncore Hudson Valley. This region can be referred to as the North Country.
Kurath and McDavid (Reference Kurath and McDavid1961) presented data from seven “cultured” speakers in Upstate New York, interviewed in the 1940s—four in what I have called the Inland North core (Utica, Binghamton, Rochester, and Buffalo), two in the Hudson Valley core (Poughkeepsie and Albany), and one from the town of Fort Edward, whose present-day status is unknown but which is very near Glens Falls, an Inland North fringe city. To the extent that the fieldworkers' transcriptions presented by Kurath and McDavid can be relied upon (but cf. McDavid, Reference McDavid1981, on the potential danger of doing so), all seven appear to have a secure caught-cot distinction with no phonetic overlap between /o/ and /oh/.
Now that the areas of potential resistance to the caught-cot merger have been identified, the next section will discuss the distribution of the merger itself.
MINIMAL-PAIR JUDGMENTS
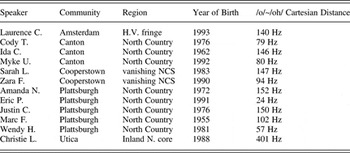
Each speaker in the sample was asked for explicit judgments on at least two minimal or near-minimal /o/~/oh/ pairs. In the entire corpus of 119 speakers, only 12 apparently exhibited the full merger in perception (i.e., described all /o/~/oh/ minimal pairs as the same, or near-minimal pairs as rhyming). Table 1 lists these 12 speakers.
The 12 speakers who judged all /o/~/oh/ pairs merged

Note: The mean Cartesian distance is 131 Hz; SD = 95 Hz.
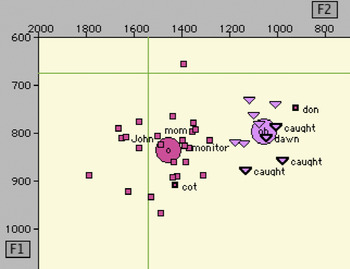
Christie L. from Utica is the only native of a community securely in the Inland North core or fringe to report full merger in perception. Table 1 shows that her mean /o/ and /oh/ are quite far apart: more than two-and-a-half times as far apart as the /o/ and /oh/ means of any other speaker in Table 1. Indeed, Figure 5 shows that her /o/ and /oh/ do not even overlap in phonetic space, with the exception of the single token of don she produced while reading the minimal-pair list. As we shall see, no other speakers in the Utica sample show a hint of caught-cot merger; even those whose /o/ and /oh/ are much closer in phonetic space than 401 Hz securely judged the phonemes as distinct in the minimal-pair tasks. Based on all these observations, it seems that we might regard Christie's responses to the minimal-pair tasks as essentially an error—perhaps she misread the words she was asked to judge (as appears to have happened with don) or perhaps she misunderstood the task; she will be excluded from the discussion of merged speakers.Footnote 4 At any rate, Christie's example warns us to be cautious of evaluating speakers' merger status only on the basis of their responses to the minimal-pair tasks.
(Color online) The /o/ and /oh/ of Christie L., an 18-year-old unemployed woman from Utica. Dark squares represent /o/; light triangles represent /oh/. Tokens of minimal-pair words are highlighted.

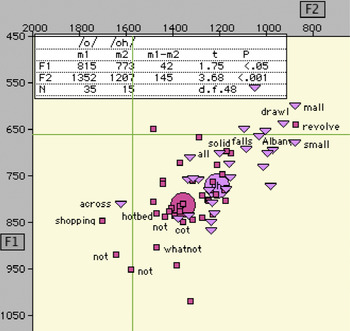
All of the other eleven speakers on Table 1 show clusters of /o/ and /oh/ tokens with large overlaps in phonetic space. Justin C., a coffee-shop employee from Plattsburgh, is a typical example. His /o/ and /oh/ are shown in Figure 6; note that near the center of his distribution, there is an area where tokens of /o/ and /oh/ are roughly equally concentrated. There is a token of /o/ (revolve) as far back as his backest tokens of /oh/ and a token of /oh/ (across) almost as front as his frontest tokens of /o/. Although on average Justin's tokens of historical /o/ are fronter and lower than those of /oh/, a close examination of the tokens suggests that that difference can just as easily be attributed to allophonic variation within his merged /o/~/oh/ phoneme.
(Color online) The /o/ and /oh/ of Justin C., a 31-year-old barista from Plattsburgh.

In any event, it is not entirely necessary to determine categorically whether each of the speakers on Table 1 is authentically merged. In none of these communities is the caught-cot merger fully complete. Every community listed on Table 1 has at least one speaker in the data who maintains the distinction securely; the merger in all these communities must be construed as a change in progress that can be complete to a greater or lesser degree. Therefore, what we can confidently say is that the speakers on Table 1 are merely the most merged in their respective communities, and (with the possible exception of Christie L.) among the most merged in the entire sample, regardless of whether they are actually fully merged or just nearly so.
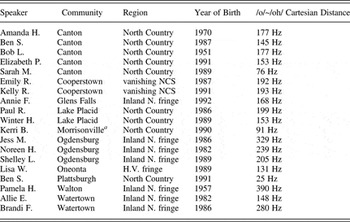
Table 2 lists speakers whose status with respect to /o/~/oh/ minimal pairs is “transitional” in the sense used by ANAE: i.e., they could not decide whether the minimal pairs were the same or different, or judged them as “close,” or had different judgments for different /o/~/oh/ minimal pairs. Therefore, these represent the subset of speakers on whom the caught-cot merger has had enough phonological effect to confuse their judgments, but not enough to totally collapse the phonemic distinction.
Speakers with “close,” uncertain, or inconsistent /o/~/oh/ minimal-pair judgments

Note: The mean Cartesian distance is 182 Hz; SD = 85 Hz.
aMorrisonville is an unincorporated hamlet adjacent to Plattsburgh.
Pamela H. from Walton has the greatest Cartesian distance between /o/ and /oh/ in Table 2. She resembles Christie L. from Utica, the outlier in Table 1, in showing two quite separate clusters of /o/ and /oh/ in F1/F2 space with no real overlap. The only minimal pair on which she had a “merged” judgment was taller~dollar, and her pronunciations of those two words are separated by about 300 Hz, as distinct as any other of her minimal pairs. So we may be justified in treating Pamela like Christie in excluding her from the count of transitionally merged speakers; she seemingly has a secure caught-cot distinction, even if her perception of one of the minimal pairs might indicate some influence from the merger in progress; if she is subject to the merger in some sense, she seems appreciably less so than the other speakers listed in Table 2.
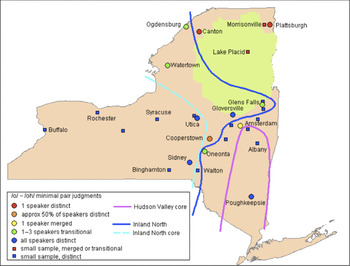
Tables 1 and 2 collectively include all but the 2 oldest of the 19 speakers in the North Country region—8 with merged judgments and 9 with transitional judgments. It is not surprising to find the caught-cot merger in this area. The North Country is directly adjacent to two regions where ANAE finds the merger to be complete, namely Northwestern New England (i.e., Vermont) and Canada; moreover, it is the only region in the sample in which no features that supposedly confer resistance to the merger are found. So if the caught-cot merger were going to be found anywhere in New York State, it is expected that it would be here. Figure 7, which summarizes the minimal-pair judgments of all speakers in the sample, shows that the North Country is the only dialect region of New York State where caught-cot merger is advanced enough to have an effect on the minimal-pair judgments of the majority of speakers.

Cooperstown is a former Inland North community in which the NCS is rapidly diminishing. Of nine Cooperstown speakers in the sample, the five born in 1963 or earlier resemble Inland North fringe speakers in exhibiting some NCS features, and the four born in 1983 or later exhibit virtually no NCS phonology. The minimal-pair data shows that the reorganization of the vowel phonology of Cooperstown extends to the caught-cot merger as well. All of the four younger speakers have merged or transitional minimal-pair judgments, whereas all of the five older speakers have distinct judgments. By contrast, in Sidney, the other village in which NCS is retreating in apparent time, all speakers judge the /o/~/oh/ minimal pairs as distinct.
Ogdensburg is in the geographical region conventionally labeled the “North Country,” but it is not in the North Country dialect region defined in this paper; no speakers in Ogdensburg judged all minimal pairs as merged. This cannot be attributed to Ogdensburg having less contact with historically merged communities than Canton has—indeed, unlike Canton, Ogdensburg is directly on the Canadian border and the site of a border crossing. The only other obvious dialectological difference between Ogdensburg and Canton is that the NCS is present in Ogdensburg. So at least with respect to fully merged judgments, it seems as if the NCS is doing its job in preventing the caught-cot merger from reaching Ogdensburg, while the merger takes place in non-NCS communities on both sides of it.
If transitional judgments are included in the analysis, however, the resistance of NCS communities seems less robust: six speakers from NCS communities in the Inland North fringe, including Ogdensburg, appear in Table 2 as having transitional minimal-pair judgments. These speakers defy the supposed resistance of the Inland North to the caught-cot merger; indeed, several of them show relatively advanced NCS features and are nonetheless subject to the merger in progress. Moreover, none of them reported having a parent from a region where the merger is advanced.Footnote 5 It seems plausible that it is the influence of neighboring merged regions that allows the merger to begin to spread into these communities; the Inland North fringe is adjacent in places to Canada, the North Country, and Vermont.
Despite these transitional judgments in the Inland North fringe, it is worth noting that the /o/~/oh/ distinction is still relatively healthy there overall; the transitional speakers are only 6 out of 40 total speakers sampled in Inland North fringe communities, and no fully merged speakers are found in the region. The contrast between Ogdensburg and Canton remains instructive. In Ogdensburg, three out of nine speakers have transitional minimal-pair judgments, which is the greatest degree of caught-cot merger found in any secure NCS community; in Canton, less than 20 miles away and farther from the nearest fully merged region, only the oldest retains the full contrast.Footnote 6 From this perspective, the NCS does seem to be doing a pretty good job of holding off the merger. But on the other hand, the presence of transitional merger status in three of nine speakers in Ogdensburg does not bespeak stable resistance to the merger.
Indeed, across the entire sample, the merger is associated with younger speakers and thus seems to be increasing in apparent time. As noted, in the North Country, the only speakers with fully distinct minimal-pair judgments are the two oldest speakers interviewed in the region. Moreover, outside the North Country (and not counting the two excluded speakers), the oldest of the 12 speakers with merged or transitional minimal-pair judgments were born in 1982, and therefore are substantially younger than the median year of birth (1972) of the entire non–North Country sample. The probability of this being the case by chance is approximately .00025, well below any statistical significance threshold. Whatever inroads the merger is making into New York State beyond the North Country thus appear to be a relatively recent innovation.
The effect of the merger on speakers' minimal-pair judgments beyond the North Country is not only relatively recent but also relatively weak, affecting only a few speakers in the sample and for the most part causing transitional rather than merged judgments. So it seems that what we are seeing here is only the early stages of the expansion of the merger into new territory. However, the fact that the merger has only recently progressed far enough to affect a few speakers' judgments does not mean that we will be unable to track it in more depth by other means. By the time the influence of a merger can reach the point of confusing some speakers' minimal-pair judgments, it may already have had some effect on the phonetics of the phonemes involved. So in the next section, we will get more information on the effect of the caught-cot merger on Upstate New York by looking at the apparent-time behavior of /o/ and /oh/ in F1/F2 space.
PHONETIC POSITION OF F1 AND F2
The whole sample
Looking at the Cartesian distance between /o/ and /oh/ in apparent time shows that, throughout the entire sample of 119 speakers, the two phonemes are in fact trending toward merger not only in the minimal-pair judgments of a relatively small number of speakers, but in phonetic space as well. Like minimal-pair judgments, F1/F2 measurements at a single point in time are at best an imperfect proxy for studying the progress of merger per se. Even if two phonemes overlap in F1/F2 space, it is possible for a distinction to be maintained between them through such means as duration or diphthongization that are not reflected in the measurements collected for this analysis. However, to the extent that merged minimal-pair judgments and approximation in F1/F2 space coincide, we can take the two together as fairly strong evidence of the presence of merger. Moreover, none of these communities are fully merged in any event, but all else being equal, we can tentatively take a closer phonetic approximation between /o/ and /oh/ as indicating a greater degree of progress toward merger or influence from merged communities.
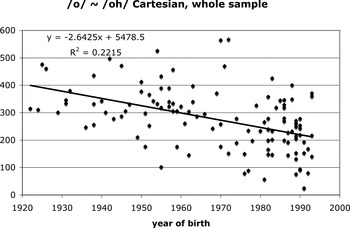
Figure 8 shows the correlation between /o/~/oh/ distance and year of birth: /o/ and /oh/ are about 50 Hz closer together in F1/F2 space for every 19 years of apparent time. The Cartesian distance is a computation based on four measurements that are in principle independent: F1 and F2 of both /o/ and /oh/. So it is meaningful to ask by what movements of /o/ and /oh/ the Cartesian distance is closing: Is /o/ standing more or less still while /oh/ approaches it, or vice versa, or are they both moving toward each other in F1/F2 space?
/o/~/oh/ Cartesian distance, narrowing in apparent time. n = 119; p < 10−7.

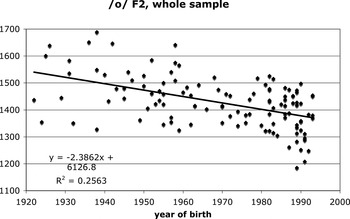
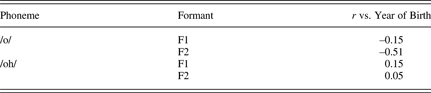
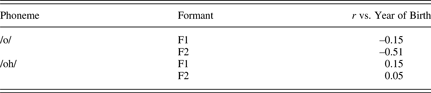
Table 3 shows the Pearson r-correlations between year of birth and both F1 and F2 of /o/ and /oh/. It is clear from Table 3 that most of the movement between /o/ and /oh/ is taking place in the backing of /o/. So it is this backing, shown in Figure 9, that is doing the work in narrowing the acoustic gap between /o/ and /oh/.
F2 of /o/ backing in apparent time. n = 119; p < 10−8.

Pearson correlations of F1 and F2 of /o/ and /oh/ versus year of birth
/o/ and /oh/ in F1/F2 space by region
Looking at /o/ and /oh/ across the entire 119-speaker sample is not extremely informative. We already know that the sample includes several different dialect regions, in which the behavior of /o/ and /oh/ is likely to be different. So let us now move on to considering each subregion of Upstate New York individually.
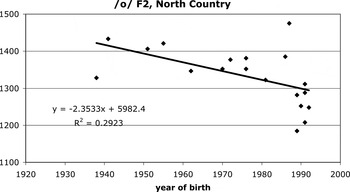
In the North Country the caught-cot merger is already well underway; only the two oldest speakers interviewed in the region maintain a distinction between /o/ and /oh/ in minimal-pair judgments. From judgments alone, there is no direct evidence to indicate that the merger is still in progress in apparent time after 1950. However, the acoustics of /o/ provides clear evidence that the merger is ongoing: /o/ is backing in apparent time toward /oh/, which remains stationary. The backing of /o/ is shown in Figure 10.
The backing of /o/ in apparent time in the North Country. n = 19; p < .02. If the two oldest speakers are excluded, r 2 rises to about .35 and p is still less than .02.

The most striking fact about Figure 10 is the seemingly abrupt backward movement of /o/ among the seven youngest speakers. Every one of the 7 speakers born after 1988 has F2 of /o/ less than 1315 Hz, and every one of the 12 speakers born before 1988 has F2 of /o/ greater than 1315 Hz; there is no overlap whatsoever. (The difference is statistically significant at p < 10−4.) This is so striking that it is tempting to say something like “1988 is the year the caught-cot merger went to completion in the North Country.” This is reminiscent of Johnson (Reference Johnson2007)'s findings on the Massachusetts–Rhode Island border, where the merger appears to have gone to completion relatively suddenly: in each of several communities, children born after a certain date had full merger, whereas the merger statuses of those born before that date were mixed and often depended on whether a given speaker's parents were merged. However, Johnson's model does not directly apply to the current data. Johnson found the merger going to completion at different times in different consecutive communities, whereas the 1988 date of the abrupt backing of /o/ in the North Country is based on data from several communities as far as 100 miles from each other. Moreover, almost none of the sampled speakers described their parents as being natives of merging regions other than the North Country itself.
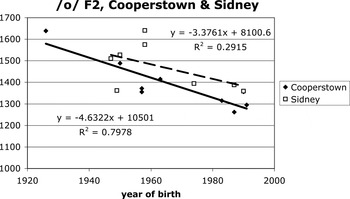
The only community in the sample outside the North Country in which multiple speakers had fully merged minimal-pair judgments was Cooperstown. Of the nine speakers interviewed in Cooperstown, the five born in 1963 or earlier all had distinct judgments, and the four born in 1983 or later all had merged or transitional judgments. This is reminiscent of Cooperstown's rapid retreat from the NCS (Dinkin, Reference Dinkin2009). Given the retreat from the NCS, it is unsurprising that the phonetic approach to the caught-cot merger should be the backing of /o/. Figure 11 displays the backing of /o/ in apparent time in Cooperstown.
F2 of /o/ in apparent time in Cooperstown and Sidney. In Cooperstown, the correlation between /o/ F2 and year of birth is statistically significant (p ≈ .001); in Sidney, it does not reach the level of significance.

In Sidney, whose /o/ is also shown on Figure 11, while the NCS is diminishing in apparent time, all speakers sampled judged all /o/~/oh/ minimal pairs as distinct. Because the NCS is diminishing, we would expect to find /o/ backing in apparent time, as we did in Cooperstown. The Pearson correlation of F2 of /o/ with year of birth does not reach the level of statistical significance (r 2 ≈ .29, p ≈ .17), although, as Figure 13 shows, only one of the five older speakers sampled in Sidney has /o/ as back as the three younger speakers do. A t-test comparing the five older speakers (mean F2: 1523 Hz) and three younger speakers (mean F2: 1380 Hz) does yield a significant difference with p < .05.
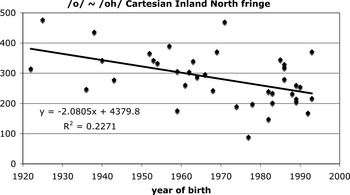
In the previous section, indications were found of incipient merger in the Inland North fringe. Six relatively young speakers out of the 40 interviewed in the region had transitional minimal-pair judgments. If the merger has had enough of an effect in the Inland North fringe to begin affecting speakers' minimal-pair judgments, then we may hope to find phonetic evidence of progress toward the merger as well. Figure 12 shows exactly this; the phonetic distance between /o/ and /oh/ is diminishing in apparent time.
The diminishing Cartesian distance between /o/ and /oh/ in apparent time in the Inland North fringe (p < .002).

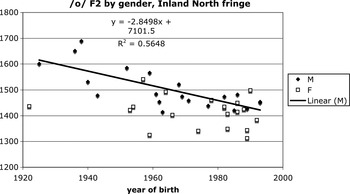
The backing of /o/ in apparent time in the Inland North fringe. The regression line with r 2 ≈ .56 (p < .0002) represents the apparent-time trend for males only; the sampled females do not have a wide enough effective age range to show a significant apparent-time trend.

An unexpected result of the data collection method used in this study was that older female speakers were undersampled, and this undersampling was especially pronounced in the Inland North fringe. With the exception of one older female speaker, there is a substantially broader range of apparent-time data from males than females in the Inland North fringe; and it is necessary to take care to avoid confounding change in apparent time with gender-based difference in this subset of the data. A multiple linear regression shows that gender and year of birth are both significant factors for F2 of /o/ (adjusted r 2 ≈ .48; p < .001 for each). /o/ is backing in apparent time, with females leading the change, as shown in Figure 13.Footnote 7
Thus, not only do some younger speakers in the Inland North fringe have minimal-pair judgments affected by the caught-cot merger, but movement toward merger is taking place through reversal of the /o/-fronting of the NCS. This is not merely an epiphenomenon of some overall retreat from the NCS in these communities (except Cooperstown and Sidney). Over the Inland North fringe region as a whole, the NCS backing of /e/ is still active in apparent time (r 2 ≈ .29; p < .001; no significant effect of gender), and raised /æ/ is seemingly stable. This suggests that the backing of /o/ and movement toward caught-cot merger is in fact compatible with other features of the NCS as a phonological system. Thus, contrary to Labov's (2010) suggestion, in the Inland North fringe, the fronted /o/ does not appear to be “locked in” to the structure of the NCS, and it is not necessary for the NCS as a whole to be abandoned for the backing of /o/ to take place. Even if we restrict our attention to the 15 sampled Inland North fringe speakers who exhibit a high degree of participation in the NCS (satisfying four of the five NCS criteria defined by Labov, Reference Labov2007), the backing of /o/ in apparent time remains strong (r 2 ≈ .59, p < .001). That is, not only does the backing of /o/ coexist with the NCS in the same communities, but actually among the same speakers.
Conceivably it is not too surprising that the backing of /o/ can coexist with the NCS in the Inland North fringe. I suggest elsewhere (Dinkin, Reference Dinkin2009) that the presence of the NCS in the Inland North fringe is the result of diffusion of the shift from the Inland North core; under Labov's (2007) model of diffusion, this means that the NCS spread to the fringe communities as a collection of more or less independent sound changes, rather than as a network of interacting phonemes in a chain shift. In such a situation, it is to be expected that if one sound change is interrupted or reversed, the others should still be able to proceed. So it may not be fair to expect the Inland North fringe to be resistant to the merger and backing of /o/ in the same way the core is supposed to be.
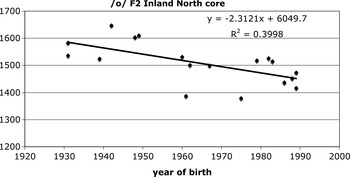
However, Figure 14 shows that /o/ is backing in apparent time in the Inland North core as well.Footnote 8 In the fringe, it was possible to argue that the backing of /o/ could proceed without disturbing the other NCS features because in communities to which the NCS has diffused, there is not necessarily any particular structural relationship between the different sound changes. In the Inland North core, where the NCS is presumed to be a coherent chain-shift system, that argument is not valid, and we have to accept that the backing of /o/ is capable of superseding the NCS's chain-shift structure.
Backing of /o/ in apparent time (p < .01) in the Inland North core. There is no significant effect of gender, nor of whether the interview was conducted by me or by ANAE's Telsur project.

The Hudson Valley core, for the purposes of this paper, is the dialect region of Upstate New York in which /oh/ is raised so that its F1 is less than 700 Hz. This includes only nine speakers on whom data is available: the seven from Poughkeepsie interviewed as part of this project, and the two from Albany in ANAE. Among these nine speakers (and among the seven from Poughkeepsie alone), there is no apparent-time movement in F1 or F2 of /o/ or /oh/ or in the Cartesian distance between them (p > .3 for all correlations). So at least the raised /oh/, unlike the NCS fronting of /o/, seems to be doing its job in preventing movement toward the caught-cot merger.
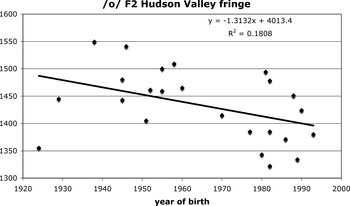
In the remainder of the Hudson Valley dialect region, the Hudson Valley fringe, we find that the Cartesian distance between /o/ and /oh/ is decreasing in apparent time (r 2 ≈ .25, p < .02; no significant effect of gender). Both raising and backing of /o/ appear to be involved. Both formants of /o/ are significantly correlated with year of birth, whereas both formants of /oh/ are not. The raising of /o/ is a male-led change: a regression analysis shows that men in the Hudson Valley fringe have F1 of /o/ about 39 Hz less than women of the same age (combined adjusted r 2 ≈ .34; p < .03 for each). The backing of /o/ (r 2 ≈ .18; p < .05), shown in Figure 15, has no significant gender difference.
Backing of /o/ in apparent time in the Hudson Valley fringe.

The Hudson Valley fringe, however, is defined negatively. It is merely the region where there is no strong evidence for full NCS, raised /oh/, or widespread caught-cot merger in perception. That means that it is not necessarily the case that the communities assigned to the Hudson Valley fringe form a coherent dialect area that can be characterized by unified sound changes. It is likely that some of the communities classified in Dinkin (Reference Dinkin2009) as Hudson Valley fringe communities would have been described as Inland North fringe communities if somewhat more data had been collected or if somewhat different criteria for NCS participation had been used. These might in actuality be best described as transitional, and at any rate, the dialectological affiliation of all of these communities is not fully determinable from the data.
However, there are two Hudson Valley fringe cities whose exclusion from the Inland North is fairly secure—Amsterdam and Oneonta, with seven and nine speakers interviewed, respectively. In these two cities, the movement of F2 of /o/ in apparent time is quite robust (r 2 ≈ .54; p ≈ .001). The backing of /o/ here is led by women, as it is in the Inland North fringe; in a multiple linear regression, women have /o/ about 51 Hz backer than men do (p < .05; combined adjusted r 2 ≈ .54). So the apparent behavior of /o/ in Amsterdam and Oneonta consists of a gradual trend toward raising, possibly led by men,Footnote 9 accompanied by a sharper backing, led by women.
The rest of the Inland North
The previous section found /o/-backing to be in progress in most of New York State, including the Inland North fringe and core. The Inland North region, however, includes more than just communities in New York State. The Telsur corpus includes 53 speakers classified as part of the Inland North region outside of New York, reaching from Ohio to Wisconsin. Figure 16 shows the full area to which ANAE criteria attributes the Inland North's resistance to the caught-cot merger (Labov, p.c.). Is the western portion of the Inland North subject to the same backing of /o/ that the Inland North in Upstate New York is?
The Inland North as defined by fronted /o/ in ANAE's Map 9.2, showing its two components and their points of contact with Canada and Western Pennsylvania. Map produced by William Labov (p.c.), used with permission.

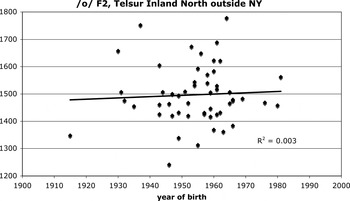
Figure 17 shows that it is not. There is no correlation at all between year of birth and F2 of /o/ in the component of the Inland North west of Pennsylvania. Now, the ANAE data's apparent-time range is somewhat shorter than that of the current sample; to be strictly fair, we ought to compare the two sets of speakers only over the same age range. However, if we restrict our attention to speakers born between 1931 and 1981 (for the oldest speaker sampled in the New York State Inland North core and the youngest ANAE speaker in the western component, respectively), the results do not change. Over that 50-year span, /o/ is significantly backing in apparent time in New York State (n = 12; r 2 ≈ .35; p < .05), but stationary in the western component (n = 51; r 2 ≈ .001).
The lack of movement of /o/ in apparent time in the portion of the Inland North outside Upstate New York in the Telsur corpus.

So, although the Inland North region as a whole has been described as showing “extraordinary” or “mysterious” uniformity (Labov, Reference Labov2001:515, Reference Labov2008), the behavior of /o/ is strikingly different between the portion of the Inland North in Upstate New York and the portion to the west. Although the overall mean F2 of /o/ in the western component in ANAE is essentially no different from that of the Inland North core speakers in New York State (1497 Hz and 1508 Hz, respectively), an unexpected difference appears in that /o/ is backing in New York State and stable in the western component. This suggests that the backing of /o/ that we see in Upstate New York is not merely the next natural stage in the development of the NCS vowel system; the NCS vowel system is present in both components of the Inland North but the backing of /o/ is not. It ought to have some other cause, applicable in Upstate New York but not the western component.Footnote 10
This dialectological difference between two components of the Inland North coincides with a geographic discontinuity. The two components are separated by northwestern Pennsylvania, an area that was found to be part of the North by early dialectological research (Kurath, Reference Kurath1949; Kurath & McDavid, Reference Kurath and McDavid1961) but where the NCS never occurred (Evanini, Reference Evanini2009). Both components of the Inland North—the New York component and the western component—are directly adjacent to two other regions that might be a source of diffusion of the merger, namely Canada and Western Pennsylvania, as seen on Figure 16. However, there is reason to suppose that the New York component should be more likely to be subject to diffusion from these regions than the western component is.
To begin with, the New York component is simply smaller than the western component, having at most 24,000 square miles to the western component's at least 60,000 square miles.Footnote 11 This means that communities in the New York component are simply on average closer to fully merged regions than are communities in the western component. No place in the Inland North core or fringe in New York State is more than about 150 miles from at least one fully merged region; no major Inland North city in New York is farther than about 250 miles from a fully merged larger city (e.g., Toronto, Ottawa,Footnote 12 or Pittsburgh). By contrast, 250 miles is the shortest distance between any major Midwestern Inland North city and a larger merged city (Detroit and Toronto, respectively);Footnote 13 parts of the Midwestern Inland North are over 250 miles from any region, however sparsely populated, where the merger is known to be complete (e.g., Chicago to Michigan's Upper Peninsula). So to the extent that diffusion is more likely to take place over shorter geographic distances, and from larger cities to smaller ones, we would expect the New York component of the Inland North overall to be more subject to diffusion of the caught-cot merger than the western component.
SUDDEN SOUND CHANGE?
It was noted above that the apparent-time movement of F2 of /o/ in the North Country resembled a sudden drop more than a gradual change. All speakers born later than 1988 had /o/ backer in F2 than all speakers born earlier than 1988, with no overlap and no detectable apparent-time change on either side of the 1988 cutoff. Unexpectedly, a similar pattern in F2 appears in each of the other three sets of communities in which /o/ is backing in apparent time.
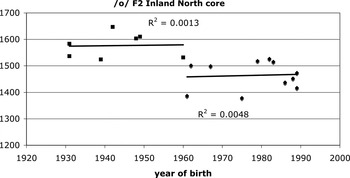
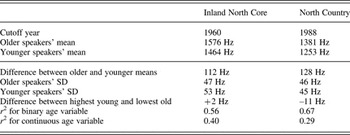
This pattern is clearest in the Inland North core, shown in Figure 18. The 7 speakers born in 1960 or earlier all have F2 of /o/ between 1524 Hz and 1647 Hz, whereas the 11 speakers born in 1961 or later all have F2 between 1379 Hz and 1526 Hz. The two halves of the sample overlap by only 2 Hz in range and differ by 112 Hz in mean; and within either half there is no correlation between F2 and year of birth.Footnote 14 Treating age merely as a binary variable—speakers born in or before 1960 versus those born later than 1960—accounts for the variation in F2 better than treating age as a continuous variable (r 2 ≈ .56 for the binary age variable versus r 2 ≈ .40 for a continuous age variable). The difference between the older and younger halves of the apparent-time range is remarkably similar to the difference between the speakers born before and after 1988 in the North Country, both in the degree of difference between older and younger groups and in the amount of variation within each age group. These similarities are summarized in Table 4. The Inland North core and North Country differ a great deal in the apparent-time date of the sudden F2 change, and in what the actual F2 values are, but they resemble each other with respect to the relationship between the older and younger speakers' F2 of /o/.
F2 of /o/ in the Inland North core, as in Figure 14, split into two apparent-time halves between 1960 and 1961, with no correlation between F2 and age in either.

Comparison of the distribution of F2 /o/ before and after a seeming cutoff point of sudden apparent-time change in the Inland North core and North Country

It is hard to come up with a satisfying phonological explanation for this striking pattern in the Inland North core. There is no clear structural difference between younger and older speakers' vowel systems or the relationship of /o/ to the other vowels in them. For example, all 18 speakers are subject to the NCS; and there are speakers with /æ/ higher than /e/ and speakers with /æ/ lower than /e/ among both the older and younger groups. It is not immediately impressionistically obvious from viewing speakers' overall vowel plots that the younger speakers have consistently backer /o/ than the older speakers do; it only becomes evident when the /o/ data is isolated as in Figure 18. For this reason, it is tempting to dismiss the apparent suddenness in the backing of /o/ as merely an odd but accidental characteristic of the data. Nevertheless, the notion of sudden backing of /o/ is also supported, though weakly, in the Inland North fringe and the Hudson Valley fringe.
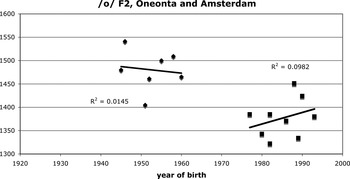
As Figure 19 shows, there is a gap in apparent time in the sample of Oneonta and Amsterdam; no speakers born between 1961 and 1976 were interviewed in either city. That leaves two age clusters in the Amsterdam and Oneonta sample: seven older speakers, born between 1945 and 1960, and nine younger speakers, born between 1977 and 1993. The contrast between these two age clusters' F2 of /o/ is relatively sharp and reminiscent of the contrast between the age clusters of the Inland North core and the North Country. The difference between the older and younger speakers' mean /o/ F2 is 103 Hz; the standard deviation within each age cluster is approximately 42 Hz; and there is no hint of backing in apparent time within either cluster. The overlap between the F2 ranges of the two clusters only occupies a range of only about 50 Hz, and they would not overlap at all if not for one low outlier among the older age group.
F2 of /o/ in Amsterdam and Oneonta, split into two apparent-time halves.

Obviously the large gap in the apparent-time distribution of the sample prevents us from concluding that there was a sudden F2 change here the way there appears to have been in the Inland North core or the North Country. It may be that if speakers from that missing decade and a half had been sampled, their /o/ would show a gradual transition between the older and younger age groups of the actual data. However, the distribution of /o/ F2 within and between the two age groups in Amsterdam and Oneonta is similar to the distribution in the Inland North core, where the suddenness is more evident. Moreover, treating age as a binary variable again accounts for the variation in F2 better than a continuous linear correlation with year of birth does (r 2 ≈ .62 for a binary variable versus r 2 ≈ .45 for the continuous age correlation).
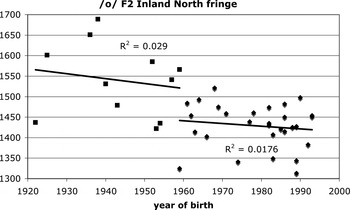
The Inland North fringe also displays some evidence for relatively sudden backing of /o/, as displayed in Figure 20. Here there is substantial overlap in F2 range between the older and younger groups because there is greater overall variability in backness of /o/—speakers born later than 1959 range from 1313 Hz to 1521 Hz, whereas older speakers range from 1422 Hz to 1689 Hz. However, the difference between the means of the older and younger speakers is 111 Hz, roughly the same as the corresponding difference in the other regions. So yet again, the entire range over which F2 of /o/ varies seems to have suddenly shifted backward by slightly more than 100 Hz, with no correlation between F2 and year of birth on one side of the jump or the other. Again, modeling the effect of age as a binary opposition between older and younger speakers accounts for more of the variation in /o/ (r 2 ≈ .38) than does modeling F2 as a linear function of year of birth (r 2 ≈ .33). In the Inland North fringe, the issue is confused somewhat by the undersampling of women in the older age group. However, restricting this analysis to male speakers yields substantially comparable results: a difference between older and younger speakers of 128 Hz; better r 2 from binary than continuous age variable (this time .65 versus .56); no correlation between year of birth and F2 on either side of the 1959 line (r 2 < .09 for both).
F2 of /o/ in the Inland North fringe, split into two apparent-time halves in 1959, with no correlation of F2 and age in either half.

It is possible that the backing of /o/, sudden though it may appear, was in fact a gradual change that merely appears sudden in the apparent-time data. As Labov (Reference Labov2001:449) notes, a linear correlation between year of birth and progression of sound change is an oversimplified model; “many convergent findings indicate that linguistic change follows a logistic progression . . . in which change starts out slowly, reaches a maximum rate at mid-course, and slows down again asymptotically at the end.” With a sufficiently fast slope of change, and variation within the data that is sufficiently large relative to the magnitude of the change, a gradual change that follows a logistic curve can end up looking like a sudden change between earlier and later segments. So what we are dealing with here may not actually be a sudden phonological change, but a gradual phonetic change whose progress is obscured by its rapidity, by gaps in the apparent-time coverage of the data, and by other sources of variation.
It is not necessary, however, for the change in F2 of /o/ to actually have been sudden in order for us to learn something from it. Whether gradual or discrete, we see basically the same change in /o/ either occurring simultaneously or near-simultaneously in three different regions. That suggests that the backing of /o/ in all of these regions is a single phenomenon, rather than having originated independently in each of them.
DIFFUSION OF MERGER
The Inland North fringe, Inland North core, and Hudson Valley fringe differ in their degree of participation in the NCS. In the Inland North core, all speakers in the sample show robust effects of the NCS. In the Inland North fringe, participation in the NCS is more variable, and there is evidence that the NCS diffused there rather than arising there naturally (Dinkin, Reference Dinkin2009). In the Hudson Valley fringe, /o/ is fronted and /e/ is backed, but substantial raising of /æ/ is not found. Although /o/ may not be as front in the Hudson Valley fringe as in the Inland North, it still seems front enough to fall into ANAE's category of resistance to the caught-cot merger; six of the seven speakers in the older cluster in Figure 19 have F2 of /o/ fronter than 1450 Hz, which is the criterion used in ANAE to identify the North as a region of resistance.
The findings of this paper, however, suggest that the apparent resistance to the spread of the merger in the Inland North is not as “stable” as suggested; the presence of NCS phonological features does not prevent phonological change toward merger. Having /o/ fronter than 1450 Hz is not sufficient in Amsterdam and Oneonta to prevent a sound change that narrows the distance between /o/ and /oh/; having /o/ fronter than 1450 Hz in conjunction with other NCS features is not enough to prevent it in the Inland North fringe; and having the entire NCS chain-shift structure is not enough to prevent it in the Inland North core. So if even the part of the Inland North that ought to be most resistant to caught-cot merger can be subject to a rapid backing of /o/ toward /oh/, it seems that neither the frontedness of /o/ alone nor the NCS as a general phonological system is capable of preventing progress toward the caught-cot merger. At the same time, this backing is capable of breaking down the structural coherence of the NCS as a chain shift, as the communities subject to it are for the most part not abandoning other NCS features.
As sketched herein, the difference between Upstate New York and the western component of the Inland North suggests that it is the influence of nearby merged regions that is driving the backing of /o/. This suggestion is reinforced by the geographical distribution of the merger, in that the merger in perception is most advanced in the North Country (adjacent to fully merged regions), and next most advanced in the Inland North fringe (adjacent to the North Country), and then the Inland North core and Hudson Valley are the next regions in the merger's advancing path. This has an interesting implication for Herzog's Principle: the immediate effect of a merger diffusing from community to community need not be any direct evidence of the merger itself in the new community.
In other words, the backing of /o/ in the Inland North core seems to be evidence that the caught-cot merger is in the process of diffusing into the region. However, none of the sampled speakers in the Inland North core have the merger themselves—they all have more than 250 Hz in Cartesian distance between /o/ and /oh/, and they all have distinct minimal-pair judgments with the exception of Christie L. from Utica. Thus the Inland North core is apparently subject to the effect of the diffusion of the merger without being subject (yet) to the merger per se. This can be seen in action more precisely in the Inland North fringe.
The Inland North fringe bears all the hallmarks of a region to which the merger is diffusing. It is directly adjacent to regions where the merger is more or less complete; there are younger speakers who are partially merged in perception; and /o/ and /oh/ are approaching each other in apparent time. Now, as noted, all the speakers who have partially merged phonologies were born in 1982 or later. But if we consider only the 23 speakers born in 1981 or earlier—that is, only speakers who are older in apparent time than the direct effect of the merger on speakers' minimal-pair judgments—the correlation of F2 of /o/ with year of birth remains strong and statistically significant (r 2 ≈ .25; p < .02; adding gender to the regression pushes adjusted r 2 up to approximately .43). That means that by 1982, roughly speaking, the backing of /o/ had already been in progress for some time before affecting speakers' minimal-pair judgments.
So if we interpret what is happening in the Inland North fringe as the expansion of the caught-cot merger by diffusion, then that implies that the immediate effect of diffusion from merged communities need only be a sound change in the direction of merger; the merger itself may begin to take place in perception some time later. So if the presence of transitional minimal-pair judgments in the Inland North fringe is taken to be the result of diffusion, then the backing of /o/ we see in the Inland North core may just as easily be the result of diffusion as well, even though nobody in the Inland North core is actually subject to the merger themselves. Although it is not necessarily the case that this backing of /o/ must eventually result in merger (instead of avoiding merger through the development of, for example, a length distinction), neither is there any good reason to suppose that merger will be avoided. Thus the synchronic absence of the merger in the Inland North core cannot be taken as evidence of the active resistance to diffusion of the merger that Labov et al. (Reference Labov, Ash and Boberg2006) suggested it to be.
Although, given Herzog's Principle, it may seem counterintuitive for the immediate effect of diffusion from a merged community not to be the appearance of the merger itself in the recipient community, that is arguably exactly what would be predicted by Labov's (2007) discussion of the constraints on diffusion. Labov argued that, when a sound change is propagated via diffusion from one community to another, the speakers in the recipient community do not immediately change the underlying organization of their phonological systems—diffusion acts directly only on the “observable elements” of language, such as individual phonemes and lexical items, rather than on the structural relationships between them. The presence or absence of a phonemic merger is, in these terms, exactly a fact about the structural relationships between observable elements of language. An adult speaker in the community receiving diffusion is not (according to this argument) going to take note of whether /o/ and /oh/ in the diffusing dialect are distinct phonemes or merged. So, under this model, a speaker subject to diffusion may begin backing their own /o/ in response to a backed /o/ in the diffusing dialect, but will not be directly affected by the nonobservable fact that /o/ and /oh/ are merged in the diffusing dialect. This suggests that Herzog's Principle is the result not of merger spreading directly from community to community, but of sound changes in the direction of merger being diffused to new communities, and then the merger itself takes place as a result of diffusion merely because those sound changes go to completion. In other words, although we may speak of diffusion of merger, merger per se is not actually the object of diffusion.
This model of the diffusion of merger can be compared with the situations described by Johnson (Reference Johnson2007) and Herold (Reference Herold1990), who found merger taking place relatively suddenly in communities on the Massachusetts–Rhode Island border and in eastern Pennsylvania, respectively. Whereas in Upstate New York, I have argued that merger takes place only as a consequence of the sound change that is the result of diffusion, Johnson and Herold found merger taking place immediately—merger itself is the feature that is being propagated, rather than a gradual sound change leading to merger. They argued that merger is the result of migration of merged speakers into the community. This contrasts with the situation that obtains in most of Upstate New York, which appears to be diffusion of sound change without substantial migration.Footnote 15
It is still conceivable, however, that the backing of /o/ in the Inland North core is not the result of diffusion, and /o/-backing might have originated there independently, with no particular influence from merged communities. Labov (Reference Labov2010) points out that low vowels have been relatively free to move back and forth between front and back positions throughout the history of English. However, even if that is the case, then the fact that /o/ is free to rapidly move back 120 Hz basically of its own accord in the Inland North would seem to undermine the idea that the Inland North's fronted /o/ is supposed to be locked into the chain shift and able to resist influence from the caught-cot merger. If /o/ is able to be moved back without even the effect of diffusion from merged communities, surely it should be even more susceptible to backing if there were direct influence from the merger. So we can conclude from this that the characterization of the Inland North as a region that resists the caught-cot merger is an overly strong claim. Rather than having a phonological system that actively resists the merger or progress toward it, it is merely a region that, as of ANAE's dataset, had not happened to have undergone the merger yet.
The argument that the diffusion of merger is merely the diffusion of sound change in the direction of merger, then, ties in very nicely with explaining why the Inland North is not resistant to the merger. Labov (Reference Labov2010) specifically describes the fronting or backing of low vowels as an easily reversible sound change; there is no particular universal tendency for low vowels to become fronter or backer. By contrast, the raising of tense peripheral vowels is described as a “unidirectional” type of sound change. This categorization suggests, then, that it would be easier for a community to acquire through diffusion a sound change that involves reversing the direction of movement of a low vowel than one that involves lowering a tense peripheral vowel. That seems to be exactly what we see in the Upstate New York data with respect to the caught-cot merger. In the Inland North, where the feature separating /o/ and /oh/ is the frontness of /o/, that fronting is relatively easily reversed and movement toward the merger begins. On the other hand, in the Hudson Valley core, the feature separating /o/ and /oh/ is the raising (and diphthongization) of /oh/ as a tense peripheral vowel, a supposedly unidirectional change—and as far as the admittedly limited available data can show,Footnote 16 the Hudson Valley core is the only region in the current sample that shows no visible trend toward the caught-cot merger. This is exactly what would be predicted by a model that explains diffusion of merger as a consequence of diffusion of sound change in the direction of merger, rather than as diffusion of the fact of merger itself.
CONCLUSION
To sum up, the key finding of this paper is that the caught-cot merger is in progress throughout most of Upstate New York, including regions in which the NCS predominates. The merger is only nearing completion in the far northeastern part of the state, the region referred to herein as the North Country. Nevertheless, in almost every other region, the trend of backing /o/ toward the merger is visible in apparent time. In the Inland North fringe, this has progressed far enough that several younger speakers have transitional minimal-pair judgments; inasmuch the Inland North fringe is the next region south of the North Country, this suggests that the effect of the merger is diffusing into New York State from the surrounding merged regions. The only Upstate region examined in this paper where there is no such evidence of trends toward merger in progress is the Hudson Valley core, where /oh/ is raised away from /o/ to high mid position.
From these results, we can draw the following conclusions of more or less general relevance to the study of dialectology, and of North American dialectology in particular:
• A merger expanding by diffusion into new communities does not necessarily have direct effects on speakers' minimal-pair judgments; it may merely cause other phonetic or phonological trends toward merger to begin, which may only affect perception directly some decades down the line.
• Having a large phonetic distance between /o/ and /oh/ within a chain-shift structure is not sufficient to block sound change toward the merger from affecting a region. The suggestion by Labov (Reference Labov2010) that fronted /o/ is “locked into” the NCS system was overly strong.
• However, raised /oh/ as in the Hudson Valley core does appear to provide relatively stable resistance. This can be accounted for because, according to the general principles of vowel shifting, fronting a low vowel is a reversible change, whereas raising a peripheral vowel is a unidirectional change.
• The supposed unity of the Inland North as a homogeneous dialect area from Utica to Milwaukee is being broken up: /o/ is backing in Upstate New York, but not in the western component of the Inland North.
In general, the results of this paper are a vindication for Herzog's Principle that mergers expand at the expense of distinctions. However, it clarifies how a merger expands: through launching a sound change in the direction of merger, rather than by causing the merger to take place instantaneously in the new communities. Neither the present-day dialect boundary between the Inland North fringe and the phonologically very different North Country nor the settlement-history boundary between the Inland North fringe and the Hudson Valley fringe is sufficient to prevent the merger from expanding. The diffusion of merger is not strong enough on its own, however, to reverse the general principles of vowel shifting as described by Labov (Reference Labov1994); relatively stable resistance does in fact exist. With sufficient population movement and demographic change, however, as found by Johnson (Reference Johnson2007), merger can even overwhelm stable resistance of that sort. But such demographic change is not necessary for caught-cot merger to advance by diffusion into the Inland North, the chain-shift structure and fronted /o/ of the NCS notwithstanding.