Introduction
Exposure to ultraviolet radiation, the ozone ‘hole’ and biological damage in the Antarctic
Levels of ultraviolet (UV) radiation at the Antarctic surface are high because of local stratospheric ozone depletion, altitude and high surface albedo. Since the discovery of the ozone ‘hole’ over the Antarctic and high southern latitudes around 30 years ago (Farman et al. Reference Farman, Gardiner and Shanklin1985) there has been considerable concern regarding the impacts on the biosphere. (Note that a ‘hole’ event is defined as a thinning of ozone below 220 Dobson Units and not a complete absence of ozone.) The reduction in stratospheric ozone allows more solar UV radiation (wavelengths 400–100 nm) and, specifically, more of the most harmful UVB type (wavelengths 315–280 nm) to reach the surface. UVB can damage DNA and, in particular, can cause skin cancers and damage the eyes in humans (e.g. Meyer-Rochow Reference Meyer-Rochow2000). Whilst the ozone hole peaks in spring, there is a more general decrease in the mid- to high latitude Southern Hemisphere ozone concentration resulting from the intense annual ozone destruction that leads to the hole, as well as the more steady global ozone reduction (WMO 2011).
The damaging impact of this ozone loss/UVB increase on high southern latitude flora and fauna has been investigated in depth since the discovery of the ozone hole. For example, Smith et al. (Reference Smith, Prézelin, Baker, Bidigare, Boucher, Coley, Karentz, MacIntyre, Matlick, Menzies, Ondrusek, Wan and Waters1992) used UV radiation observations from a 6 week Southern Ocean cruise to estimate that phytoplankton production was reduced by at least 6–12% as a result of ozone depletion during that period. Other important findings include, but are far from limited to: i) Antarctic terrestrial and marine algae are stressed by increased levels of UVB radiation (Post & Larkum Reference Post and Larkum1993), ii) Malloy et al. (Reference Malloy, Holman, Mitchell and Detrich1997) identified a significant correlation between DNA damage in Antarctic pelagic icefish eggs and UVB irradiance, iii) Lamare et al. (Reference Lamare, Barker and Lesser2007) observed high levels of UV induced DNA damage in Antarctic sea urchin embryos, iv) the survival rates of Antarctic krill are lowered by increased UV radiation (Ban et al. Reference Ban, Ohi, Leong, Takahashi, Riser and Taguchi2007), and v) Pakulski et al. (Reference Pakulski, Kase, Meador and Jeffrey2008) reported a 57% reduction in marine bacteria around Palmer Station (64.77°S, 64.05°W) during low total ozone column episodes. In short, changes in the high southern latitude UV environment have had a detectable impact on Antarctic ecosystems, particularly primary producers, though this has not been as significant as once feared (e.g. Karentz Reference Karentz1991).
However, investigations into the impact on the health of humans have, naturally, focussed on regions further north that are inhabited by humans in much greater numbers but where the thinning of the ozone layer is less intense than at polar latitudes. MacLennan et al. (Reference MacLennan, Green, McLeod and Martin1992), for example, conducted an epidemiological study in Queensland, Australia and observed annual skin cancer incidence rates as high as 56 per 100 000 year-1 for men and 43 per 100 000 year-1 for women. It is thought that the ozone depletion is a significant factor in driving this increase (Leiter & Garbe Reference Leiter and Garbe2008, Gies et al. Reference Gies, Klekociuk, Tully, Henderson, Javorniczky, King, Lemus-Deschamps and Makin2013). These are worrying statistics; interventions and campaigns focussed on prevention and early diagnosis of skin cancer in Australia are common, which may partially explain the recent levelling off of new malignant melanoma cases in Australia and New Zealand (Erdmann et al. Reference Erdmann, Lortet-Tieulent, Schüz, Zeeb, Greinert, Breitbart and Bray2013).
Conversely, lack of exposure to UVB can also affect human health; vitamin D is produced in the skin when exposed to UVB and vitamin D insufficiency can cause bone disease (Thacher & Clarke Reference Thacher and Clarke2011). This can be a particular problem in the Antarctic, especially in the winter when there is minimal sunlight. Iuliano-Burns et al. (Reference Iuliano-Burns, Wang, Ayton, Jones and Seeman2009) have shown that 85% of expeditioners who spent the winter in the Antarctic developed vitamin D insufficiency.
Overall, though, there has been little focus on the potential damage caused by UVB exposure, or UV erythemal daily dose (EDD), to humans working and living in the Antarctic. The reason for this is that, at present, there are few humans that spend any considerable time in the Antarctic where solar radiation is less intense than further north. Furthermore, those people that are in the Antarctic generally wear cold weather clothing and, other than the face, have little skin exposed to sunlight. However, the potential for damage is still high because the ozone layer overhead is thinnest globally. In one of the few studies in this area, Gies et al. (Reference Gies, Watzl, Javorniczky, Roy, Henderson, Ayton and Kingston2009) investigated the UV EDD experienced by workers on Australian vessels re-supplying Antarctic research stations and reported that 80% of the workers experienced exposure that exceeded occupational limits. Concern has also been expressed relating to eye damage in polar regions (e.g. Meyer-Rochow Reference Meyer-Rochow2000); but in this situation of low residency and highly protective clothing, is concern about human exposure to UVB in Antarctica necessary?
Antarctic environmental change and potential future erythemal daily dose
The Antarctic Peninsula has undergone one of the largest and fastest warmings on the globe (Mayewski et al. Reference Mayewski, Meredith, Summerhayes, Turner, Worby, Barrett, Casassa, Bertler, Bracegirdle, Garabato, Bromwich, Campbell, Hamilton, Lyons, Maasch, Aoki, Xiao and van Ommen2009). In addition to greenhouse gas forced climate change, this regional trend is also thought to be driven by atmospheric circulation changes related to ozone depletion (see Russell & McGregor Reference Russell and McGregor2010 for a review of these mechanisms). Whilst there are early signs of a recovery in the Antarctic ozone hole (Salby et al. Reference Salby, Titova and Deschamps2011), a full recovery is probably several decades away. Watanabe et al. (Reference Watanabe, Sudo, Nagashima, Takemura, Kawase and Nozawa2011) have used an Earth System Model to show that UVB radiation at the Antarctic surface will not return to levels last seen in 1980 until the 2040s. Further, climate projections show that the strong warming trend on the Antarctic Peninsula will continue throughout the 21st Century (IPCC 2013) and it is believed that the collapse of the West Antarctic Ice Sheet may already be underway (Joughin et al. Reference Joughin, Smith and Medley2014, Rignot et al. Reference Rignot, Mouginot, Morlighem, Seroussi and Scheuchl2014). It is clear that the Antarctic, and the Antarctic Peninsula region in particular, will probably experience significant environmental changes in the coming decades.
These regional changes may lead to an alteration in the local environmental conditions where the Peninsula, as well as other coastal Antarctic locations, could be more easily inhabited for longer periods. In these circumstances, understanding the potential risk of UVB exposure and the development of protection strategies becomes more important. Furthermore, the number of people visiting and working in the Antarctic will probably increase; more nations are developing interests in the Antarctic with, for example, China, South Korea, India and Russia all having recently opened new, or re-opened older, Antarctic research stations. Tourism also exacerbates this issue with the International Association of Antarctica Tour Operators reporting that the last decade has seen an average of 24 600 tourists per year landing on the continent. These factors lead to further exposure risk as the Antarctic population is growing, even in the current climate.
Ozone loss is, of course, not the only factor that determines EDD and risk. Cockell et al. (Reference Cockell, Horneck, Rettberg, Arendt, Scherer, Facius and Gugg-Helminger2002) summarized the human and physical factors at work: exposure duration, type of activity, types of protection available, cloud cover, solar zenith angle, season, latitude, total ozone column, albedo, aerosol/dust loading and altitude. However, the discussion here has focussed on ozone as this is a dynamic factor, albeit changing slowly (Bernhard et al. Reference Bernhard, Booth and Ehramjian2005), that can drive other changes, such as Antarctic climate change and cloud cover (Korhonen et al. Reference Korhonen, Carslaw, Forster, Mikkonen, Gordon and Kokkola2010). These changes, in turn, will probably make longer term and/or greater human Antarctic residency more feasible and, given these factors, it is important to develop datasets that can be used to assess this risk associated with UVB exposure from the perspective of both radiation damage and vitamin D insufficiency.
British Services Antarctic Expedition 2012
From 20 December 2011 to 7 March 2012, a 24 member British Services Antarctic Expedition (BSAE) was deployed on a ‘scientific and exploration expedition’ to the Antarctic Peninsula. As well as training and to commemorate the 100th anniversary of Captain Scott’s expedition to the South Pole, the BSAE team aimed to undertake scientific research, particularly in the field of environmental change. One of the experiments undertaken was the daily deployment of polysulphone UVB dosimetry ‘badges’, reported here. The rationale for undertaking this experiment was that the expedition provided an excellent opportunity to examine EDD from the perspective of a team working on the Antarctic surface.
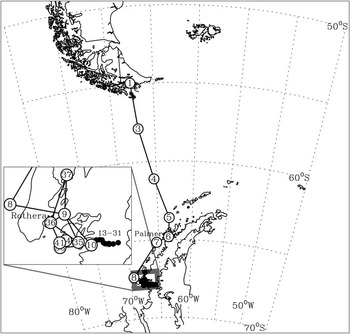
The focus here is the period 30 December 2011 to 23 February 2012 when the BSAE team sailed from Puerto Williams in Chile across the Drake Passage to the Loubet Coast on the western Antarctic Peninsula. They then went onto the land to undertake the land-based phase of the expedition: the team explored remote and previously unvisited areas of the Antarctic Peninsula, including a traverse of the Avery Plateau, and made ascents of unclimbed mountains in the region. Following this, the team spent approximately 2 weeks at sea, close to the Peninsula, before returning to Puerto Williams. The UVB badges were deployed throughout this expedition, i.e. the period at sea from Chile to the Peninsula, the period on land and the period at sea close to the Peninsula. The approximate route of the BSAE team during the period of badge deployment is presented in Fig. 1.
Map showing the route taken by the British Services Antarctic Expedition from South America to the Antarctic Peninsula. The circles indicate the location of the expedition on each day from 30 December 2011 to 24 February 2012, and the numbers (where applicable) relate to the badge number in Table I. Some badges were deployed at approximately the same locations (1 and 2; 9, 38 and 43; 10, 11, 12 and 32; 35 and 40; 36, 42 and 46; 38 and 39; 43, 44 and 45); only the lowest badge number for each of these points is shown. The line between the points shows the shortest distance and not the exact route taken. The inset zooms in on the region where the expedition was on land and, therefore, covered much less distance per day.

Aims
Our main area of investigation here concerns the UVB environment experienced by people working on the Antarctic Peninsula and the factors that drive EDD variability at the surface. This paper will: i) present original polysulphone UVB dosimetry badge data collected during the BSAE expedition to and around the Antarctic Peninsula, ii) compare these data with local ground-based and satellite-derived equivalents to understand how EDD measured at the Antarctic surface differs from more systematic measurements, and iii) contextualize these data in terms of environmental factors, i.e. total ozone column, cloud cover and altitude.
Methods and data
Ultraviolet dose monitoring
Individual polysulphone UVB dosimetry badges were deployed for 24-hour periods to determine the full potential EDD. The latitude, longitude and altitude of the badge deployment location were recorded using GPS.
When these dosimeter badges are exposed to UVB radiation, the optical absorbance of the polysulphone film increases and this change in absorbance can be related to the erythemal UV radiation dose received in the field (the spectral response of polysulphone is similar to that of human skin). Other advantages of polysulphone film for erythemal dosimetry studies are that they are easy to handle and their optical response is known to be stable within the temperature range -4°C to 53°C (Geiss et al. Reference Geiss, Gröbner and Rembges2003). When the expedition was furthest south the team were always within 50 km of the weather station at Rothera (67.5°S, 67.6°W) and the 3-hourly temperature data from Rothera show that the mean temperature for the period 30 December 2011 to 23 February 2012 was 0.2°C. The only period where the temperature fell below -4°C was a 1.5 day period centred on 18 February when the deployed badges were lost due to poor weather conditions. Temperatures would have been lower at altitude (no measurements were taken during the expedition) but the periods when the -4°C threshold was broken would not have coincided with the periods of daylight and would not have contributed to the exposure. Therefore, no action is required in order to remove unreliable measurements from the dataset.
The badges were produced, calibrated and processed by the Centre for Atmospheric Science at the University of Manchester as per Diffey (Reference Diffey1989). Specifically, the absorbance of the badges at a wavelength of 330 nm was measured using a Cecil laboratory spectrometer before the expedition and afterwards on return to the UK. The change in absorbance during the expedition is related to the erythemal dose by way of a polynomial relationship. The polynomial constants are validated at intervals by exposing a separate set of horizontally mounted dosimetry badges to sunlight alongside a Bentham DTM 300 double scanning spectrometer system fitted with a fibre-coupled global input optics. The absolute calibration of the Bentham DTM 300 system itself is checked at regular intervals whilst located at the Manchester surface radiation monitoring site and is directly traceable to the US National Institute of Standards and Technology. These badges have been used successfully in UVB exposure studies for many years (e.g. Webb et al. Reference Webb, Kift, Durkin, O’Brien, Vail, Berry and Rhodes2010, Reference Webb, Kift, Berry and Rhodes2011). The data here are presented as EDD, a measure of UVB exposure in terms of kJ m-2.
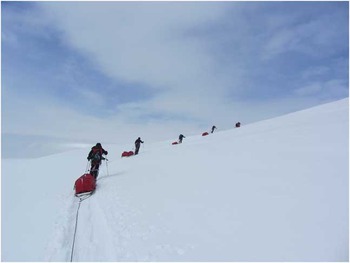
When not in use, the badges were stored in protective containers within lightproof bags. When deployed, the badges were mounted horizontally (i.e. on flat surfaces), usually attached to the yacht, a tent or pulk/sledge (Fig. 2). In these circumstances, there was negligible shading from the sledge operator or items/people on the yacht. Further, there was little relief in the on-land regions explored, thus there was minimal reflection affecting the results. Whilst this horizontal mounting is not typical for dosimetry experiments, it gives us an ideal dataset to compare to observations from local ground-based instruments and satellite-derived products, whilst also eliminating some of the albedo effects. This orientation does introduce some minor issues: i) snow can accumulate on the badges, which was removed as required, and ii) the port-to-starboard listing experienced during the Drake Passage crossing, as well as the slopes encountered on land, may have affected the results; however, comparison with other measures of EDD imply that this was negligible.
The British Services Antarctic Expedition team on the Antarctic Peninsula. The badges were mounted in the centre of the pulks. (Photo credit: Martin Densham.)

Four badges were taken on the expedition and not used in the experiment; these were analysed as ‘control’ badges. All four showed values close to zero EDD (0.01, 0.02, 0.03 and 0.05 kJ m-2); these values are significantly less than the badges used in the experiment, which helps to confirm that measurements from the badges can be assigned to the exposure period.
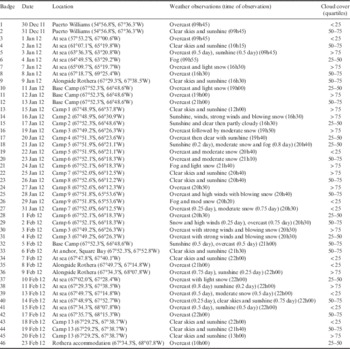
Of the 56 days when badges were deployed (30 December 2011 to 23 February 2012), EDD was determined for 46 days. The missing data points are accounted for as follows: four missing badges and four damaged badges (the losses and damage all occurred in blizzard and gale conditions), and 2 days towards the end of the expedition where badges were not deployed. Exactly half of the 46 days saw the BSAE team at sea and the other half were deployed when the team was on land. Figure 1 and Table I show the locations and weather conditions during each badge deployment period.
Location description (including latitude and longitude) and weather observations (including time of observation) for the British Services Antarctic Expedition team during the period of badge deployment. Including quartile of cloud cover data on the 46 days with polysulphone badge data calculated from MODIS. The weather observation (local) times are variable as they were fitted around the practicalities of the expedition.

Over the 2 months of the expedition the BSAE team travelled across ~13° in latitude. This will have affected the ratio of daylight to twilight that was experienced (these latitudes experience no ‘night-time’ during this period). Initially, in late December and very early January when the expedition was cruising from Chile towards the Peninsula, the BSAE team experienced approximately 18 hours of sunlight per day. When on land, at their furthest south, during mid-January to early February the team experienced between 20 and 18 hours of sunlight per day. During the cruise phase near to the Peninsula at the end of the expedition (early to late February) sunlight decreased to around 16 hours per day. Whilst this will contribute towards some of the variability in the data we do not apply any correction factor here as the differences in daylight during the expedition are not considered large.
Erythemal daily dose from Palmer Station
Palmer Station (64.77°S, 64.05°W; see Fig. 1) is operated by the US National Oceanic and Atmospheric Administration (NOAA) Earth System Research Laboratory (ESRL) Global Monitoring Division (GMD). Since 1988 an SUV-100 spectroradiometer has operated there. This is significant as data from this instrument can be used to calculate EDD, which is comparable to the measurements from the polysulphone badges. Bernhard et al. (Reference Bernhard, Booth and Ehramjian2005) have presented a climatological analysis of the UV data from the station.
Erythemal daily dose and total ozone column from satellite data
The ozone monitoring instrument (OMI), aboard NASA’s Aura satellite, provides measurements of total ozone column (TOC) and surface EDD. As a point of comparison for our badge data, the daily 1° x 1° gridded EDD data was used as point measurements to represent the location of the team on any given day. The TOC data were averaged around a small area (50 kmx50 km) centred on a point 15 km to the north of the expedition location to account for scattering and the solar zenith angle, which is approximately 55° for the latitudes and time of year of the expedition. This gives a better representation of the ozone conditions over the wider (upper-atmospheric) area that would have affected the UVB levels on the ground. The OMI derived surface EDD data would account for these factors in the calculation.
Tanskanen et al. (Reference Tanskanen, Lindfors, Määttä, Krotkov, Herman, Kaurola, Koskela, Lakkala, Fioletov, Bernhard, McKenzie, Kondo, O’Neill, Slaper, den Outer, Bais and Tamminen2007) have validated the OMI EDD data against surface measurements, including those from Palmer Station, and whilst the product performs well globally there is a significant negative bias over the Antarctic. This bias is derived from deviations between the actual albedo around Antarctica and the albedo data used in the OMI EDD calculations. The result of this is an overestimation of cloudiness over the Antarctic. Given this, the Palmer point source EDD data have been used as a point of comparison (in addition to the OMI EDD data) despite being from a fixed location. Furthermore, the cloud optical thickness (COT) data from the OMI will not be used in this analysis as it has problems in our region of interest.
Cloud cover from satellite and meteorological observations
To determine a quantitative measure of daily mean cloud cover, the same method was used to account for scattering and solar zenith angle as with the OMI TOC data but applied to the COT product from the moderate resolution imaging spectroradiometer (MODIS), aboard NASA’s Terra satellite.
The BSAE team included a trained meteorologist who took meteorological observations once a day. The observations were not taken at a regular time every day as this was not practical given the demands of the expedition. However, every effort was made to record representative observations for each day. These observations are used as a comparison point for the results of the MODIS satellite data analysis. The outcome is shown in Table I, which describes the location and weather conditions for each day of the expedition and includes a broad classification of the COT quantification from the satellite data. This comparison shows that there is a relatively good agreement with the qualitative meteorological observations taken by the BSAE meteorologist. There are differences between the two datasets as the observations are subjective and do not represent an extended period or area. Nonetheless, the broad agreement suggests that the method of calculating COT employed is robust.
Results
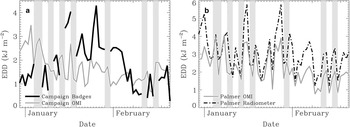
Figure 3a presents the EDD data from the UVB dosimetry badges alongside EDD calculated from the OMI over the location of the BSAE team on each day. The EDD data calculated from the spectroradiometer at Palmer Station are shown in Fig. 3b alongside EDD calculated from the OMI over the location of Palmer. The mean of the badge data across the 46 days was 1.8 kJ m-2 EDD with a range of 0.3–4.3 kJm-2 EDD. For comparison, the mean EDD from the OMI over the BSAE team location (excluding days when badges were lost) was 1.7 kJ m-2 with a range of 0.6–3.5 kJ m-2, and the mean EDD from the stationary spectroradimeter at Palmer was 3.1 kJ m-2 with a range of 1.2–5.8 kJ m-2. These values are within the same order of magnitude as the badge data and are typical for this time of year.
Data from the polysulphone badges and comparable measurements. a. The erythema daily dose (EDD) from the polysulphone badges (black line) and EDD from the ozone monitoring instrument (OMI) using data from over the British Services Antarctic Expedition (grey line). b. The EDD calculated from the Palmer Station radiometer (black dot-dashed line) alongside EDD calculated from the OMI using data over the Palmer Station; there is a significant Pearson’s correlation coefficient of r=0.80 (P<0.01) between the two datasets and the negative bias in the OMI data can be observed. Periods of missing badge data are shown by the vertical light grey shaded areas.

There are low and insignificant (Pearson’s) correlations between the badge data and the Palmer EDD (r 2 =0.12) and the OMI EDD (r 2 =-0.11). This is to be expected given that the Palmer data are from a different location/altitude to the BSAE team and that the OMI data cannot account for the specific surface conditions and are known to be biased in this region. Nonetheless, there are periods of similar variability in the three datasets; the data vary most closely when the BSAE team were closest to Palmer, in terms of horizontal and vertical distance (i.e. mid-January and late February). Similarly, the data are most different when the BSAE team was furthest away from Palmer (i.e. near Chile in late December/early January) or at their highest altitude (i.e. mid- to late January). Overall, this is evidence that the polysulphone badges are providing information regarding exposure which is complementary to that derived from satellites or stationary radiometers.
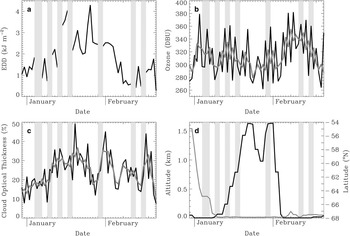
In order to better understand the factors driving UVB levels at the Antarctic surface as recorded in our badge record, the EDD data from the dosimetry badges are shown alongside relevant environmental factors: OMI TOC (Fig. 4b), MODIS COT (Fig. 4c), and expedition altitude and latitude (Fig. 4d).
Data from the polysulphone badges and influencing environmental factors. a. The erythemal daily dose (EDD) from the polysulphone dosimetry badges. b. Total ozone column (TOC) in Dobson Units (DBU) from the ozone monitoring instrument (OMI) data (black line shows the daily data, grey line shows the three-day running mean). c. Cloud optical thickness (COT; %) as derived from the MODIS data (black line shows the daily data, grey line shows the three-day running mean). d. Altitude (black line, left scale) and latitude (grey line, right scale) of the British Services Antarctic Expedition team. Data are shown from 30 December 2011 to 23 February 2012. Note that the grey bars indicating periods of missing UVB data have been overlaid on the other data to make them easier to compare.

Figure 4a shows that there were approximately three phases to the EDD data: an initial period (30 December 2011 to 12 January 2012) when levels were low, a middle period (14 January 2012 to 3 February 2012) when levels were high, and a final period when UVB levels were low again (4 February 2012 to 23 February 2012). This pattern quite closely matches the altitude data (Fig. 4d) and there is a highly positive significant correlation between the two datasets; there is a significant Spearman’s rank correlation coefficient of ρ=0.78 (P<0.01). Spearman’s rank correlation has been used as we assume a monotonic relationship between the variables. The period of higher altitude was when the BSAE team moved from the sea onto land, there was probably a small contribution to the higher UVB levels here from the increase in the amount of radiation being reflected towards the badges due to the higher local surface albedo, although this will be partially negated by the horizontal mounting of the badges. However, the key factor will be the higher UVB levels that are almost always experienced at higher altitude.
The relationships with other major driving factors are more difficult to assess. A relatively short EDD dataset taken from a moving campaign compared with once daily satellite measurements of TOC (Fig. 4b) and COT (Fig. 4c), both of which represent a relatively large area, is unlikely to show similar patterns. Furthermore, the relationship between clouds and surface UVB can be complicated, e.g. certain cloud types can enhance UVB at the surface rather than reduce exposure (Sabburg & Parisi Reference Sabburg and Parisi2006). The correlations between EDD calculated from the badges and these factors are low: for EDD vs. TOC ρ=-0.14 for daily data and ρ=-0.38 (P<0.01) for three-day filtered data, and for EDD vs. COT ρ=0.31 (P<0.05) for daily data and ρ=0.50 (P<0.01) for three-day filtered data.
Nonetheless, there are some indications that the influence of ozone and cloud variability could be detectable were it not for the dominant altitude signal or if a longer EDD dataset were available. For example, the potential influence of TOC over the EDD can be inferred during the move towards the lowest values of EDD (2–12 February 2012), which coincides with the sharpest positive gradient in ozone concentration. However, this also occurs at the same time as a sharp drop in the altitude where the BSAE team was working, thus the influence of ozone is impossible to extricate from the other factors. It is also noteworthy that the highest EDD value (17 January 2012) coincides with some of the lowest levels of COT and TOC. This, again, implies that a longer record could start to shed some light on the relationship between different cloud formations, TOC and the surface UVB environment in this region. Furthermore, this period coincides with the greatest difference between the OMI and Palmer EDD (Fig. 3), which again highlights the difficulties that the OMI EDD algorithm has with cloudiness.
Discussion
The EDD levels recorded here (mean 1.8 kJm-2, range 0.3–4.3 kJ m-2) are comparable to those seen at temperate, mid-latitude locations in the spring/late summer. For comparison, we point to a March–May average of 1.5–3.0 kJ m-2 from Athens (Mantis et al. Reference Mantis, Repapis, Philandras, Paliatsos, Zerefos, Bais, Meleti and Balis2000) and a March–May average of 2.0–3.5 kJ m-2 from the Iberian Peninsula (Gutiérrez-Marco et al. Reference Gutiérrez-Marco, Hernández, Camacho and Labajo2007). This implies that there could be significant human health implications, particularly in relation to eye damage and malignant melanoma, especially as our results are not from the period of peak ozone loss in the spring. The World Health Organization (WHO 1994) recommend that the eyes and unprotected skin are exposed to no more than 0.5 kJ m-2 at 305 nm, 2.0 kJ m-2 at 310 nm up to 70 kJ m-2 at 330 nm over an 8 hour period. Our results imply that these thresholds will be exceeded on certain days on the Antarctic Peninsula. Similarly, the reported impacts on Antarctic ecosystems (e.g. Smith et al. Reference Smith, Prézelin, Baker, Bidigare, Boucher, Coley, Karentz, MacIntyre, Matlick, Menzies, Ondrusek, Wan and Waters1992, Pakulski et al. Reference Pakulski, Kase, Meador and Jeffrey2008) remain a real cause for concern. Given these results, it is probable that any vitamin D insufficiency issues in Antarctic workers during the summer would be related to lack of exposed skin rather than UVB levels, which are adequate for vitamin D production (Webb & Engelsen Reference Webb and Engelsen2006).
The measured badge EDD values reported here are higher than those reported by Gies et al. (Reference Gies, Watzl, Javorniczky, Roy, Henderson, Ayton and Kingston2009) who used similar polysulphone UVB dosimetry badges during summer at Antarctic latitudes, though mostly with workers on supply ships where altitude and albedo are much lower. Furthermore, the badges used in that study were mounted on vertical surfaces, which also makes comparison difficult. A simultaneous comparison of vertically vs. horizontally mounted badges in high albedo environments would help to clarify these differences but was not conducted during this expedition. Looking to other UVB climatologies in this region, the levels recorded here are much lower than the levels reported by Roy et al. (Reference Roy, Gies, Tomlinson and Lugg1994) who measured UVB with radiometers at several Antarctic locations, which, again, may not produce comparable results.
Our results indicate a relatively high level of EDD variability at the Antarctic surface, especially given the short record length. This is, in the most part, driven by the surface conditions (i.e. altitude and possibly albedo), which also varied considerably during the expedition where the BSAE team climbed (and subsequently descended) over 1.5 km and travelled across 13° of latitude (Fig. 4d). However, over such a short period it is difficult (statistically and scientifically) to fully understand the influence of cloud cover and TOC. These factors varied to a greater extent on the day-to-day timescale (especially compared to altitude) so a clear signal may only emerge in a longer dataset. Whilst such records exist from stationary UVB monitors (e.g. the radiometers at the Palmer Station), Tanskanen et al. (Reference Tanskanen, Lindfors, Määttä, Krotkov, Herman, Kaurola, Koskela, Lakkala, Fioletov, Bernhard, McKenzie, Kondo, O’Neill, Slaper, den Outer, Bais and Tamminen2007) have shown that the associations are not easy to model, with albedo variations being the key problem. Therefore, these satellite and ground-based data require complementary surface measurements to fully understand the conditions experienced by people working on the ground in this changing and unique environment, which is ultimately of most interest from a human health perspective.
The main limitation to this work is the length of the EDD record; this was specifically limited by the duration of the expedition (and data losses). There are very few expeditions undertaken in this region thus there is currently no comparable dataset. Therefore, despite the record being short and incomplete, our analysis brings a new element to this issue. It also highlights the need for further similar datasets.
Our data may also include a positive bias because the eight badges that were lost or damaged were those deployed on blizzard days, which would probably have had low UVB levels at the surface. A longer and more comprehensive dataset would eliminate this issue.
In summary, the data collected by the BSAE represents a unique dataset and allows us to consider the potential future health implications for human activities in the Antarctic. It also points toward the need for more, longer, comparable datasets to build up a picture of the current UVB levels and how EDD may change in the future. It is probable that environmental changes in this region (e.g. warming, ice shelf retreat, slow stratospheric ozone recovery) will exacerbate the health impacts described here.
Conclusion
We have presented a new dataset, which was collected during an Antarctic expedition from December 2011 to February 2012. These data begin to explore the UVB environment at the Antarctic surface as experienced by a working team. The key conclusion is that the UVB environment is comparable to temperate, mid-latitude locations in the spring/late summer, which could have human health implications related to exposed areas of the body, i.e. the face and eyes. This is an important issue as the region will probably become more frequently inhabited due to environmental changes, the increasing number of nations developing scientific interests in the Antarctic and positive trends in tourist numbers. This points toward the need for further similar datasets that will complement the existing measurements from stationary monitoring sites and satellites, as it is important to understand the potential exposure of those at work in the Antarctic.
We also aimed to contextualize these new data by comparing them to ground-based and satellite-derived equivalent products and by investigating relevant environmental factors during the period of the expedition. Our comparative analysis showed that our results were in the same order of magnitude as data from Palmer Station and the OMI satellite instrument but there is some noteworthy variability captured by our measurements collected by a team working and moving on the ground. It was more difficult to draw firm conclusion from the analysis of driving environmental factors as the EDD data from the polysulphone UV dosimetry badges was from a relatively short period and included missing data. Furthermore, there was a high degree of day-to-day variability in the environmental data derived from satellites. Nonetheless, there was a highly significant correlation with altitude, which would be expected given the way that EDD varies with altitude at all latitudes, and some patterns of variability related to COT and TOC were identified that require further investigation.
Acknowledgements
We would like the thank the Royal Meteorological Society and the Royal Geographical Society (with the Institute of British Geographers) for their financial support in relation to the purchase and processing of the dosimetric badges. We would also like to thank NASA for making the Aura OMI and Terra MODIS data available online, and NOAA for making the Palmer EDD and UVB irradiance data available online. We are also grateful to all those involved in the BSAE who made the collection of the badge data possible. We also appreciate the excellent comments of two anonymous reviewers that markedly improved the quality of the paper.
Author contribution
Andrew Russell conceived the project, analysed the data and wrote most of the paper. Manmohan Gohlan undertook some of the data analysis and wrote some sections of the paper. Andrew Smedley calibrated and retrieved the data from the polysulphone badges and wrote some sections of the paper. Martin Densham deployed the badges on the Antarctic Peninsula/Drake Passage and contributed to the writing of the paper.