


INTRODUCTION
In almost all industrialized countries, annual influenza vaccination is recommended for the elderly (over 65 years) and for other populations at a high risk of complications [Reference van Essen, Palache, Forleo and Fedson1]. Vaccination reduces mortality of all causes in the elderly by 30–70%, and prevents hospital admissions for influenza-related respiratory disease, heart disease and stroke [Reference Nichol, Margolis, Wuorenma and Von Sternberg2–Reference Gross, Hermogenes, Sacks, Lau and Levandowski4]. In the last 10 years, several randomized controlled studies have highlighted the effectiveness of vaccination with the standard inactivated vaccine and with a new live-attenuated vaccine in children and healthy adults [Reference Nichol5–Reference Nichol, Lind and Margolis10]. These studies showed a reduction of influenza-like illness or acute otitis media of 70–95% in vaccinees relative to non-vaccinees, as well as potential economic benefits. In the United States, use of the inactivated influenza vaccine is now recommended for infants between 6 and 23 months of age and for adults over 50 years [Reference Bridges, Harper, Fukuda, Uyeki, Cox and Singleton11]. Use of the recently licensed live-attenuated vaccine is recommended for healthy persons between 5 and 49 years of age [Reference Harper, Fukuda, Cox and Bridges12]. In the European Union, influenza vaccination of young children is controversial.
The immune mechanisms conferring protection against influenza following infection or vaccination are not fully understood [Reference Webby, Andreansky and Stambas13]. Both the mucosal and systemic arms of the humoral immune system play a major role in prevention of influenza infection, while the cell-mediated immune response is crucial for recovery from infection [Reference Cox, Brokstad and Ogra14]. A major drawback of influenza vaccination lies in the fact that the immunity it elicits, mainly based on neutralizing antibodies directed against the surface haemagglutinin and neuraminidase proteins, declines rapidly. The inactivated influenza vaccine provides protective levels of serum antibodies specific to the vaccine strains and lasting between 6 and 12 months [Reference Shann15, Reference Sullivan, Monto and Foster16]. The live-attenuated vaccine also enhances local IgA responses [Reference Belshe, Gruber and Mendelman17, Reference Clements and Murphy18] and human leucocyte antigen (HLA)-restricted virus-specific cytotoxic T lymphocyte (CTL) activity in healthy [Reference Ennis, Rook and Qi19] and older adults [Reference Gorse and Belshe20]. The live-attenuated vaccine has been shown to provide a substantial degree of protection against a variant not closely matched to the vaccine antigen [Reference Belshe, Gruber and Mendelman21]; but how long this protection persists is not known. Vaccination must be updated yearly, in order to take into account the genetic/antigenic evolution of wild-type influenza viruses.
Contrary to immunity elicited by influenza vaccination, naturally acquired immunity can provide long-lasting protection against subsequent infection by the same viral subtype [Reference Gill and Murphy22, Reference Couch and Kasel23]. For example, when the A(H1N1) virus re-emerged in 1977 after 20 years, people who had been exposed to the virus before 1957 were much less susceptible to infection than those born after 1957 [Reference Glezen, Keitel, Taber, Piedra, Clover and Couch24]. This long-term protection against influenza viruses of the same type or subtype may be partly due to selection of cross-reactive CTL targeting epitopes on a wide variety of internal proteins [Reference Boon, de Mutsert and van Baarle25–Reference Jameson, Cruz and Ennis27].
Few studies are available on the effectiveness of repeated influenza vaccination. They all have short follow-up periods, and only a small number of subjects completed follow-up (39 individuals were followed for up to 6 years) [Reference Beyer, de Bruijn, Palache, Westendorp and Osterhaus28, Reference Keitel, Cate, Couch, Huggins and Hess29]. Repeat vaccination studies showed that, on average, the serological response to subsequent influenza vaccination was not impaired by previous vaccination [Reference de Bruijn, Remarque, Jol-van der Zijde, van Tol, Westendorp and Knook30–Reference Bernstein, Yan, Treanor, Mendelman and Belshe32] and that the frequency of serological infection and laboratory-confirmed clinical influenza was not influenced by previous vaccination [Reference Beyer, de Bruijn, Palache, Westendorp and Osterhaus28, Reference Keitel, Cate, Couch, Huggins and Hess29]. However, a significant degree of heterogeneity was observed in the serological protection rate obtained in first-time vaccinees compared with repeat vaccinees; this heterogeneity was attributed to differences in the antigenic distances among vaccine strains and also between the vaccine strains and the epidemic strain responsible for each outbreak [Reference Smith, Forrest, Ackley and Perelson33].
Here we focus on a different mechanism of interference and its long-term consequences in repeated vaccinees. Our analysis is based on competition between vaccination-induced and naturally acquired immunity. Using an original model, we examined whether repeated vaccination might have a deleterious long-term effect on the risk of influenza. Particular emphasis was given to the impact of repeated vaccination on the risk of influenza in elderly subjects.
MATERIALS AND METHODS
Lacking longitudinal data on influenza infection rates in individuals, we fitted a model describing recurrent influenza infection to average annual incidence rates.
Hypotheses and modelling of recurrent influenza infection
For simplicity, we did not separate the various types/subtypes of influenza viruses circulating in the human population. We also assumed that a given individual could only be infected once a year. The age distribution of the population was assumed to be constant. Finally, the yearly risk of infection was assumed to be independent of the time since the last episode of influenza and dependent on age and the total number of previous episodes.
The model describing recurrent influenza infection was based on the parameterization of the probability of acquiring a new episode of influenza between ages [a,a+1[. We define X a the random variable which counts the total number of infections i until age a;  the associated probability;
 the distribution of X a (
 ), and
 the conditional probability of a new influenza virus infection between ages [a,a+1[. By recursion
 , where T(k) is a transition probabilities matrix.
The calculation of the mean annual incidence rate of influenza virus infection per age is straightforward

with

A logistic function was chosen for P ii(a). This probability depends on several parameters, some of which quantify the annual average risk of influenza infection at different ages and β (the key parameter) quantifies the impact of previous infections on the risk of a new episode. Parameters were estimated with the minimum least-squares method, using the Broyden–Fletcher–Goldfarb–Shanno algorithm [Reference Press, Flannery, Teukolsky and Vetterling34]. Models were compared with a criterion derived from the likelihood ratio statistics [Reference Seber and Wild35].
Data
The average annual incidence rate of influenza by age among unvaccinated subjects was derived from data of the French Sentinel Network (1% of all French GPs, 250 000 cases of influenza-like illnesses described in terms of age and vaccination status) [Reference Carrat and Valleron36, Reference Valleron, Bouvet and Garnerin37]. Incidence rates per age were calculated over epidemic periods (8–12 weeks) [Reference Carrat, Flahault, Boussard, Farran, Dangoumau and Valleron38].
We applied several corrections to the rates per age: first, we took into account the fact that influenza virus infection can be asymptomatic by dividing the rates by a factor representing the proportion of symptomatic influenza infections, ranging from 90% to 70% between 0 and 15 years of age, and 70% above 15 years of age [Reference Frank, Taber and Wells39]. Second, a substantial proportion of individuals who have influenza-like illness do not seek medical advice, and the rates were therefore divided by the proportions of individuals who seek medical advice, ranging from 100% to 50% between 0 and 15 years of age, and 50% above 15 years of age [Reference Carrat, Sahler and Rogez40–Reference Monto, Koopman and Longini42]. Third, some individuals who seek medical advice do not consult a GP but a specialist (e.g. a paediatrician for their children), and the rates were thus divided by a factor representing the proportion of visits which are assumed to involve GPs, ranging from 10% to 80% between 0 and 15 years of age, and 80% above 15 years of age. Finally, we assumed that not all cases of influenza-like illness are due to influenza virus (role of other respiratory pathogens) and multiplied the rates by 70%, the approximate proportion of cases of influenza-like illness that are due to influenza virus [Reference Zambon, Hays, Webster, Newman and Keene43]. The obtained rates and the global pattern by age are consistent with minimum and maximum influenza virus infection rates based on serological surveys in the community [Reference Monto and Sullivan44, Reference Glezen, Taber, Frank, Gruber and Piedra45].
Vaccination scenarios
We explored different vaccination scenarios at various ages. Vaccine effectiveness (VE P) was entered as the ratio of the probability of influenza among vaccinees (ν) to the probability among non-vaccinees (u ν) of the same age and with same number of previous episodes, VE P=1−P ii+1(a)v/P ii+1(a)u ν. For simplicity, VE P was fixed and did not vary with age, the number of previous episodes, or the number of previous vaccinations. VE P corresponds to the situation observed in randomized controlled studies during the year following influenza vaccination. Our simulated vaccination scenarios did not consider potential herd immunity that may result from vaccination of large proportions of the population [Reference Fine46].
RESULTS
The best fitted model was of the form

and

with α 1=1·30 [95% confidence interval (CI) 0·68–1·93], α 2=1·07 (95% CI 0·63–1·52), and β=0·17 (95% CI 0·07–0·26) (Fig. 1).
Yearly influenza infection rates by age. Dots represent influenza infection rates by age during 18 epidemics and the blue solid line is their smoothed averages, calculated from data of the French Sentinel network (138 293 reported cases of influenza-like illness), in unvaccinated individuals between 0 and 65 years. The red solid line represents the corresponding infection rates obtained from the model best fitting these data, and the dashed red lines are the 95% confidence bandwidth.

Natural influenza infection reduced the risk of being re-infected by 15·4% (95% CI 7·1–23·0). The cumulative average number of influenza infections was 2·1 (95% CI 1·4–3·2), 3·9 (95% CI 2·6–6·0), 6·4 (95% CI 4·3–10·5) and 8·7 (95% CI 5·8–14·9) in individuals of ages 10, 20, 40 and 65 years respectively. The first episode of influenza occurs at a mean age of 3·3 years (95% CI 1·9–5·4) and the second at a mean age of 7·9 years (95% CI 5·0–12·6). At age 5 years, 28% (95% CI 12–46) of children remain free of influenza since birth.
The reference scenario assumes that influenza vaccination is given systematically from age 65 years, as recommended in the European Union (Table). In this case, an individual will experience 9·1 (95% CI 6·0–15·7) episodes of influenza up to age 99 years, of which only 0·4 (95% CI 0·3–0·8) will occur after age 65 years. Influenza vaccination after age 65 years thus prevents 1·9 episodes (95% CI 1·2–3·8) of influenza between ages 65 and 99 years. In the scenario where influenza vaccination starts at 6 months (birth) and is repeated yearly, the overall expected benefit of influenza vaccination would be 6·0 (95% CI 3·9–11·0) episodes avoided during lifetime. However, this strategy would double the number of episodes after age 65 years by comparison with the reference scenario. The second scenario, corresponding to current recommendations on influenza vaccination (the live-attenuated vaccine up to 50 years, then the inactivated vaccine), gives similar results. Vaccination of individuals from age 50 years onwards would reduce the number of episodes by 1·1 in the 50–64 years age group and increase the number of episodes by 0·07 after 65 years. Finally, vaccination every 2 years would reduce the number of episodes by 2·6 (95% CI 1·6–5·0) before age 65 years, and increase it by 0·2 (95% CI 0·1–0·3) after 65 years.
Mean number of influenza episodes in various scenarios of repeated influenza vaccination compared to the baseline scenario (vaccination starting at age 65 years)
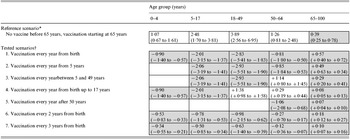
* Number in cells are mean numbers of influenza episodes and 95% CI values.
† Numbers in cells are differences relative to the reference scenario and 95% CI values. Grey cells indicate periods of vaccination.
The relative risks of influenza episodes, based on simulated cohorts of vaccinees and non-vaccinees, are depicted in Figure 2a. Influenza vaccination from birth increases the risk of episodes at all ages after 65 years by a factor of 2·4 (95% CI 1·9–2·5), by comparison with annual influenza vaccination starting after age 65 years. Vaccination of individuals after age 50 years increases the risk of influenza infection after 65 years by a factor of 1·16 (95% CI 1·13–1·20). Other simulated scenarios gave intermediate values.
Relative risks of influenza infection in to different scenarios of repeated influenza vaccination. Relative risks are calculated as the ratio of influenza infection rates expected in individuals in the scenarios listed in the Table, to influenza infection rates in individuals vaccinated yearly from 65 years. (a) The calculations assume constant β and VE P values. (b) Values for β and VE P decrease linearly with age between 65 years and 100 years (from 0·17 to 0·05 and from 85% to 25% respectively).
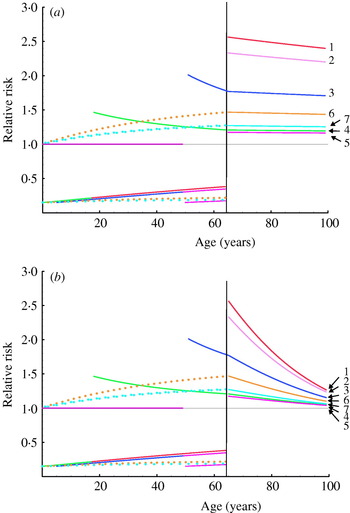
We also conducted a simulation in which vaccine effectiveness declines in old age: as expected, the absolute difference in the number of influenza episodes after 65 years of age between the reference scenario and other simulations increased, but the corresponding relative risk of infection was only slightly modified. We finally simulated a linear decrease in parameter β with age, to take into account ‘immune senescence’ [Reference Webster47]: the absolute difference in the number of influenza episodes after age 65 years between baseline and the simulated scenario increased, while the relative risk of infection fell but always remained higher than 1 (Fig. 2b).
DISCUSSION
Under the plausible assumption that protection against influenza infection lasts longer after naturally acquired infection than after vaccination, we show that repeated vaccination at a young age substantially increases the risk of influenza in older age. We integrated numerous hypotheses into the model. We assumed that influenza vaccination did not stimulate long-term cross-protective immunity, even though the live attenuated vaccine is accompanied by viral replication in the nose and thus mimics mild natural influenza infection [Reference Belshe48]. Our model could be modified to examine how yearly infection with a live vaccine strain might compete with natural influenza infection. However, we are unaware of examples where vaccination confers stronger and more sustained protection than natural infection against subsequent infection, and do not, therefore, believe that our results would be markedly modified. It would also have been easy to integrate different types or subtypes of influenza virus, or to compute different degrees of vaccine effectiveness or immune responses to natural infection with age, but none of these adjustments would have affected the overall results. Introducing a lag-time index in order to take into account the time elapsed since the last episode of influenza would allow the exploration of other vaccination strategies, e.g. strategies driven by the date of last infection. The resulting modified model would be hard to estimate but the average results would not be affected.
Our model does not deal with herd immunity. There are several reports suggesting that mass vaccination of children can result in a reduction in morbidity or mortality among non-vaccinated adults and elderly subjects [Reference Reichert, Simonsen, Sharma, Pardo, Fedson and Miller49, Reference Monto, Davenport, Napier and Francis50]. Substantial protection could be conferred on the community at large by mass vaccination of 70–85% of children with the cold-adapted influenza vaccine [Reference Longini, Halloran and Nizam51], and a recent report shows that lower vaccination coverage could produce a measurable benefit [Reference Piedra, Gaglani and Kozinetz52]. At a community level, depending on vaccination coverage, the number of influenza episodes avoided in the elderly by vaccine-induced herd immunity could then compete with the number of episodes resulting from repeated vaccination. However, herd immunity would not affect individual relative risks, and long-term repeatedly vaccinated individuals would remain at a higher risk than newly vaccinated individuals when entering old age.
Thus, using a simple model of recurrent influenza infection, we show that, by comparison with current vaccination policy, repeated influenza vaccination could double the risk of influenza in the elderly. The possible benefits of vaccinating children after 5 years of age, and otherwise healthy adults – particularly over a long period and mainly for economic reasons – could be outweighed by severe clinical consequences and increased costs in the elderly. This is solely due to differences between vaccine-induced immunity and naturally acquired immunity, and not to declining immune responses to vaccination in old age. These findings may have important implications for influenza vaccination policies and encourage long-term survey of annually vaccinated individuals.
ACKNOWLEDGEMENTS
We acknowledge the financial support of the French National Institute of Health and Medical Research (INSERM).
DECLARATION OF INTEREST
None.



