Implications
Improving welfare and minimizing stress are important topics in livestock production. This research evaluated the response of two stress biomarkers previously studied in sheep (salivary cortisol and α-amylase (sAA)) and four new salivary biomarkers of stress (lipase, total esterase (TEA), butyrylcholinesterase (BChE) and adenosine deaminase (ADA)) in sheep after exposure to two different stress stimuli. Lipase showed the greatest change with less overlapping with the animals used as controls. Salivary lipase is proposed as a potential stress biomarker in sheep, a novel contribution to the stress literature with regard to this species. These results could help in the evaluation and assessment of stress in sheep in a simple and easy fashion.
Introduction
Farm animals are exposed to different stressors associated with routine handling procedures. An adequate control of these stressors is important since long-term stress has negative effects on animal health and production (Grandin, Reference Grandin1998; Yardimci et al., Reference Yardimci, Sahin, Cetingul, Bayram, Aslan and Sengor2013). In ruminants, stress response involves both the hypothalamic-pituitary-adrenal (HPA) and the sympatho-adrenalmedullary (SAM) axes (Ferguson et al., Reference Ferguson, Bruce, Thompson, Egan, Perry and Shorthose2001). The first one is related to situations associated with long-term stress leading to the release of high levels of cortisol. The second one is related to acute stress, leading to the release of catecholamines in serum and also an increase in sAA. Both cortisol and sAA can be measured in the saliva of sheep and have shown their value as HPA (Yates et al., Reference Yates, Ross, Hallford, Yates and Wesley2010; Hild et al., Reference Hild, Coulon, Schroeer, Andersen and Zanella2011) and SAM (Fuentes-Rubio et al., Reference Fuentes-Rubio, Fuentes, Otal, Quiles and Hevia2016) axes activation biomarkers, respectively.
Lipase and BChE are enzymes whose presence in saliva has been described in animal species such as pigs (Tecles et al., Reference Tecles, Contreras-Aguilar, Martínez-Miró, Tvarijonaviciute, Martínez-Subiela, Escribano and Cerón2017). Salivary lipase increases in pigs after an acute stress episode (Tecles et al., Reference Tecles, Contreras-Aguilar, Martínez-Miró, Tvarijonaviciute, Martínez-Subiela, Escribano and Cerón2017), perhaps because its secretion is regulated by the sympathetic nervous system (Lee et al., Reference Lee, Purcell, Borysewicz, Klein and Werlin1992). The function of BChE in saliva is unknown. In humans it is related to attention deficit hyperactivity disorders (Archana et al., Reference Archana, Pai, Prabhu, Shenoy, Prabhu and Rao2012) or Alzheimer’s disease (Sayer et al., Reference Sayer, Law, Connelly and Breen2004). It also has been associated with acute stress in humans (Sánchez-Amate et al., Reference Sánchez-Amate, Flores and Sánchez-Santed2001), rats (Tagliari et al., Reference Tagliari, dos Santos, Cunha, Lima, Delwing, Sitta, Vargas, Dalmaz and Wyse2010) and pigs (Tecles et al., Reference Tecles, Escribano, Martínez-Miró, Hernández, Contreras and Cerón2016a). Total esterase activity comprises several esterases and increases in stress situations in humans (Tecles et al., Reference Tecles, Tvarijonaviciute, De Torre, Carrillo, Rubio, García, Cugat and Cerón2016b) and pigs (Tecles et al., Reference Tecles, Contreras-Aguilar, Martínez-Miró, Tvarijonaviciute, Martínez-Subiela, Escribano and Cerón2017). Adenosine deaminase is an enzyme present in serum and most tissues, especially lymphoid tissues (Adams and Harkness, Reference Adams and Harkness1976), and it is considered to be a biomarker of cell-mediated immunity (Baganha et al., Reference Baganha, Pêgo, Lima, Gaspar and Cordeiro1990). In pigs, ADA activity in saliva is higher in lame animals than in healthy ones (Tecles et al., Reference Tecles, Rubio, Contreras-Aguilar, López-Arjona, Martínez-Miró, Martínez-Subiela and Cerón2018).
To the best of the authors’ knowledge, no reports exist regarding lipase, BChE, TEA or ADA activities in the saliva of sheep or in that of any other ruminant species. The aims of this study were to evaluate (1) if these enzymes can be measured in sheep saliva; (2) and if their activities change after acute stress episodes. For this purpose, two groups of animals were subjected to two different models of stress: one involved facing a dog, and the second one consisted of being sheared. The activities of the enzymes in saliva were studied before and after stress inductions, and their possible correlations with other proven stress biomarkers in saliva such as cortisol and sAA (Fuentes-Rubio et al., Reference Fuentes-Rubio, Fuentes, Otal, Quiles and Hevia2016), as well as with heart rate (HR), were assessed.
Material and methods
Animals
Sheep of the Montesina breed were used in this research. This breed is originally from the southeast of Spain. The animals were located at the Teaching Farm of the University of Murcia (Spain). A flock of 40 female sheep (6.6±2.1 years) without lambs were used in the study. The animals were housed in a 783 m2 fold (33 m2 inside and 750 m2 outside the farm building) day and night, had ad libitum access to water and hay (clover and oats) and received 500 g/day of feed concentrate (15% CP, 2.7% fat, 16.3% fibre, 12.3% ash, 2.2% Ca, 0.57% P, 0.39% Na) throughout the whole trial.
Saliva sampling
Salivette (Sarstedt; Aktiengesellschaft & Co., Nümbrecht, Germany) tubes with a sponge instead a cotton were used. The sponge was placed with the help of forceps into the sheep mouth for 1 min. The sponges were then inserted in the tubes and kept on ice until arrival at the laboratory. Once within the laboratory, the tubes were centrifuged at 3000 g for 10 min at 4°C to obtain saliva specimens, which were analyzed as soon as they were obtained to avoid any effect due to storage.
Analytical methods
Salivary cortisol concentration was determined by the use of a solid-phase, competitive chemiluminescent enzyme immunoassay that used a polyclonal rabbit anti-cortisol antibody (Immulite/Immulite 1000 cortisol; Siemens Medical Solutions Diagnostics, Deerfield, IL, USA). Salivary α-amylase activity was measured using a commercially available method (α-Amylase; Beckman Coulter Inc., Fullerton, CA, USA) in the automated biochemical analyzer Olympus AU400 (Olympus Diagnostica GmbH, Ennis, Ireland). Both methods showed an imprecision of less than 15% (Supplementary Table S1) and high correlations in the linear regression analyses performed after linearity under dilution tests (Supplementary Figure S1).
The lipase activity in the saliva was measured using a commercially available method (Lipase, Beckman Coulter Inc.) based on the ability of lipase to hydrolyze the heavy-chain esterified fatty acid 1,2-diglyceride, which is a specific substrate for lipase (Graca et al., Reference Graca, Messick, McCullough, Barger and Hoffmann2005). Butyrylcholinesterase was analysed as previously described (Tecles et al., Reference Tecles, Escribano, Martínez-Miró, Hernández, Contreras and Cerón2016a) using the chromophore 5,5’-dithiobis-2-nitrobenzoic acid (Sigma-Aldrich Co., St Louis, MO, USA) and the substrate butyrylthiocholine iodide (Sigma-Aldrich Co.) which is specific to this enzyme (Tecles et al., Reference Tecles, Tvarijonaviciute, De Torre, Carrillo, Rubio, García, Cugat and Cerón2016b and Reference Tecles, Contreras-Aguilar, Martínez-Miró, Tvarijonaviciute, Martínez-Subiela, Escribano and Cerón2017). Total esterase was analyzed as previously reported (Tecles et al., Reference Tecles, Contreras-Aguilar, Martínez-Miró, Tvarijonaviciute, Martínez-Subiela, Escribano and Cerón2017) using 4-nitrophenyl acetate (Sigma-Aldrich Co.) as a substrate. The total ADA activity was measured using a spectrophotometric automated method (Adenosine Deaminase Assay Kit, Diazyme Laboratories, Poway, CA, USA) based on the enzymatic deamination of adenosine to inosine, which is specific for this enzyme (Tecles et al., Reference Tecles, Rubio, Contreras-Aguilar, López-Arjona, Martínez-Miró, Martínez-Subiela and Cerón2018). All these analyses were performed using an automated biochemical analyzer (Olympus AU400).
Analytical validation of the new methods
Lipase, BChE, TEA and ADA assays were validated for sheep salivary samples. The following validation characteristics were determined.
Imprecision
This was expressed as CV. Two pools of saliva samples containing high and low activities of any analyte were used. These pools were obtained by mixing the same volume of saliva from five stressful or control sheep samples. Within-run CV was determined by analysing the pools six times in a single analytical run. Coefficient of variation was calculated as percentage of the standard deviation of the replicates divided by the mean.
Accuracy was indirectly investigated by linearity under dilution. This was determined by using two samples of sheep saliva with different levels of enzymatic activity serially diluted (1 : 2, 1 : 4, 1 : 8, 1 : 16, 1 : 32) with deionized water. Afterwards, linear regression between the observed and the expected results was performed and the slope, y-intercept and R 2 were calculated.
Stress experiments
Before the stress experiments, the animals were previously made accustomed to the procedure for saliva collection. In addition, the sheep were always handled by the same personnel so that the sheep were used to their presence and handling. The experiments were performed at the same time (between 0900 and 1220 h) on different days. The behaviour of the sheep was recorded during saliva sampling by direct observation to detect possible fear behaviour by the evaluation of three previously described signs of fear (Romeyer and Bouissou, Reference Romeyer and Bouissou1992). The signs were immobilization (defined as the absence of movement of any limb), escape (defined as the animal jumping or running) or high-pitched bleats. The presence or absence of these signs was recorded during the exposure of the sheep to the stressors and saliva sampling. This procedure was performed at each sampling event.
Two experiments for stress induction were performed. Experiment 1 was based on the protocol described by Cook and Jacobson (Reference Cook and Jacobson1995) to induce stress in the sheep by facing a predator (a dog). This model was selected since these authors demonstrated that the presence of a dog clearly elevates salivary cortisol and none of the sheep used in this study had been in contact with a dog. The experiment group was composed of 14 sheep that were required to face the stressful stimulus (the stress group), while five sheep that were not required to face the dog were used as controls (the control group).
One day before the stress induction took place, the whole flock of 40 sheep was taken from the fold, in which they are usually housed, and taken to a compound of 26 m2 located outside the farm building, where they stayed for 30 min. The five animals selected for control group 1 were sampled. The first sample was taken during the first 30 min (basal time, TB). Subsequently, each animal was sampled for 1 min (T+0A), for a second minute (T+0B), at 15 min (T+15), at 30 min (T+30) and at 60 min (T+60) after the T+0A sample. Heart rate was also measured using a stethoscope from the left side of the thorax. The animals were then returned to the fold. None of the five animals included in the control group was selected for the stress induction.
The day of the stress induction the whole flock of 40 sheep were taken from the fold to the 26 m2 compound, where they stayed for 30 min. During this time, basal saliva samples (TB) were taken from 14 randomly selected animals. Then, one animal was individually taken to a second compound of 15 m2 where it was submitted to the stressor. This second compound was located inside the building to avoid the other sheep seeing the stressor stimulus. Once in the second compound, the animal was restrained with a fence against a wall and was introduced to a barking dog which was on a leash to prevent any physical contact with the sheep. The dog remained in close proximity to the sheep for 1 min and saliva was obtained during this time (T+0A). The dog was then removed and a new saliva sample was taken during the minute just following its’ removal (T+0B). After this, the sheep was returned to the first compound with the other animals. Saliva samples were obtained 15 min (T+15), 30 min (T+30) and 60 min (T+60) following the stressor stimulus. Heart rate was also taken as well as described earlier. This procedure was repeated for the 14 animals selected for the stress induction.
The stressor in experiment 2 was shearing. As in experiment 1, the control group – composed of five animals – was sampled one day before the shearing following the same procedure as in experiment 1, with the exception that the elapse time between T+0A and T+0B was 5 min instead of 1 min.
The day of the stress induction, the 40 sheep were placed in the first 26 m2 compound outside the building 30 min before the beginning of the experiment, where basal saliva sample (TB) was taken from 14 randomly selected sheep for stress induction (they were different from the control animals). Then, all animals were moved together to an 18 m2 handling facility located inside the farm building. The animals were removed from the flock 1 at a time, held with belts by the legs, kept in a lying position and sheared with a shearing machine. Shearing took approximately 5 min per animal and saliva sample was taken during this time (T+0A). When shearing was finished the belts were removed, the sheep was allowed to stand up, and a new saliva sample was immediately taken (T+0B). The sheep was then returned to the first compound and saliva samples were obtained at 30 min (T+30) and 60 min (T+60) from the stressor stimulus. Heart rate was also taken at TB, T+0B, T+30 and T+60. The necessary handling of the sheep during shearing and the noise of the shearing machine prevented the proper recording of the HR at T+0A. This procedure was repeated for the rest of the animals. None of the animals selected in experiment 2 had previously been used in experiment 1.
Statistical analysis
Data were checked for normality using the Kolmogorov–Smirnov test. Salivary α-amylase, lipase, BChE and TEA showed non-normal distribution, so they were log transformed before analysis to restored normality. Two-way ANOVA of repeated measures followed by Tukey’s multiple comparison test were used to assess whether or not the different analytes had changed compared to the control groups and at different times after the stress stimuli within the stress groups. Spearman or Pearson r were calculated between the analytical parameters depending on whether the data were non-normally or normally distributed, in order to know whether correlation with the traditional stress parameters sAA, cortisol and HR existed; an r value of less than 0.3 was considered as a negligible correlation, following the Rule of Thumb (Hinkle et al., Reference Hinkle, Wiersma and Jurs2003). A P value less than 0.05 was considered as being statistically significant. Data analyses were performed using spreadsheet software (Excel 2000; Microsoft Corporation, Redmond, WA, USA) and Graph Pad Software Inc (GraphPad Prism, version 5 for Windows; Graph Pad Software Inc., San Diego, CA, USA).
Results
Analytical validation
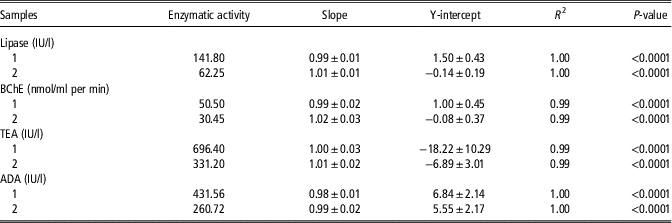
Lipase, BChE, TEA and ADA tests provided within-run CVs lower than 5% with both pools with high and low enzyme activities (Table 1). Linear regression analysis provided R 2 higher than 0.99 in all assays when linearity under dilution was assessed (Table 2).
Mean, SD and CV obtained in the imprecision study for assays validation in two pools of sheep saliva with high (A) and low (B) levels of each analyte

BChE=butyrylcholinesterase; TEA=total esterase; ADA=adenosine deaminase.
CV are given in %.
Linear regression analysis between expected and observed results from a linearity of dilution study of two samples of sheep saliva (1 and 2) with different levels of enzymatic activity

BChE=butyrylcholinesterase; TEA=total esterase; ADA=adenosine deaminase.
Experiment 1
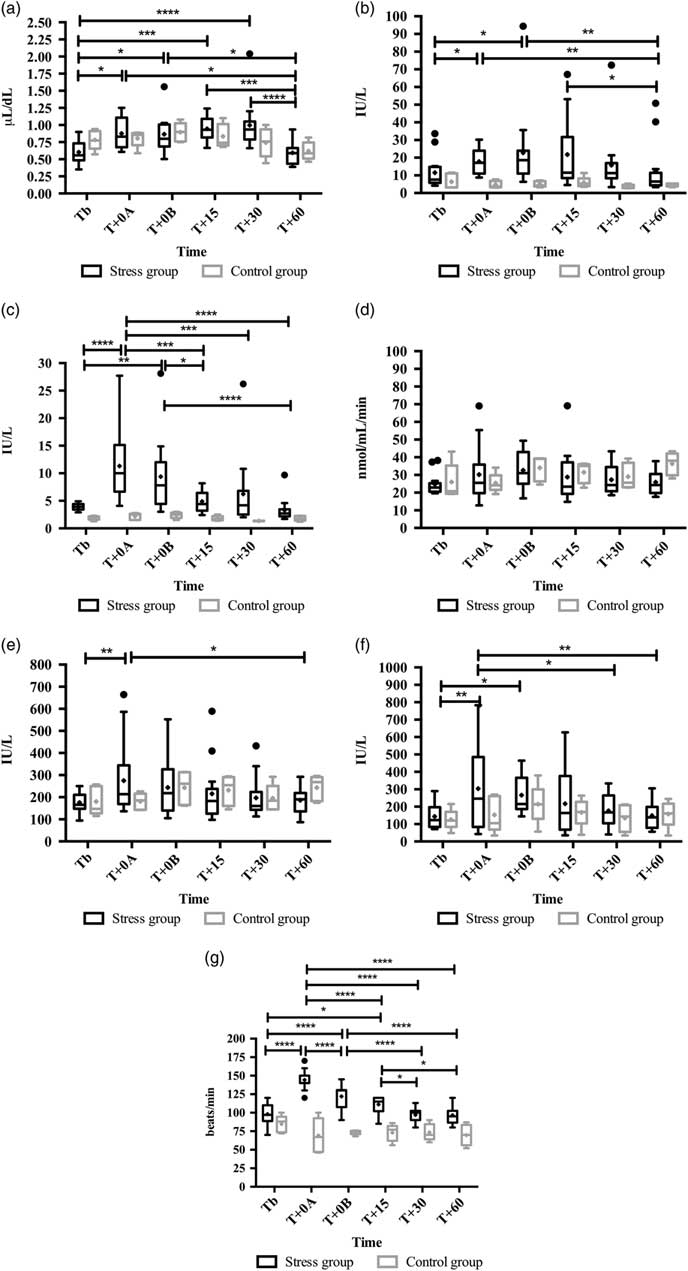
The results obtained in this experiment appear in Figure 1. The results indicated greater sAA activity in the stress group than in the control group (P<0.01). In the stress group, sAA increased at T+0A and T+0B when compared with the basal time (P<0.05). In contrast, the cortisol concentration was not statistically different between the control and the stress group, but in the stress group a significant increase in cortisol was observed at T+0A, T+0B (P<0.05 both), T+15 (P<0.001) and T+30 (P<0.0001) when compared to TB. No changes were observed in controls in terms of both analytes. Heart rate was statistically greater in the stress group (P<0.0001) than in the control group, showing significant increases at T+0A, T+0B (P<0.0001 both) and T+15 (P<0.05) compared with TB, whereas no changes in HR were observed in the control animals.
Salivary cortisol (a), α-amylase (b), lipase (c), butyrylcholinesterase (d), total esterase (e) and adenosine deaminase (f) activities, and heart rate (g) in experiment 1. Stress group consisted of 14 sheep submitted to stress by facing a dog; control group consisted of five sheep that were not submitted to the stressful stimulus. Saliva samples were taken before (TB), during (T+0A), just after (T+0B), and after 15 min (T+15), 30 min (T+30) and 60 min (T+60) of the stressor stimulus. The plots show median (line within box), 25th and 75th percentiles (box), 5th and 95th percentiles (whiskers) and outliers (●). The cross inside the box shows the mean. Statistical analysis in stress group: *P<0.05; **P<0.01; ***P<0.001; ****P<0.0001.

Lipase activity was statistically greater in the stress group compared to the control group (P<0.0001), with increased activity at T+0A (P<0.0001) and T+0B (P<0.01) when compared with TB. Neither BChE nor TEA activities were significantly different between groups, although TEA showed an increase at T+0A (P<0.01) in the stress group. Although there were no statistically significant differences in ADA activity between groups, Tukey’s posthoc analysis showed a significant increase at T+0A (P<0.01) and T+0B (P<0.05) in the stress group compared with TB.
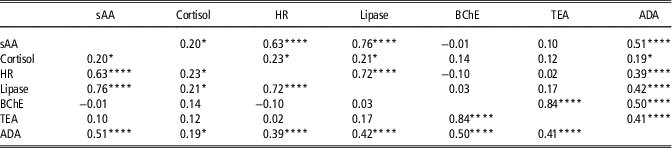
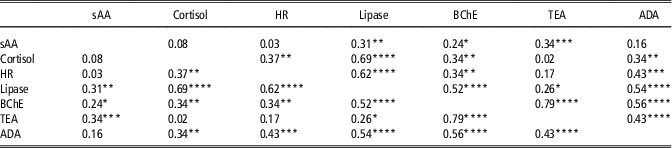
The correlation matrix between parameters appears in Table 3. The sAA results showed high and moderate positive correlations with lipase and ADA, respectively. Cortisol showed negligible correlations with lipase and ADA. Heart rate correlated highly with lipase and weakly with ADA.
Correlation coefficients between salivary α-amylase (sAA), cortisol, lipase, butyrylcholinesterase (BChE), total esterase (TEA), adenosine deaminase (ADA) and heart rate (HR) obtained in control sheep and sheep submitted to a stress by facing a dog (n=114)

*P<0.05; ****P<0.0001.
An immobilization state was observed at T+0A and T+0B in all sheep facing a predator (a dog). However, they showed escape behaviour at Tb, T+15,T+30 and T+60. The control sheep showed an escape behaviour at all times in which saliva samples were obtained. No high-pitch bleating was recorded while the stressor was present, or throughout the saliva sampling.
Experiment 2
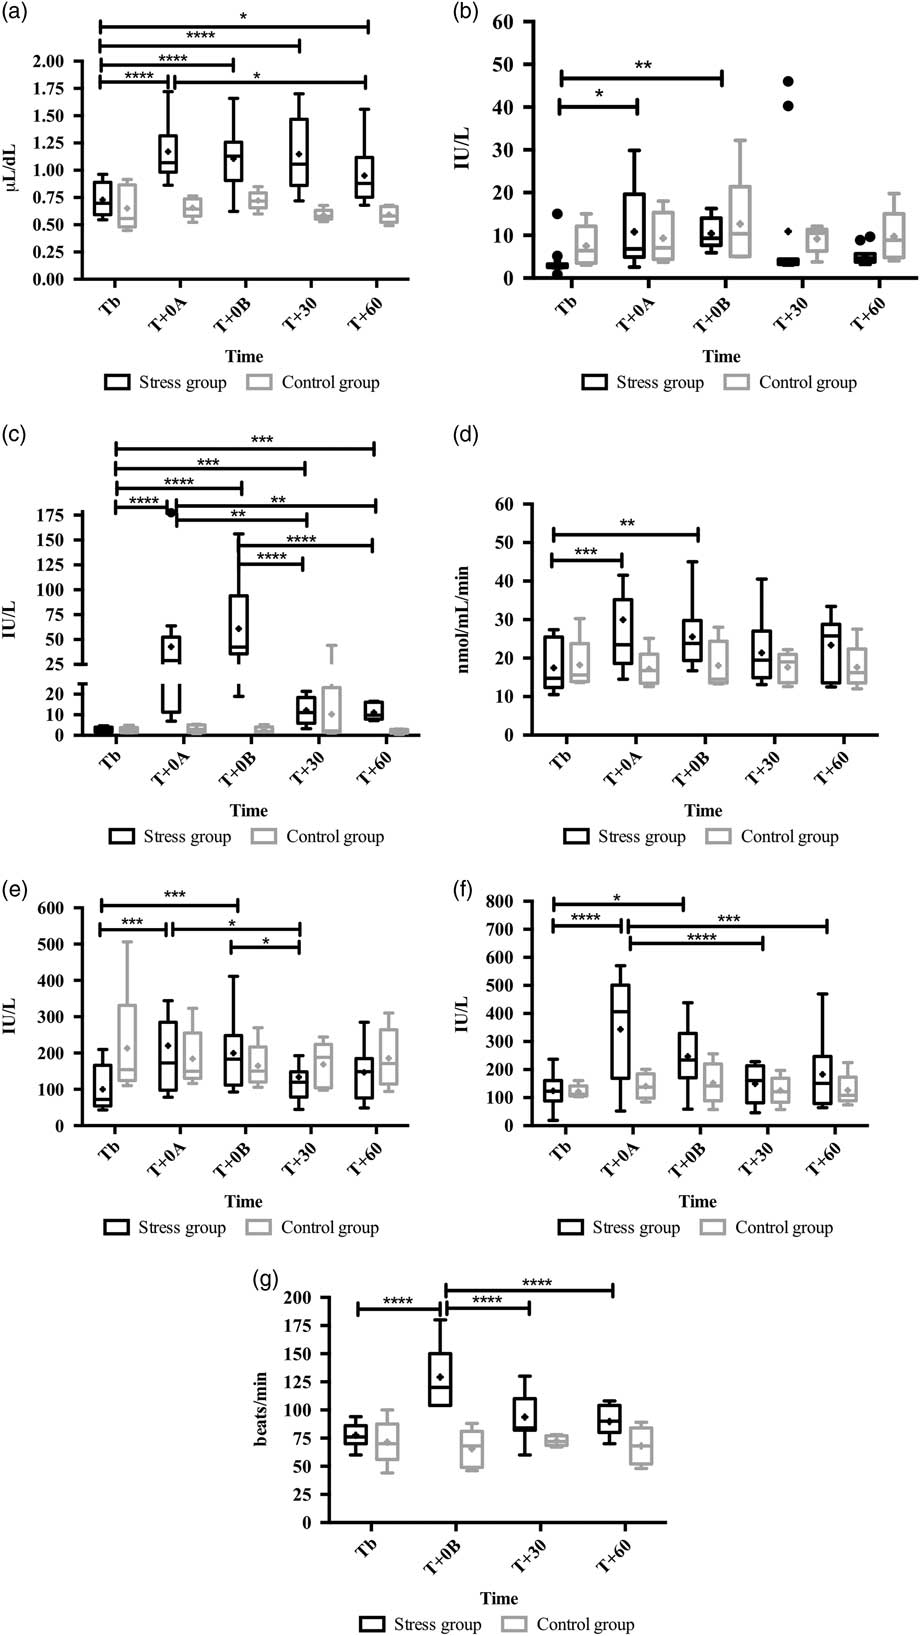
The results obtained in this experiment appear in Figure 2. Although no difference was observed between control and stress groups in terms of their sAA activities, a significant increase appeared in the stress group at T+0A (P<0.05) and T+0B (P<0.01) when compared with TB, whereas no change was observed in the controls. In contrast, cortisol concentration was significantly greater in the stress group (P<0.01) than in the control group, and a significant increase was observed at T+0A (P<0.0001), T+0B (P<0.0001), T+30 (P<0.0001) and T+60 (P<0.05) compared with TB. Heart rate was significantly greater in the stress group than in the control group (P<0.001), with a significant increase at T+0B (P<0.0001) compared to the basal values.
Salivary cortisol (a), α-amylase (b), lipase (c), butyrylcholinesterase (d), total esterase (e) and adenosine deaminase (f) activities, and heart rate (g) in experiment 2. Stress group consisted of 14 sheep submitted to stress by shearing; control group consisted of five sheep that were not submitted to the stressful stimulus. Saliva samples were taken before (TB), during (T+0A), just after (T+0B), and after 30 min (T+30) and 60 min (T+60) of the stressor stimulus. The plots show median (line within box), 25th and 75th percentiles (box), 5th and 95th percentiles (whiskers) and outliers (●). The cross inside the box shows the mean. Statistical analysis in stress group: *P<0.05; **P<0.01; ***P<0.001; ****P<0.0001.

Lipase activity was significantly increased in the stress group compared with the control group (P<0.0001). In the stress group, lipase significantly increased at T+0A, T+0B (P<0.0001 both), T+30 and T+60 (P<0.001 both) when compared with TB. No difference was observed between stress and control groups with regard to TEA and BChE activities. However, in the stress group TEA increased significantly at T+0A and T+0B (P<0.001 both), and BChE at T+0A (P<0.001) and T+0B (P<0.01), compared with TB, whereas no change was observed in the control group. Although there were no statistically significant differences in ADA activity between control and stress groups, in the stress group ADA significantly increased at T+0A (P<0.0001) and T+0B (P<0.05) compared with TB.
The correlation matrix between parameters appears in Table 4. Salivary α-amylase showed weak positive correlations with TEA and lipase, whereas it correlated negligibly with BChE. Salivary cortisol showed a moderate positive correlation with lipase, and a weak positive correlation with ADA and BChE. Heart rate correlated moderately with lipase, and weakly with ADA and BChE.
Correlation coefficients between salivary α-amylase (sAA), cortisol, lipase, butyrylcholinesterase (BChE), total esterase (TEA), adenosine deaminase (ADA) and heart rate (HR) obtained in control sheep and sheep submitted to a shearing stress stimulus (n=95)

*P<0.05; **P<0.01; ***P<0.001; ****P<0.0001.
The sheep remained in an immobilized state while they were being sheared. However, they showed escape behaviour at all times when samples were taken, before and after shearing. The control sheep showed escape behaviour at all times when saliva samples were obtained. No high-pitch bleating was recorded while sheep were being sheared or being sampled.
Discussion
To the best of the authors’ knowledge, this is the first report in which lipase, BChE, TEA and ADA have been measured in the saliva of sheep, and evaluated as possible biomarkers of stress in this species. They were measured by assays that showed high repeatability and linearity. In addition, the assays for their measurement could be easily automated which provides advantages from the technical point of view. The values observed in healthy non-stressed sheep were different from those previously described in humans (Claus Henn et al., Reference Claus Henn, McMaster and Padilla2006; Rai et al., Reference Rai, Kaur, Jacobs and Anand2011; Tecles et al., Reference Tecles, Tvarijonaviciute, De Torre, Carrillo, Rubio, García, Cugat and Cerón2016b) and pigs (Tecles et al., Reference Tecles, Contreras-Aguilar, Martínez-Miró, Tvarijonaviciute, Martínez-Subiela, Escribano and Cerón2017 and Reference Tecles, Rubio, Contreras-Aguilar, López-Arjona, Martínez-Miró, Martínez-Subiela and Cerón2018).
An immobilization state was observed in all sheep while placed in stress situations in both experiments, but it was not observed in the control sheep. Romeyer and Bouissou (Reference Romeyer and Bouissou1992) reported the immobilization in sheep as a sign that appears in situations of acute stress. The acute stress induced in our experimental procedures could be due to different causes. For example, the isolation and unfamiliar surroundings in addition to the fear due to facing a predator could be the main factors that induced stress in experiment 1, or fear probably of the shearing machine, the process of shearing and the isolation, could induce stress in experiment 2 (Hargreaves and Hutson, Reference Hargreaves and Hutson1990; Carcangiu et al., Reference Carcangiu, Vacca, Parmeggiani, Mura, Pazzola, Dettori and Bini2008).
Lipase increased in saliva in sheep after our experimental stress procedures. Increases in lipase activity in saliva have been also described in pigs after an acute stress episode (Tecles et al., Reference Tecles, Contreras-Aguilar, Martínez-Miró, Tvarijonaviciute, Martínez-Subiela, Escribano and Cerón2017). Lipase was the analyte that showed the greatest percentage increase after both stimuli compared with basal time. In addition, this enzyme showed less overlap between stress and control groups than the other analytes (including both sAA and cortisol) measured in this report. In the times in which a statistical difference was observed with respect to TB, in both experiments, 21 values of sAA and 29 of cortisol were inside the range of results from the control groups, v. only eight values with regard to lipase. The response of the lipase was very fast, with peaks at T+0A for experiment 1 and at T+0B for experiment 2, and it showed significant correlations with both sAA and cortisol. Since salivary lipase secretion is regulated by the sympathetic nervous system (Lee et al., Reference Lee, Purcell, Borysewicz, Klein and Werlin1992), this could explain the high correlation with sAA in experiment 1. However, since the magnitude of increase was higher for lipase than for sAA, together with the fact that lipase showed a moderate correlation with cortisol and a low correlation with sAA in experiment 2, this leads us to postulate the possible existence of an additional mechanism for salivary lipase secretion that could also be related to the HPA axis activation. Further studies should be made to elucidate the possible reasons and physiological mechanisms that induce the increase of lipase in saliva after a stress condition.
Salivary BChE activity only increased in the shearing experiment, probably because this model induced more stress than the dog model or because the stressful stimulus lasted for 5 min, whereas the animals only faced the dog for 1 min. The relationship between cholinesterase (ChE) activity and stress is not fully understood, although some evidence exists with regard to this association. In mice suffering acute stress, increased ChE activity has been reported in nervous tissue. A transient increase of acetylcholine (Imperato et al., Reference Imperato, Puglisi-Allegra, Casolini and Angellucci1991), leading to a ChE overexpression (Kaufer et al., Reference Kaufer, Friedman, Seidman and Soreq1998; Meshorer et al., Reference Meshorer, Erb, Gazit, Pavlovsky, Kaufer, Friedman, Glick, Ben-Arie and Soreq2002), was proposed as a probable mechanism. In human beings, an increase in salivary ChE activity was associated with decreased parasympathetic activity (Fedorova et al., Reference Fedorova, Soendersoe Knudsen, Mouridsen, Nexo and Borghammer2015), that can appear in stressful situations (Yamanouchi et al., Reference Yamanouchi, Hayashida, Kuba, Sakimura, Kuroki, Togo, Katayama, Takamura and Eguchi2015).
Total esterase significantly increased following the two stress stimuli. However, a high overlap in the values was observed with the controls, resulting in no statistical difference between the stress and control groups. In humans and pigs, TEA increase has been reported due to physical (Tecles et al., Reference Tecles, Tvarijonaviciute, De Torre, Carrillo, Rubio, García, Cugat and Cerón2016b) and restraint (Tecles et al., Reference Tecles, Contreras-Aguilar, Martínez-Miró, Tvarijonaviciute, Martínez-Subiela, Escribano and Cerón2017) stress, respectively. In these previous studies it was found that lipase and BChE were important contributors to TEA activity. However, in our study TEA showed a high correlation with BChE, and a negligible correlation with lipase, which would indicate that in sheep saliva lipase is probably not a major component of TEA.
Adenosine deaminase activity in saliva increased in both experiments, reaching an early peak at T+0A, although this increase was higher and with less overlap between groups in experiment 2, probably due to the higher stress. Adenosine deaminase correlated moderately with sAA in experiment 1, and weakly with cortisol in experiment 2, so a certain link between salivary ADA and stress axes could be postulated.
A knowledge of the origin of the biomarkers in saliva could help to clarify the mechanisms responsible for their change after a stressful stimulus. For example, sAA is generated by the adrenergic stimulus of the salivary glands, whereas cortisol in saliva comes from blood (Rohleder and Nater, Reference Rohleder and Nater2009; Wittwer et al., Reference Wittwer, Krummenacher, La and Ehlert2016). Although no specific studies have been published with regard to ruminants, it could be postulated that BChE could be produced in the salivary gland, since BChE in blood is scarce or almost negligible in ruminants (Tecles and Cerón, Reference Tecles and Cerón2001). The existence of BChE activity in other parts of the digestive system in ruminants such as the gut mucosal cells (Sine et al., Reference Sine, Ferrand and Colas1988) and the detection of BChE in the salivary gland of other species such as the pigs, supports this suggestion. Some studies in rats and humans suggest that lipase is secreted in the saliva by the lingual serous glands (Hamosh and Burns, Reference Hamosh and Burns1977; Hamosh, Reference Hamosh1978). As in healthy and diseased dogs, there is no reported correlation between ADA in saliva and serum (Tecles et al., Reference Tecles, Rubio, Contreras-Aguilar, López-Arjona, Martínez-Miró, Martínez-Subiela and Cerón2018), the production in saliva might be independent of activity in serum.
Ideally, the control group should have been tested on the same day and at the same time of day as the stress group. However, this was not possible for logistical reasons since alll experimental procedures were made by the same researchers in order to minimize the experimental variability. Therefore, both groups were sampled on different days but at the same hour to avoid any diurnal influence on the results. Regarding the possible circadian variability, since no significant changes were observed in the results obtained in the control sheep during the experimental period, it could be postulated that there was not any diurnal influence on the results. In spite of this, further studies should be made since there is no available information about the circadian rhythm of these biomarkers in sheep saliva.
Conclusions
From the results of this study it can be concluded that lipase, TEA, BChE and ADA are enzymes present in the saliva of sheep and that they can be measured by using simple and fast colorimetric methods. Lipase was the enzyme that showed the greatest percentage increase following the stressful stimulus and demonstrated less overlapping with the control group in the two experimental models that we performed. Further studies should be done with regard to the possible application of lipase as a biomarker of stress in sheep.
Acknowledgements
This work was supported by the Seneca Foundation of Murcia Regional Government, Spain (grant number 19894/GERM/15). D. E. was granted by the postdoctoral program ‘Juan de la Cierva’ of the ‘Ministerio de Economía y Competitividad’, Spain. M. D. C.-A. was granted by the predoctoral contract ‘FPU’ of University of Murcia (R-605/2016), Spain. M. L.-A was granted by the predoctoral contract ‘FPU’ of the 'Ministerio de Educación, Cultura y Deporte' (FPU16/02170), Spain.
Declaration of interest
The authors have declared that no competing interests exist.
Ethics statement
All procedures involving animals were in accordance with the ethical standards of the Bioethical Commission of Murcia University (CEEA 431/2018).
Software and data repository resources
Our data are not deposited in an official repository.
Supplementary material
To view supplementary material for this article, please visit https://doi.org/10.1017/S1751731118002707