1 Introduction
Fast ion destabilized Alfvén modes are of interest to tokamaks, as they can lead to increased rapid ion losses and ultimately affect fusion efficiency. Therefore, the calculation of shear Alfvén wave (SAW) continuous spectrum (Barston Reference Barston1964; Grad Reference Grad1969; Sedláček Reference Sedláček1971; Uberoi Reference Uberoi1972; Tataronis & Grossmann Reference Tataronis and Grossmann1973; Appert Reference Appert1974; Chen & Hasegawa Reference Chen and Hasegawa1974; Dewar et al. Reference Dewar, Grimm, Johnson, Frieman, Greene and Rutherford1974; Hasegawa & Chen Reference Hasegawa and Chen1974; Goedbloed Reference Goedbloed1975; Pao Reference Pao1975; Chance et al. Reference Chance, Greene, Grimm and Johnson1977) is of crucial importance as it determines mode structures and dispersive properties of Alfvénic fluctuations excited by energetic particles (EPs) in fusion devices (Zonca & Chen Reference Zonca and Chen2014a,Reference Zonca and Chenb). It is well known that SAW and ion sound wave (ISW) continuous frequency spectra are coupled due to equilibrium magnetic field curvature (Pogutse & Yurchenko Reference Pogutse and Yurchenko1978; D'Ippolito & Goedbloed Reference D'Ippolito and Goedbloed1980; Kieras & Tataronis Reference Kieras and Tataronis1982; Cheng, Chen & Chance Reference Cheng, Chen and Chance1985; Cheng & Chance Reference Cheng and Chance1986) and that their structures should be considered self-consistently. Being able to describe realistic geometries and plasma non-uniformity is therefore of crucial importance to compare numerical results with experiments. For these reasons, following Chen & Zonca (Reference Chen and Zonca2016, Reference Chen and Zonca2017) and Zonca & Chen (Reference Zonca and Chen2014a,Reference Zonca and Chenb), in Falessi et al. (Reference Falessi, Carlevaro, Fusco, Vlad and Zonca2019) we have shown how to calculate the two frequency spectra by solving the magnetohydrodynamics (MHD) equations in the ballooning space describing SAW-ISW waves propagating along magnetic field lines in general toroidal geometry. This approach corresponds to a mathematical formulation in the framework of the Floquet theory of ordinary differential equations with periodic coefficients (Salat & Tataronis Reference Salat and Tataronis1997); and it is equivalent to the typical one consisting in a spectral decomposition of the fluctuations in poloidal and toroidal angles and the null space (kernel) computation of the matrix of the highest-order radial derivative (Chance et al. Reference Chance, Greene, Grimm and Johnson1977) which is used by several codes, see e.g. Deng et al. (Reference Deng, Lin, Holod, Wang, Xiao and Zhang2012) or Könies & Eremin (Reference Könies and Eremin2010). Anyway, as already pointed out by Chu et al. (Reference Chu, Greene, Lao, Turnbull and Chance1992), the Floquet approach (Falessi et al. Reference Falessi, Carlevaro, Fusco, Vlad and Zonca2019) simplifies the calculation of the convoluted continuous spectrum structures at high mode numbers and/or near the plasma boundary. Within this framework, the general description of SAWs and ISWs using gyrokinetic theory has been given by Chen & Zonca (Reference Chen and Zonca2016) and Zonca & Chen (Reference Zonca and Chen2014a,Reference Zonca and Chenb), and allows us to include thermal plasma (Zonca, Chen & Santoro Reference Zonca, Chen and Santoro1996; Zonca et al. Reference Zonca, Chen, Santoro and Dong1998, Reference Zonca, Chen, Dong and Santoro1999; Lauber Reference Lauber2013; Bowden, Hole & Könies Reference Bowden, Hole and Könies2015; Lauber & Lu Reference Lauber and Lu2018) as well as EPs (Zonca & Chen Reference Zonca and Chen2014a,Reference Zonca and Chenb; Chen & Zonca Reference Chen and Zonca2016). Moreover, the generality of the formulation allows, in principle, the Floquet approach to be extended to include three-dimensional equilibrium effects. As shown by Falessi et al. (Reference Falessi, Carlevaro, Fusco, Vlad and Zonca2019), there is a straightforward connection of the present approach with the calculation of the generalized plasma inertia in the general fishbone-like dispersion relation (GFLDR), that is, the unified framework for describing Alfvénic fluctuations excited by EPs in tokamaks (Zonca & Chen Reference Zonca and Chen2014a,Reference Zonca and Chenb; Chen & Zonca Reference Chen and Zonca2016). The GFLDR can be used for macroscopic fluctuation stability and nonlinear dynamics studies to extract the distinctive features of the different Alfvén eigenmode (AE)/energetic particle mode (EPM) branches, thus illuminating the crucial physics responsible for the behaviours observed either experimentally, or by numerical simulations. This is of fundamental importance because, despite the advances made in gyrokinetic simulations, the precise interpretation of the observed fluctuations is often not sufficiently clear and is debatable. This is particularly the case of the mode structure and damping rate at the beta induced Alfvén acoustic eigenmode (BAAE) frequency range which will be briefly commented on in the next sections, keeping in mind the need of kinetic theory as pointed out in the references (Chavdarovski & Zonca Reference Chavdarovski and Zonca2009; Zonca et al. Reference Zonca, Biancalani, Chavdarovski, Chen, Di Troia and Wang2010; Lauber Reference Lauber2013; Chavdarovski & Zonca Reference Chavdarovski and Zonca2014; Zhang et al. Reference Zhang, Liu, Lin and Zhang2016; Bierwage et al. Reference Bierwage, Shinohara, Todo, Aiba, Ishikawa, Matsunaga, Takechi and Yagi2017). As an additional advantage, the Floquet approach allows us to determine precise boundary conditions for the calculation of (radially) local parallel mode structures (Zonca & Chen Reference Zonca and Chen2014a,Reference Zonca and Chenb).
Below, we follow and systematize the findings by Falessi et al. (Reference Falessi, Carlevaro, Fusco, Vlad and Zonca2019), that is a numerical approach for the calculation of coupled SAW-ISW Alfvén continuous spectra in the ideal MHD limit within the aforementioned theoretical framework, resulting in the development of the Floquet Alfvén continuum code (FALCON). Thanks to the generality of the theoretical formulation, the code structure is extremely schematic and entirely written in Python without compromising code performances. While the work by Falessi et al. (Reference Falessi, Carlevaro, Fusco, Vlad and Zonca2019) was focused mainly on the calculation of continuum frequency, we now outline the important role of fluctuation polarization, for which we also propose the Alfvénicity parameter as a proxy to gain further insights and guide physics intuition about the qualitative importance of collisionless damping. More precisely, Alfvénicity can be used to characterize radial singular structures by superimposing its magnitude as a colour bar in the continuous spectrum plots allowing, at a glance, one to determine the effective role of resonant excitation and to study the shaping and finite pressure effects on the continuous spectrum structures at low frequency (Chu et al. Reference Chu, Greene, Lao, Turnbull and Chance1992; Huysmans et al. Reference Huysmans, Kerner, Borba, Holties and Goedbloed1995; Goedbloed Reference Goedbloed1998; van der Holst, Beliën & Goedbloed Reference van der Holst, Beliën and Goedbloed2000). Below, SAW-ISW continuous spectra are calculated within three different levels of approximation for two reference cases, i.e. the ASDEX Upgrade (AUG)  $\#31213$ discharge and the Divertor Tokamak Test (DTT) double null scenario. The range of physical parameters of the two configurations, e.g.
 $\beta$, is large enough to investigate their effects on the continuum structures. Thus, our results allow verification and validation of a given simplified model.
The paper is organized as follows. In § 2 we recall the theoretical framework introduced in Falessi et al. (Reference Falessi, Carlevaro, Fusco, Vlad and Zonca2019). As original application, in § 3 and 4 we solve the MHD equations in the ballooning space for the SAW and ISW spectra in the two aforementioned reference scenarios. In § 5, we present our conclusions.
2 Theoretical framework and solution technique
In the following section, we briefly review the equations describing SAW-ISW continuum in the ideal MHD limit, which are solved by FALCON code using the mode structure decomposition approach (Lu, Zonca & Cardinali Reference Lu, Zonca and Cardinali2012) that asymptotically reduces to the ballooning formalism. The general theoretical framework is explored in Chen & Zonca (Reference Chen and Zonca2017) and is based on Zonca & Chen (Reference Zonca and Chen2014a,Reference Zonca and Chenb) while, more recently, we have shown how Floquet theory (Floquet Reference Floquet1883; Hill Reference Hill1886; Denk Reference Denk1995; Magnus & Winkler Reference Magnus and Winkler2013) can be applied to numerically solve this problem.
In this work, we study tokamak geometry and, therefore, without loss of generality, we assume an axisymmetric equilibrium magnetic field  $\boldsymbol {B}_{0}$ expressed in flux coordinates
 $(r,\theta ,\varphi )$
 \begin{equation} \boldsymbol{B}_{ 0 } = F ( \psi ) \boldsymbol{\nabla} \varphi + \boldsymbol{\nabla} \varphi \times \boldsymbol{ \nabla } \psi , \end{equation}
where  $\psi$ is the poloidal magnetic flux,
 $r = r(\psi )$ is a radial-like flux coordinate,
 $\varphi$ is the physical toroidal angle and the poloidal-like angular coordinate
 $\theta$ can be chosen such that the Jacobian
 $J = ( \boldsymbol {\nabla } \psi \times \boldsymbol {\nabla } \theta \boldsymbol {\cdot } \boldsymbol {\nabla } \varphi )^{ - 1 }$ has a convenient expression. Furthermore, we can define the straight field line toroidal angle
 $\zeta$ such that the safety factor
 \begin{equation} q = \frac{{\boldsymbol B}_0 \boldsymbol{\cdot} \boldsymbol{\nabla} \zeta}{{\boldsymbol B}_0 \boldsymbol{\cdot} \boldsymbol{\nabla} \theta} = q(r) \end{equation}
is a flux function. Following Connor, Hastie & Taylor (Reference Connor, Hastie and Taylor1978), we introduce the extended poloidal angle coordinate  $\vartheta$ and the following decomposition for the
 $n$th toroidal harmonic of a scalar field
 $\varPhi _s$:
 \begin{align} \varPhi_s (r,\theta,\zeta) & = 2{\rm \pi} \sum_{\ell \in \mathbb{Z}} \textrm{e}^{\textrm{i}n\zeta- \textrm{i}nq(\theta-2{\rm \pi} \ell)} \hat \varPhi_s (r,\theta-2{\rm \pi} \ell) \nonumber\\ & = \sum_{m \in \mathbb{Z}} \textrm{e}^{\textrm{i}n\zeta-\textrm{i} m\theta} \int_{- \infty}^{\infty} \, \textrm{d} \vartheta \textrm{e}^{\textrm{i}(m-nq)\vartheta} \hat \varPhi_s (r,\vartheta) . \end{align}
In this expression,  $\vartheta$ represents not only the ‘extended poloidal angle’ along magnetic field lines, but also, due to finite magnetic shear, the effective expression of a non-dimensionalized radial wave vector. Radial singular structures corresponding to the continuous spectra are obtained from the limiting forms of vorticity and pressure equations for
 $|\vartheta |\rightarrow \infty$ (Zonca & Chen Reference Zonca and Chen2014a,Reference Zonca and Chenb; Chen & Zonca Reference Chen and Zonca2017). In the mapping to
 $\vartheta$ space, periodic poloidal angle dependences of equilibrium quantities are replaced by the same dependences on
 $\vartheta$. While fluctuations must be periodic in
 $\theta$ space for physical reasons, they are generally not periodic in
 $\vartheta$. In Falessi et al. (Reference Falessi, Carlevaro, Fusco, Vlad and Zonca2019) we have introduced an appropriate angular coordinate to express the SAW frequency continuum more transparently; i.e.
 \begin{equation} \eta(\vartheta) \equiv 2 {\rm \pi} \frac{\displaystyle\int_{ 0 }^{ \vartheta } \, \textrm{d} \vartheta^{ \prime } |{\boldsymbol \nabla}r|^{-2}}{\displaystyle\int_{ 0 }^{ 2 {\rm \pi} } \, \textrm{d} \vartheta^{ \prime } |{\boldsymbol \nabla}r|^{-2}} . \end{equation}
By construction, the Jacobian  $J_{\eta }$ of this new set of coordinates, dubbed continuum flux coordinates (CFC), is such that
 $J_{\eta } B_{0}^{2}/|{\boldsymbol \nabla }r|^{2}$ is a flux function. Following Chen & Zonca (Reference Chen and Zonca2017) and Falessi et al. (Reference Falessi, Carlevaro, Fusco, Vlad and Zonca2019), we introduce the limiting forms of vorticity and pressure equations describing SAW-ISW singular structures propagating along magnetic field lines in CFC coordinates
 \begin{align} \left.\begin{array}{c@{}} (\partial_{ \eta }^{ 2 } + \hat{J}_{ \eta }^{ 2 } \hat{\rho}_{m0} \varOmega^{ 2 } ) g_{ 1 } = 2 \hat{B}_{ 0 } \hat{\rho}_{m0}^ { 1 / 2 } \hat{J}_{ \eta }^{ 2 } \hat{\kappa}_{ g } \varOmega\, g_{ 2 }, \\ \left( \partial_{ \eta }^{ 2 } - |{\boldsymbol \nabla}r | \partial_{ \eta }^{ 2 } | {\boldsymbol \nabla}r |^{ - 1 } + \dfrac { 2 } { \varGamma \beta } \hat{\rho}_{m0} \hat{J}_{ \eta }^{ 2 } \varOmega^{ 2 } \right) g_{ 2 } = 2 \hat{B}_{ 0 } \hat{\rho}_{m0}^ { 1 / 2 } \hat{J}_{ \eta }^{ 2 } \hat{\kappa}_{ g } \varOmega\, g_{ 1 } \end{array}\right\} \end{align}
where we have introduced the following dimensionless quantities:
 \begin{equation} \varOmega=\frac{\omega R_{0}}{\bar{v}_{A 0}}, \quad \hat{J}_{\eta}^{2} \equiv \frac{J_{\eta}^{2} \bar{B}_{0}^{2}}{R_{0}^{2}}, \quad \hat{\rho}_{m 0}=\frac{\rho_{m 0}}{\bar{\rho}_{m 0}}, \quad \hat{B}_{0}=\frac{B_{0}}{\bar{B}_{0}}, \quad \hat{\kappa}_{g}=\kappa_{g} R_{0}. \end{equation}
Here,  $v_{ A 0 }$ is the Alfvén velocity,
 $\rho _{m0}$ is the equilibrium mass density,
 $B_{0}$ is the equilibrium magnetic field,
 $\kappa _{g}$ is the geodesic curvature,
 $R_{0}$ is the radial position of the magnetic axis,
 $\varGamma$ is the ratio of specific heats and all the quantities marked with a bar are calculated on the magnetic axis. The FALCON code solves this linear system of second-order coupled differential equations within different levels of simplification and calculates the relative SAW-ISW continuous spectra as described in Falessi et al. (Reference Falessi, Carlevaro, Fusco, Vlad and Zonca2019). In particular, when the first and the second terms on the left-hand side of the second equation of (2.5) are negligible compared with the third one, i.e. when
 $\hat {\rho }_{m 0}/ \varGamma \beta \gg 1$, the set of coupled differential equations reduces to
 \begin{equation} (\partial_{\eta}^{2}+\hat{J}_{\eta}^{2} \hat{\rho}_{m 0} \varOmega^{2}- 2 \varGamma \beta \hat{J}_{\eta}^{2}\hat{B}_{0}^{2}\hat{\kappa}_{g}^{2}) g_{1} = 0; \end{equation}
describing the slow sound approximation (Chu et al. Reference Chu, Greene, Lao, Turnbull and Chance1992). Considering the limit  $\hat {\rho }_{m 0}/ \varGamma \beta \rightarrow \infty$ allows the neglecting of the third term of (2.7); thus, recovering the incompressible ideal MHD limit. In the following work, the SAW-ISW continuum is solved within these three levels of progressive simplification, that is, the whole equations (2.5), the slow sound approximation (2.7) and the incompressible ideal MHD limit.
Equations (2.5) and (2.7) are linear ODEs with periodic coefficients and, as extensively discussed in Falessi et al. (Reference Falessi, Carlevaro, Fusco, Vlad and Zonca2019), Floquet theory can be applied. After rewriting (2.5) and (2.7) as first-order systems, it can be shown that they must have solutions in the following form:  $\boldsymbol {x} =\textrm {e}^{\textrm {i} \nu \eta } \boldsymbol {P} ( \eta )$, where
 $\boldsymbol {P}$ is a
 $2 {\rm \pi}$-periodic vector function and
 $\nu$ is the characteristic Floquet exponent labelling the particular solution. In ‘Floquet stable regions’, i.e. where
 $\nu$ is real, solutions are defined by radial singular structures corresponding to the SAW-ISW continuous spectrum. Meanwhile, unstable regions with complex
 $\nu$ are characterized by regular solutions in the frequency gaps. It is possible to find these solutions for any given value of
 $r$; thus, calculating the dispersion curves
 $\nu = \nu (\varOmega ,r)$, which involve only local quantities and describe wave packets propagating along magnetic field on a given flux surface. We emphasize the fact that one of the key benefits of this approach is that the dispersion curves are independent of the toroidal mode number, thus allowing high
 $n$ values to be analysed without any resolution problems. Following Zonca & Chen (Reference Zonca and Chen2014a,Reference Zonca and Chenb), Chen & Zonca (Reference Chen and Zonca2016, Reference Chen and Zonca2017) and Falessi et al. (Reference Falessi, Carlevaro, Fusco, Vlad and Zonca2019), it is possible to relate the characteristic exponent to the toroidal and poloidal mode numbers; i.e. to express the continuous spectrum in the form
 \begin{equation} \nu^{ 2 } ( \varOmega , r ) = ( n q ( r ) - m )^{ 2 }. \end{equation}
Integrating equations (2.5) and (2.7) for different  $\varOmega$ values it is possible to calculate the continuous frequency spectrum for every value of the toroidal mode number retaining the effect of all poloidal harmonic couplings. Extensions to three-dimensional/stellarator geometry and gyrokinetic theory would be obtained in the same way from the more general governing equations (Zonca & Chen Reference Zonca and Chen2014a,Reference Zonca and Chenb; Chen & Zonca Reference Chen and Zonca2016).
In Chavdarovski & Zonca (Reference Chavdarovski and Zonca2009, Reference Chavdarovski and Zonca2014) and Zonca et al. (Reference Zonca, Biancalani, Chavdarovski, Chen, Di Troia and Wang2010), the crucial role of polarization is emphasized, due to its fundamental role in determining the finite parallel electric field and, ultimately, the mode damping due to collisionless dissipation. The actual assessment of mode damping requires gyrokinetic theory to be employed, especially in high- $\beta$ plasmas due to diamagnetic effects which can significantly alter collisionless damping and cause the coupling of different branches. In particular it is shown how fluctuations in the ‘BAAE frequency’ range can have Alfvénic polarization, thus showing strongly reduced Landau damping. Given the profound connection of mode damping with the acoustic rather than the Alfvénic character of the mode, it is, therefore, of crucial importance to fully characterize the mode polarization even in the ideal MHD limit. This information can be used as a proxy to anticipate the possible impact of kinetic effects, on the one hand. Furthermore, polarization knowledge allows us to assess the actual coupling of a given (physical) fluctuation with the continuous spectrum, characterized by the corresponding polarization. Thus, in Falessi et al. (Reference Falessi, Carlevaro, Fusco, Vlad and Zonca2019), without solving for the self-consistent mode structure and dispersion relation, qualitative information about the effective role of resonant excitation of continuum structures is obtained from the so-called Alfvénicity parameter,
 \begin{equation} {\mathcal{A}} = \frac{\displaystyle\int (g_1^{(i)}(\eta ; \nu,r))^2 \, \textrm{d} \eta}{\displaystyle\int [ (g_1^{(i)}(\eta; \nu,r))^2+(g_2^{(i)} (\eta; \nu, r))^2] \, \textrm{d} \eta}. \end{equation}
In the considered MHD limit,  ${\mathcal {A}} \simeq 1$ for SAW continuum, while
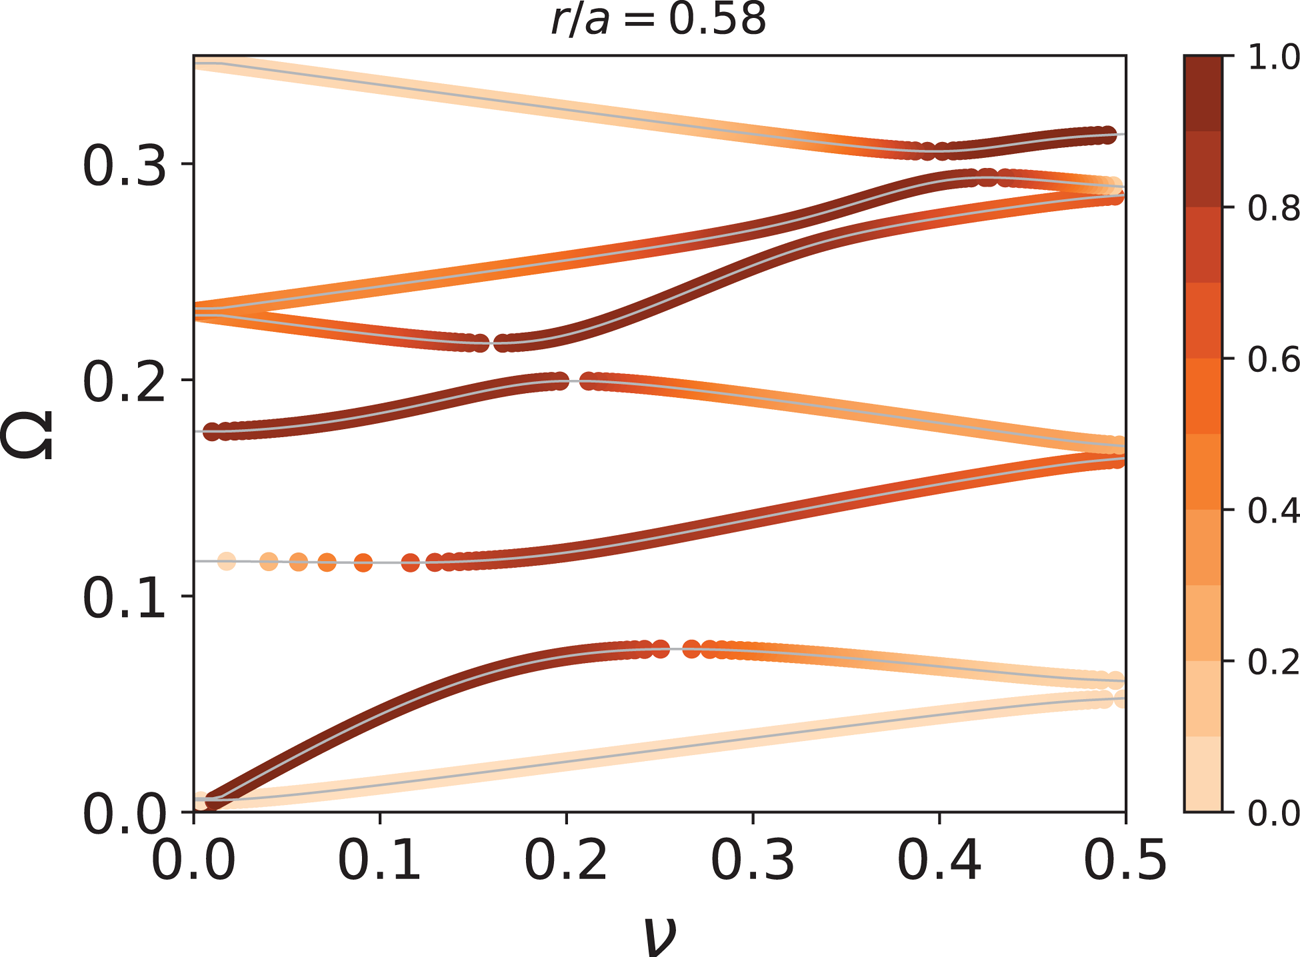
 ${\mathcal {A}} \sim {{O}}(\beta )$ for the acoustic continuum. A SAW polarized fluctuation has in general, weak interaction with the acoustic polarized continuum. Meanwhile, an ISW polarization weakly interacts with the SAW continuous spectrum. Polarization and Alfvénicity, connected to each other as discussed by Falessi et al. (Reference Falessi, Carlevaro, Fusco, Vlad and Zonca2019), are therefore of particular importance since the presence of continuum structures does not automatically imply damping (Chen & Hasegawa Reference Chen and Hasegawa1974; Hasegawa & Chen Reference Hasegawa and Chen1974). In particular, finite coupling with the continuous spectrum is generally possible, even for global modes, but it requires on the one hand the fluctuation to have finite amplitude where its frequency locally matches that of the continuous spectrum; and on the other hand the global mode local polarization not to be orthogonal to that of the continuum. As an illustrative example, in figure 1 we show the local dispersion curve
 $\nu (\varOmega ,r)$ obtained integrating equations (2.5) on a given flux surface of the DTT reference scenario (Albanese et al. Reference Albanese and Pizzuto2017, Reference Albanese, Crisanti, Martin, Martone and Pizzuto2019) using the Alfvénicity as a colour bar. The usual MHD accumulation point at
 $\varOmega = 0$ is the merging point of the low-frequency MHD fluctuations including inertia renormalization, characterized by predominant Alfvénic polarization (Chen & Zonca Reference Chen and Zonca2017). Here,
 $\varOmega = 0$ is also the accumulation point for the acoustic continuum with nearly orthogonal polarization with respect to the former one. Meanwhile, here, the BAAE gap is located at
 $\varOmega \simeq 0.1$, while the BAE gap is at
 $\varOmega \simeq 0.2$. It is instructive to note that polarization can be significantly modified along the dispersion curves, and that frequency by itself is not sufficient to fully characterize the properties (e.g. damping) of fluctuations, which also require detailed knowledge of spatial structures to be assessed. In this respect, the sharp variation of polarization along the third branch depicted in figure 1 is particularly significant. This happens because the two BAAE accumulation points arise from the interaction of, respectively, ISW-ISW and ISW-SAW counter-propagating waves. Therefore, as correctly described by the dispersion curves, the former is locally characterized by negligible Alfvénicity while the latter by a mixed polarization. A detailed analysis of the local dispersion curve structure and its interpretation in terms of co/counter- propagating waves has been given in Falessi et al. (Reference Falessi, Carlevaro, Fusco, Vlad and Zonca2019).
Plot of the local dispersion curve  $\nu (\varOmega ,r)$ at
 $r/a=0.58$ on DTT. The colour bar shows the Alfvénicity.

3 Application of FALCON to a DTT scenario
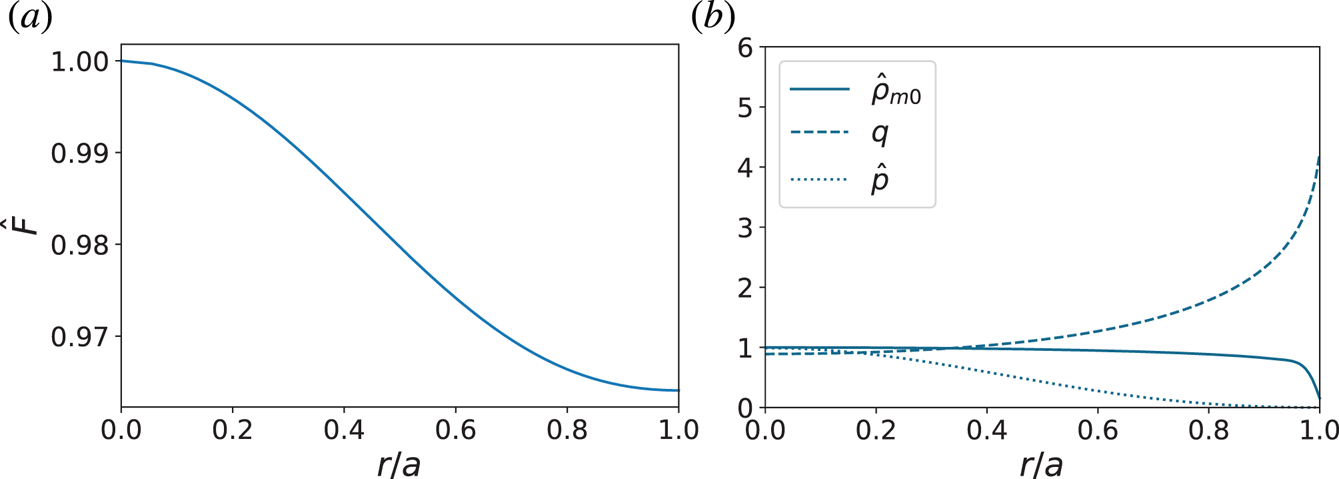
In this section, in order to illustrate an application of FALCON, we calculate the frequency continuum of SAW and ISW waves in a DTT reference scenario (Albanese et al. Reference Albanese and Pizzuto2017, Reference Albanese, Crisanti, Martin, Martone and Pizzuto2019). The same scenario has been analysed in Falessi et al. (Reference Falessi, Carlevaro, Fusco, Vlad and Zonca2019). The magnetic equilibrium has been originally calculated by means of the free boundary equilibrium evolution code CREATE-NL (Albanese et al. Reference Albanese, Calabrò, Mattei and Villone2003) and further refined using the high-resolution equilibrium solver CHEASE (Lütjens, Bondeson & Sauter Reference Lütjens, Bondeson and Sauter1996). We consider a double null configuration, whose basic profiles are depicted in figure 2 as a function of the normalized toroidal radius  $r/a$, i.e. the radial coordinate proportional to the square root of the toroidal magnetic flux. We note that, for the analysed case, the kinetic pressure on-axis is
 $1.0768\times 10^{6}\ \mathrm {Pa}$, the flux function
 $F$ on-axis is
 $12.95\ \mathrm {Vs}$, while the density is
 $2.0739 \times 10^{20}\ \mathrm {m}^{-3}$. The normalized density profile has been obtained by studies of plasma scenario formation using the fast transport simulation code METIS (Artaud et al. Reference Artaud, Imbeaux, Garcia, Giruzzi, Aniel, Basiuk, Bécoulet, Bourdelle, Buravand and Decker2018).
Plots of the main profiles for the DTT reference scenario. Every quantity except  $q$ is normalized to its value on the magnetic axis. In the panel (a), the toroidal flux function is depicted, while the panel (b) shows the kinetic pressure, the density and the safety factor
 $q$.

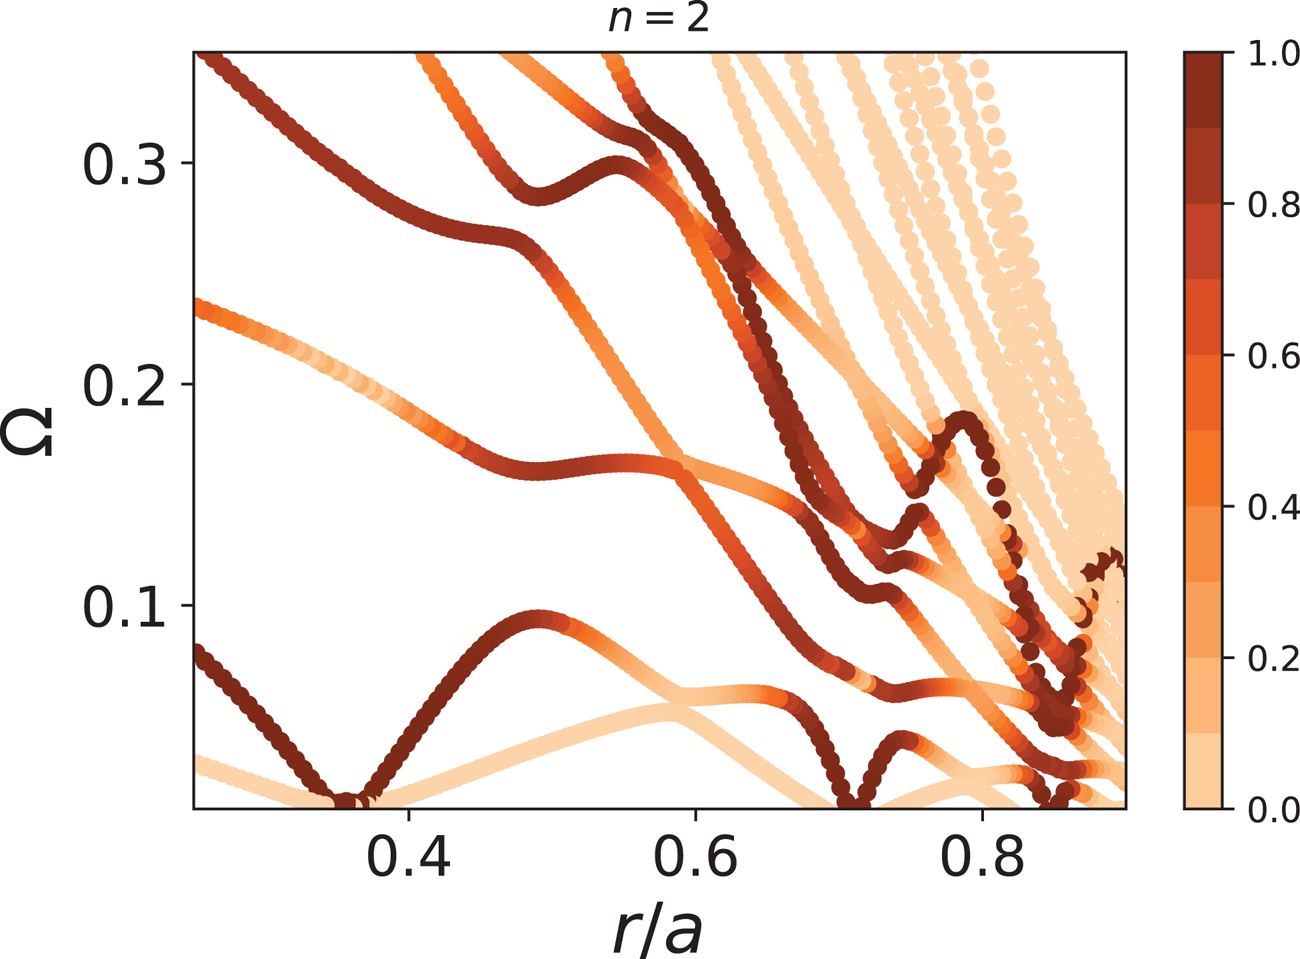
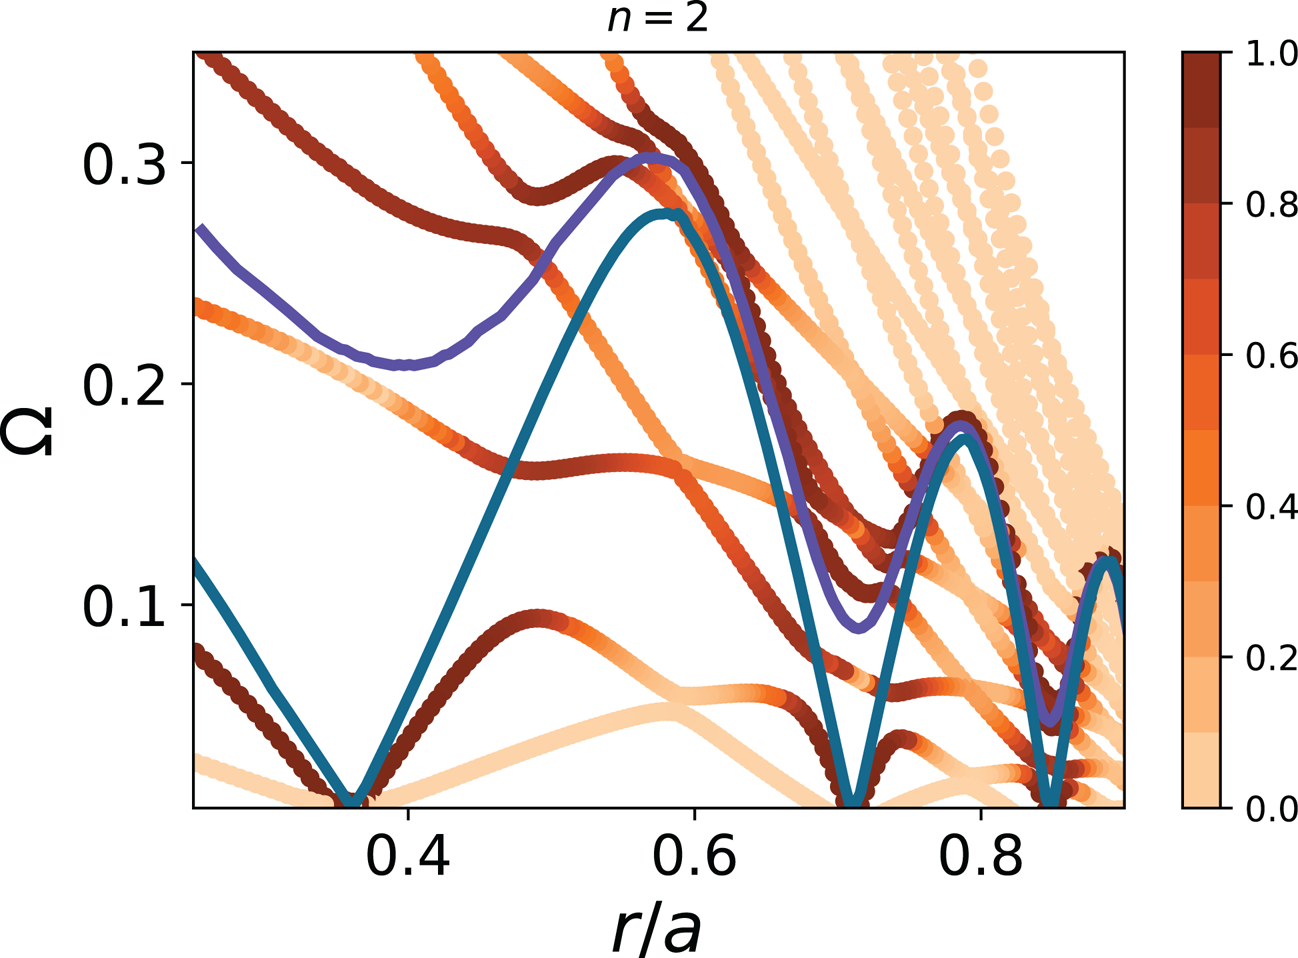
In figure 3, we show the behaviour of SAW-ISWs continuous spectra for a value of the toroidal mode number  $n = 2$. The code computes the Alfvénicity as introduced in (2.9), which is plotted as a colour bar. In particular, we note that this allows us to isolate SAW polarized branches when approaching the plasma edge. In fact, in this region, high-order ISW side-bands are present due to the low value of plasma pressure which must be coupled because of the shaping of the equilibrium. However, most of them are not physically relevant due to the stronger kinetic damping of the ISW branch. Furthermore, due to their negligible Alfvénicity, they would be weakly coupled to any fluctuation with prevalent Alfvénic polarization, for which the ‘web of acoustic continua’ near the plasma boundary is nearly transparent.
The SAW-ISW continuous spectrum as a function of  $r/a$ for
 $n=2$ in DTT. The colour bar show the Alfvénicity. For the sake of clarity, we did not plot all the acoustic branches nearby the plasma edge.

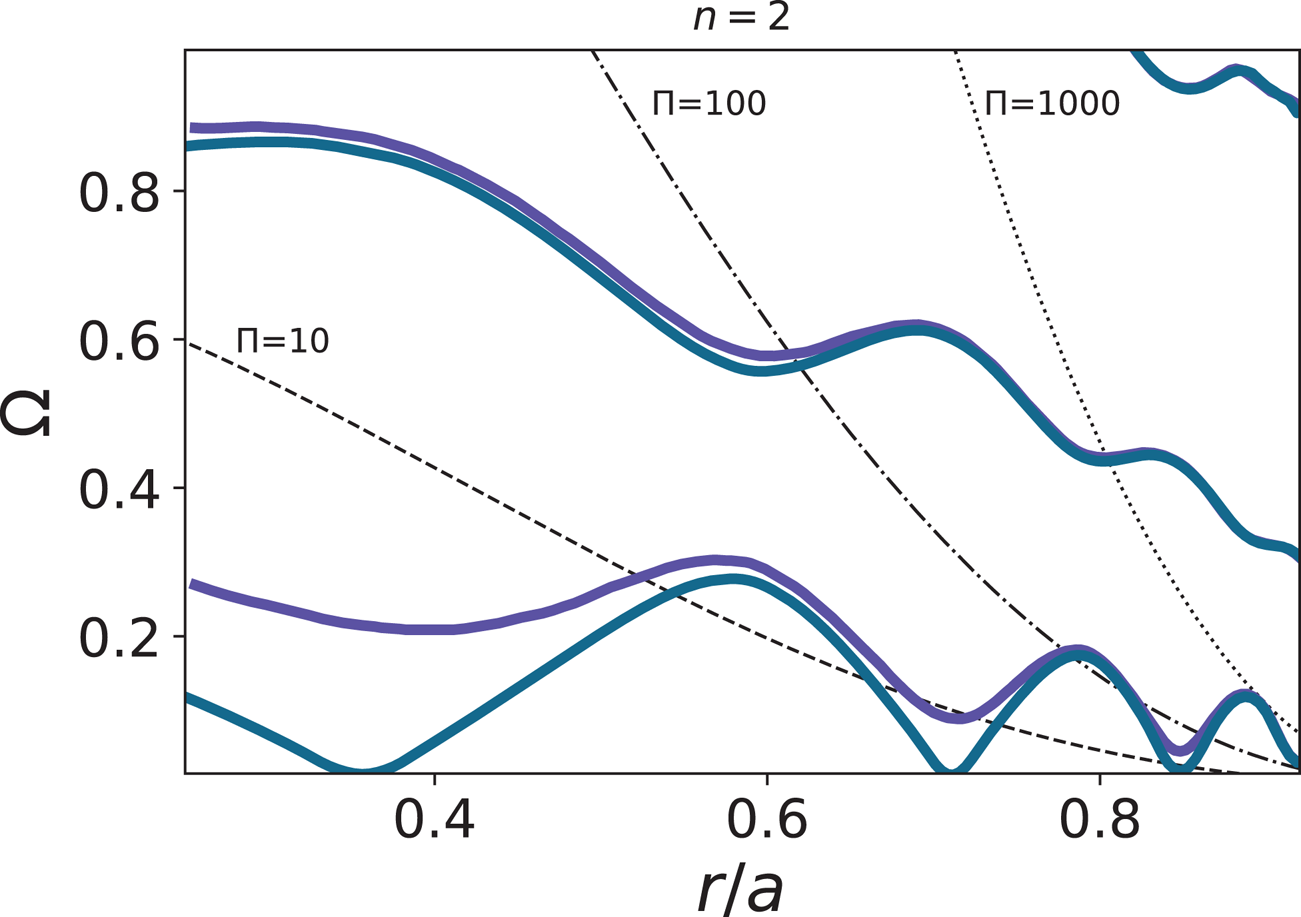
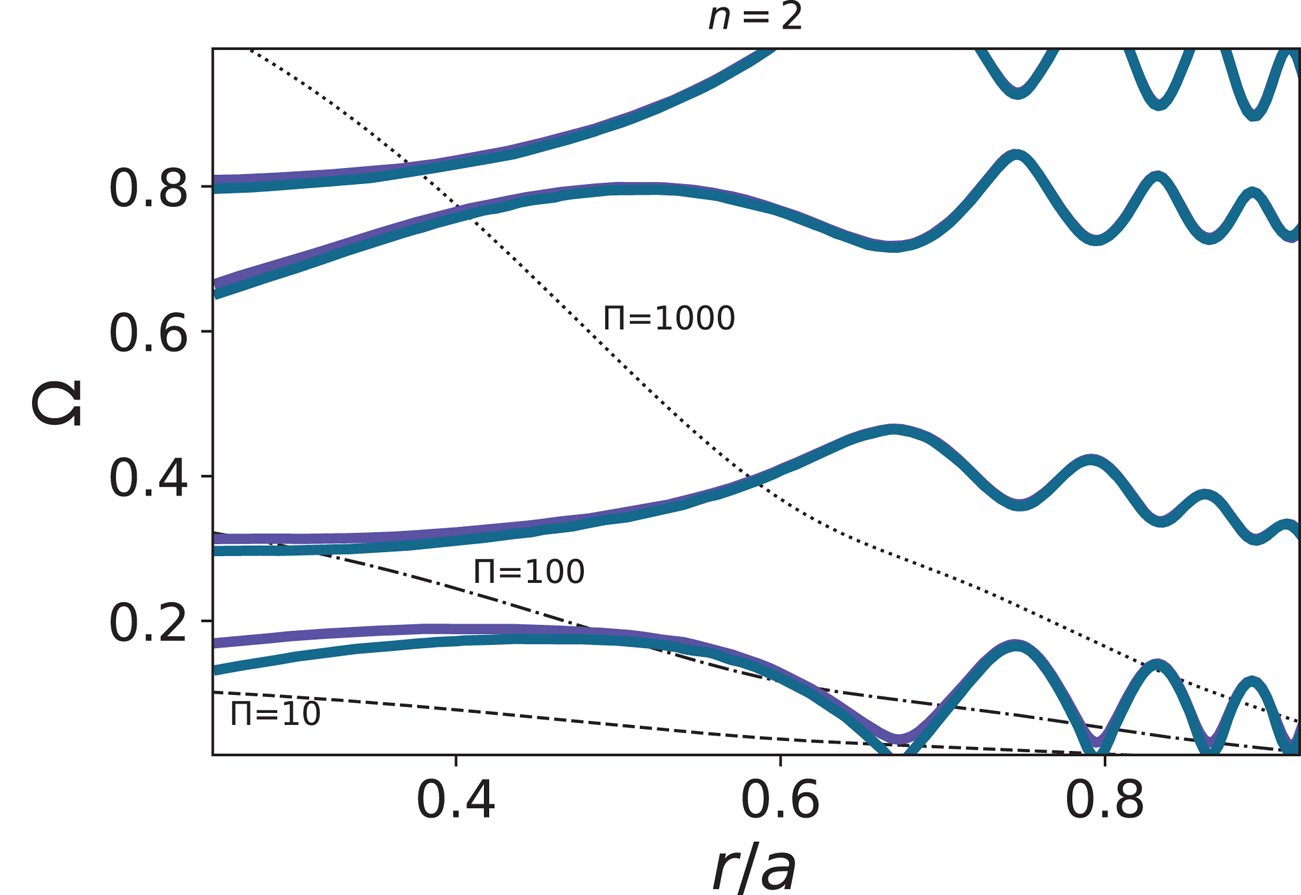
As already mentioned, FALCON solves the SAW-ISW continuum spectrum within different levels of simplification. In particular, in figure 4, we show the results obtained by using the slow sound approximation, i.e. (2.7), and compare it with the results obtained neglecting the coupling with ISWs in the incompressible ideal MHD limit. In the same figure, we plot the isolines of the flux surface averaged quantity  $\varPi = \langle \hat {\rho }_{m 0}/ \varGamma \beta \rangle _{\psi }$. As expected, the agreement between the two approximations is quite good when
 $\varPi$ is larger, i.e. approaching the plasma edge and at higher frequencies. By direct inspection of figure 4, we see that the first branch of the ideal SAW continuous spectrum is for a substantial part under the first
 $\varPi$ isoline, i.e.
 $\varPi = 10$. In this region SAW-ISW corrections with respect to the incompressible ideal MHD case are consistent, as we can infer from figure 3. In particular the BAAE gap (Gorelenkov et al. Reference Gorelenkov, Berk, Crocker, Fredrickson, Kaye, Kubota, Park, Peebles, Sabbagh and Sharapov2007a,Reference Gorelenkov, Berk, Fredrickson and Sharapovb, Reference Gorelenkov, Van Zeeland, Berk, Crocker, Darrow, Fredrickson, Fu, Heidbrink, Menard and Nazikian2009) extends up to
 $\varOmega \sim 0.25$ and, therefore, studying the complete system, i.e. (2.5), is mandatory in this range of frequencies. The slow sound approximation seems to be adequate in the region between the first two isolines, i.e.
 $10<\varPi <100$, since the corrections are very small with respect to the whole system. As anticipated, the incompressible MHD continuous spectrum agrees well with this approximation in the remaining portion of the plot. We note that, nearby the plasma edge,
 $\varPi$ increases very quickly with respect to
 $\varOmega$ variations. For this reason, results obtained with the three different levels of approximation are becoming more and more similar as the frequency decreases. This can be clearly seen in figure 5. In principle, the contour plot of
 $\varPi$ could be used routinely by the code to automatically choose the appropriate reduced model in the continuum equations, if needed, to possibly reduce the computational load and to illuminate the relevant physical processes.
The SAW-ISW continuous spectrum calculated using the slow-sound approximation as a function of  $r/a$ for
 $n=2$ on DTT, represented in purple. Results obtained in the incompressible ideal MHD limit are plotted in blue. Dotted and/or dashed lines describe curves of constant
 $\varPi = \langle \hat {\rho }_{m 0}/ \varGamma \beta \rangle _{\psi }$.

The SAW-ISW continuous spectrum obtained with different levels of simplifications on DTT as a function of  $r/a$ for
 $n=2$. The first branches obtained, respectively, with the slow sound approximation and ideal MHD incompressible limit marked in purple and blue. The colour bar shows the Alfvénicity.

In figure 5, we compare these results with the SAW-ISWs continuous spectrum already shown in figure 3. Again, the agreement between the slow sound approximation and the respective Alfvénic branch of the complete system is quite good for high frequencies and approaching the plasma edge. Furthermore, in regions where  $\varPi$ is significantly high, the ISWs coupling can be even neglected and the incompressible ideal MHD limit can be used. As already stated, complex low-frequencies continuum structures, e.g. the frequency gaps due to SAW-ISW and/or ISW-ISW couplings dubbed BAAE gap, can be described only by means of the complete SAW-ISW system.
4 Application of FALCON to an AUG scenario
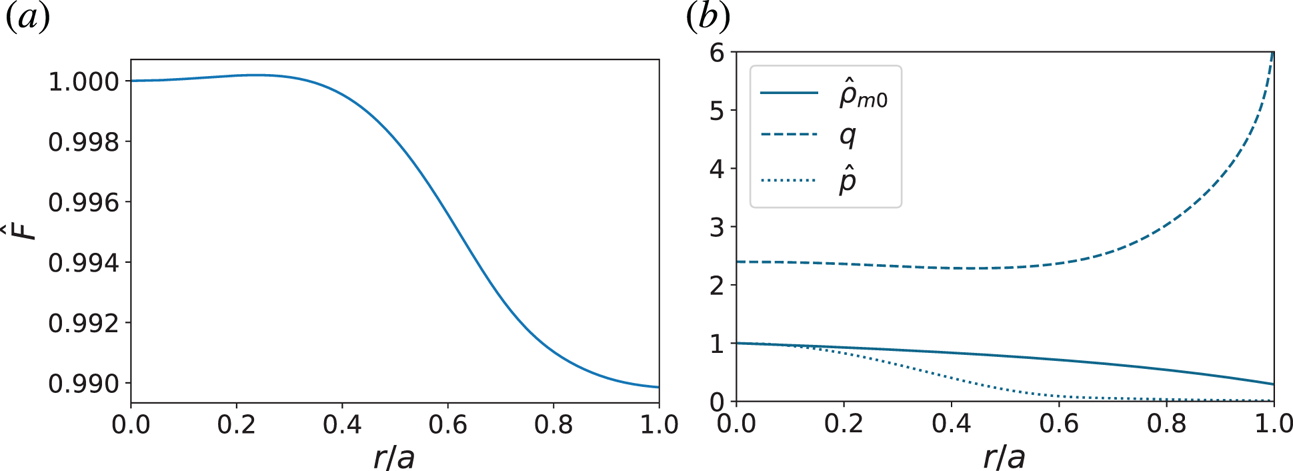
In this section, we perform the same analysis of § 3 applied to the AUG  $\#31213$ discharge. The magnetic equilibrium has been originally calculated by means of HELENA (Huysmans, Goedbloed & Kerner Reference Huysmans, Goedbloed and Kerner1991) and further refined using the high-resolution equilibrium solver CHEASE (Lütjens et al. Reference Lütjens, Bondeson and Sauter1996). We consider a single null scenario whose basic profiles are shown in figure 6 as a function of the normalized toroidal radius
 $r/a$. We note that, for the analysed case, the kinetic pressure on-axis is
 $3.0781\times 10^{4}\ \mathrm {Pa}$, the flux function
 $F$ on-axis is
 $3.68\ \mathrm {Vs}$, while the density is
 $1.3607 \times 10^{19}\mathrm {m^{-3}}$. It should be noted that this specific AUG plasma, namely the NLED-AUG reference case http://www2.ipp.mpg.de/~pwl/NLED_AUG/data.html, has a particularly low plasma
 $\beta$ in order to maximize the ratio
 $\beta _{EP}/\beta \sim 1$ for the detailed study of EP-induced instabilities (see, e.g. Horváth et al. (Reference Horváth, Papp, Lauber, Por, Gude, Igochine, Geiger, Maraschek, Guimarais and Nikolaeva2016) for the experimental analysis and depiction of the continuous spectrum with the eigenvalue code LIGKA (Lauber et al. Reference Lauber, Günter, Könies and Pinches2007; Vannini et al. Reference Vannini, Biancalani, Bottino, Hayward-Schneider, Lauber, Mishchenko, Novikau and Poli2020) for a linear and nonlinear theoretical analysis of the Alfvén eigenmodes with the initial value code ORB5 (Jolliet et al. Reference Jolliet, Bottino, Angelino, Hatzky, Tran, Mcmillan, Sauter, Appert, Idomura and Villard2007)). It is chosen here to demonstrate the influence of low and high
 $\beta$ on the polarization.
Plots of the main profiles in the AUG  $\#31213$ discharge. Every quantity except
 $q$ is normalized to its value on the magnetic axis. In the panel (a), the toroidal flux function is depicted, while the panel (b) shows the kinetic pressure, the density and the safety factor
 $q$.

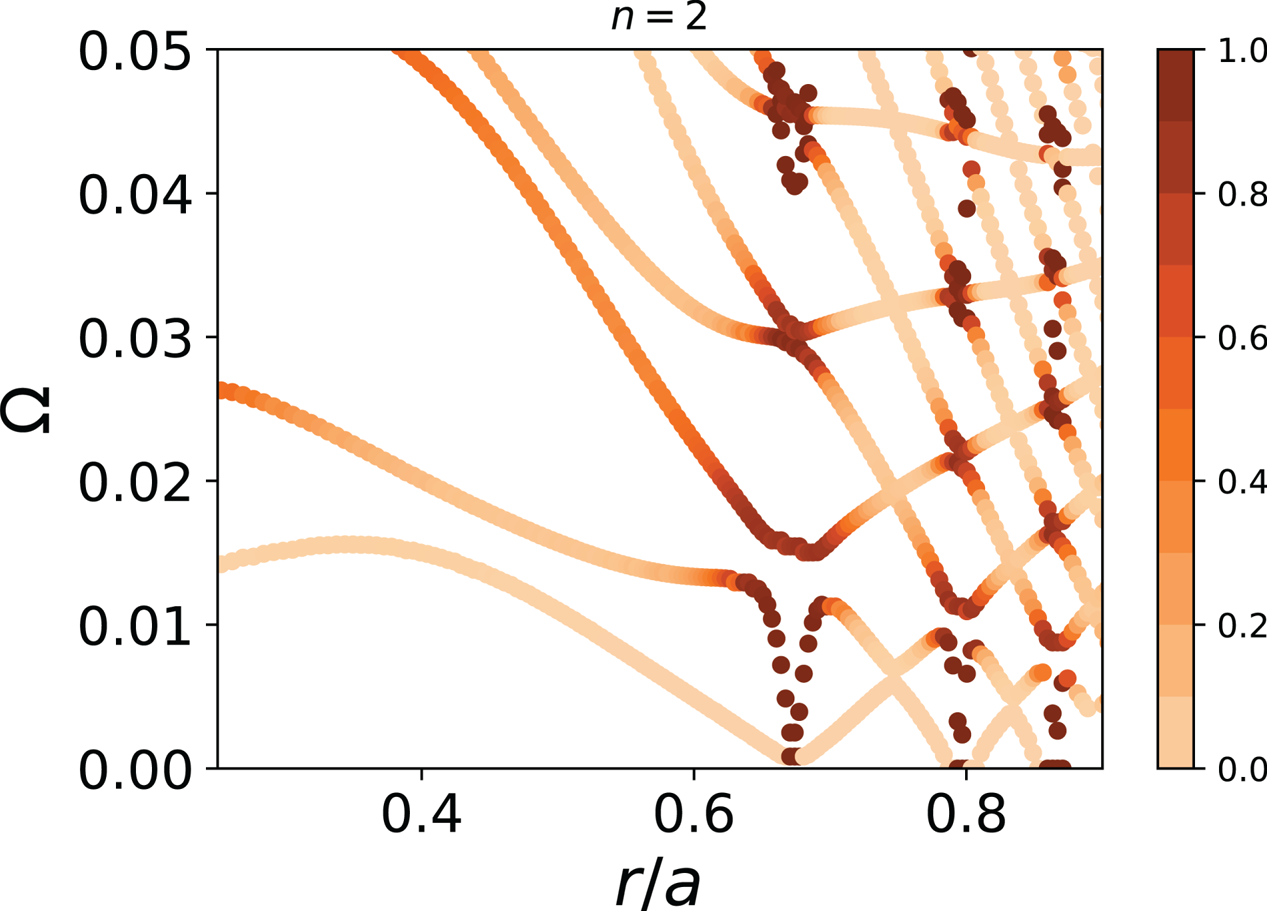
In figure 7 we show the results for the obtained SAW-ISWs spectra. The multiplicity of ISW branches with respect to the DTT reference case is due to the lower  $\beta$. In particular, the BAAE gap extend up to
 $\varOmega \sim 0.06$ As in the DTT case, Alfvénicity allows us to distinguish SAW polarized branches. Results obtained using the slow sound approximation and incompressible ideal MHD limit are illustrated in figure 8. As expected, the region of validity of this approximation in the
 $(\varOmega , r/a)$ plane is increased with respect to the DTT reference case, confirming that Alfvénic fluctuations in DTT plasmas will be more importantly affected by kinetic and compressibility effects than AUG (Lauber & Günter Reference Lauber and Günter2008; Lauber et al. Reference Lauber, Brüdgam, Curran, Igochine, Sassenberg, Günter, Maraschek, García-Muñoz and Hicks2009, Reference Lauber, Classen, Curran, Igochine, Geiger, da ç, García-Muñoz, Maraschek and McCarthy2012; Lauber Reference Lauber2013; Bierwage et al. Reference Bierwage, Shinohara, Todo, Aiba, Ishikawa, Matsunaga, Takechi and Yagi2017). The slow sound approximation correctly describes most of the propagation of SAW-ISW waves with frequencies above the BAE gap, while Alfvénic branches are also correctly represented in the majority of the plot by the incompressible ideal MHD limit. The structures at the BAAE frequency range appear to be less Alfvénic polarized with respect to the DTT reference scenario. Again, this is consistent with the findings reported in the literature (Lauber & Günter Reference Lauber and Günter2008; Lauber et al. Reference Lauber, Brüdgam, Curran, Igochine, Sassenberg, Günter, Maraschek, García-Muñoz and Hicks2009, Reference Lauber, Classen, Curran, Igochine, Geiger, da ç, García-Muñoz, Maraschek and McCarthy2012; Lauber Reference Lauber2013; Bierwage et al. Reference Bierwage, Shinohara, Todo, Aiba, Ishikawa, Matsunaga, Takechi and Yagi2017), which show that the acoustic branch in AUG is typically strongly damped and that modes in the BAAE frequency range are essentially kinetic ballooning modes with predominant Alfvénic polarization, where diamagnetic effects play important roles. More precisely, damping of the BAAE branch at AUG is found to be significantly reduced only very close to rational surfaces, again consistent with theoretical predictions (Lauber Reference Lauber2013).
The SAW-ISW continuous spectrum as a function of  $r/a$ for
 $n=2$ in the AUG
 $\#31213$ discharge. The colour bar shows the Alfvénicity.

The SAW-ISW continuous spectrum in the AUG  $\#31213$ discharge calculated using the slow sound approximation as a function of
 $r/a$ for
 $n=2$, represented in purple. Results obtained in the incompressible ideal MHD limit are plotted in blue. Dotted and/or dashed lines describe curves of constant
 $\varPi = \langle \hat {\rho }_{m 0}/ \varGamma \beta \rangle _{\psi }$.

5 Conclusions
In this work, following Falessi et al. (Reference Falessi, Carlevaro, Fusco, Vlad and Zonca2019), we have calculated the SAW-ISW continuous spectrum in realistic tokamak geometry by means of the newly developed FALCON code, using the theoretical framework introduced in Chen & Zonca (Reference Chen and Zonca2016, Reference Chen and Zonca2017) and Zonca & Chen (Reference Zonca and Chen2014a,Reference Zonca and Chenb) based on the mode structure decomposition/ballooning formalism (Lu et al. Reference Lu, Zonca and Cardinali2012). Apart from its simplicity, the main advantages of this formulation have been reviewed with particular attention to the ability to isolate the radially local (singular) behaviours of the continuous spectra and handle fluctuations with large toroidal mode numbers efficiently. These motivations guided us to create a new computational tool, i.e. the FALCON code. The proposed methodology clearly shows the significance of fluctuation polarization in the evaluation of damping by resonant absorption of singular radial continuous spectrum structures. Therefore, following Falessi et al. (Reference Falessi, Carlevaro, Fusco, Vlad and Zonca2019), an Alfvénicity parameter is introduced, which gives a qualitative estimate of the coupling strength of Alfvénic fluctuations to the acoustic continuum without solving for the actual fluctuation structures. Adopting DTT and AUG reference scenarios as examples of, respectively, high- and low- $\beta$ tokamak equilibria, the Alfvénicity parameter has been computed in the
 $(\varOmega ,r/a)$ plane, thus allowing us to properly characterize the physical nature of the observed spectra. Meanwhile, the FALCON code can now operate with different levels of simplification if needed for further speed-up, and, in particular, use the slow sound approximation, which is shown to be particularly relevant for the study of relatively low
 $\beta$ equilibria. Moreover, this approach not only allows one to address the structures of SAW and ISW continuous spectra in general toroidal geometry, but also provides the most straightforward way of computing the generalized inertia in the GFLDR for generic Alfvén and Alfvén acoustic modes (Zonca & Chen Reference Zonca and Chen2014a,Reference Zonca and Chenb; Chen & Zonca Reference Chen and Zonca2016). The current formalism, based on Floquet theory, is extremely general and could be extended to three-dimensional plasma equilibria such as stellarators and/or to the kinetic description of coupled SAW and ISW continua. Finally, it could be applied to calculate the boundary conditions for mode structures and their relative dispersion relations consistent with the GFLDR.
Acknowledgements
This work has been carried out within the framework of the EUROfusion Consortium and has received funding from the Euratom research and training programme 2014–2018 and 2019–2020 under grant agreement no. 633053. The views and opinions expressed herein do not necessarily reflect those of the European Commission. Authors thank the DTT and the ASDEX Upgrade Teams for providing the information on the respective reference scenarios.
Editor Bill Dorland thanks the referees for their advice in evaluating this article.
Declaration of interests
The authors report no conflict of interest.