Introduction
Retirement has become a key life course stage in most advanced economies (Costa, Reference Costa1998). While states typically provide publicly funded old-age pensions, they tend to be limited, leaving individuals with the responsibility of financially preparing for retirement, through active wealth accumulation (Foster, Reference Foster2011, Reference Foster2017; Gough and Adami, Reference Gough and Adami2012; McCarthy, Reference McCarthy2017). In light of this reality, multiple studies have explored drivers of inequality in retirement savings (Lusardi and Mitchell, Reference Lusardi and Mitchell2007; Miller, Reference Miller2013; Gough and Adami, Reference Gough and Adami2013; Payne et al., Reference Payne, Yorgason and Dew2014; Rottke and Klos, Reference Rottke and Klos2016). This article adds to this existing research by examining how spouses approach retirement preparation when their individual abilities to save differ.
More specifically, although the male breadwinner model is no longer the norm in western societies, and most couples are comprised of two earners, in many unions, incomes – and therefore saving capacities – remain unequal between spouses (Sweeney, Reference Sweeney2002; Schwartz, Reference Schwartz2010). Retirement scholars (and policy makers) have traditionally assumed that conjugality is an equalising force in retirement preparation and that financially heterogamous spouses share or balance their savings (Carman and Hung, Reference Carman and Hung2017; Metzger, Reference Metzger2018). Recent research, however, indicates that this assumption is too strong. For example, studies have found that joint investment accounts are especially uncommon among financially heterogamous couples (Kan and Laurie, Reference Kan and Laurie2014). Other studies show that substantial within-couple discrepancies exist in bank account savings (Lee and Pocock, Reference Lee and Pocock2007), pension funds (Carman and Hung, Reference Carman and Hung2017), net worth (Grabka et al., Reference Grabka, Marcus and Sierminska2015), and accumulated assets (Deere and Doss, Reference Deere and Doss2006). Importantly, those disparities are larger among spouses with an income differential than between equal earners and they typically disfavour women.
While those results clearly show that financially heterogamous spouses should not all be assumed to share or balance their retirement savings, do some of them do so? What might influence the propensity of this behaviour? Insights on those key questions remain limited, as growing research on intra-household savings allocation has not thus far focused on financially heterogamous spouses and explored the conditions under which they opt for equalising their retirement savings (Grabka et al., Reference Grabka, Marcus and Sierminska2015; Carman and Hung, Reference Carman and Hung2017; Metzger, Reference Metzger2018). Our analyses are designed to help fill in this gap. Building on both exchange and institutional theories of conjugal money management, we suggest that spouses with an income differential sometimes pool or otherwise equalise their retirement savings as a redistributive gesture. We also explore the individual and relationship characteristics associated with this practice. Our data are from a survey fielded in 2015 in Québec (Canada). Results from this study will allow policy makers to better understand circumstances that make partnered, lower-income individuals more likely to receive help from their spouse to prepare for retirement – and others that may leave them more vulnerable in old age.
Previous work on conjugal money management and redistribution
An important literature has developed on within-household economies. This stream of research suggests that financially heterogamous couples often engage in redistributive behaviour. For example, the more recent studies in this area have distinguished between two primary systems of money management: those in which partners pool their resources and those in which incomes are kept separate (Lauer and Yodanis, Reference Lauer, Yodanis, Treas, Scott and Richards2014; Pepin, Reference Pepin2019). Pooled systems are viewed as fostering equality (Vogler and Pahl, Reference Vogler and Pahl1993, Reference Vogler and Pahl1994; Pahl, Reference Pahl1995; Nyman, Reference Nyman1999). However, research on the presentation of conjugal togetherness stresses that primary earners often enjoy greater decisional power and can direct pooled resources to expenses they privilege (Vogler, Reference Vogler1998; Bennett et al., Reference Bennett, De Henau, Himmelweit, Sung, Scott, Plagnol and Dex2012). Lower earners may also feel illegitimate and limit their withdrawals from the family pot, so that, overall, pooled systems achieve resource redistribution, but usually not perfect equalisation (Nyman, Reference Nyman1999; Bennett and Sung, Reference Bennett and Sung2013).
In discussing the separate purse system, authors have suggested it preserves between-spouse disparities (Burgoyne and Lewis, Reference Burgoyne and Lewis1994; Vogler et al., Reference Vogler, Brockmann and Wiggins2006). Qualitative research, however, finds that even couples describing their finances as individualised tend to be redistributive, at least to some degree. For example, sharing may occur in an ad-hoc manner, through gifts, or more systematically, as when higher earners absorb a greater proportion of recurring expenses (Ashby and Burgoyne, Reference Ashby and Burgoyne2008, Reference Ashby and Burgoyne2009; Belleau and Proulx, Reference Belleau and Proulx2010; Evertsson and Nyman, Reference Evertsson and Nyman2014).
Two theoretical approaches to conjugal economic relations help explain why couples adopt redistributive behaviours. First, the specialisation and exchange perspective posits that primary earners trade financial resources for household work done by the lower earner. In this view, the extent of money redistribution from the higher to the lower earner depends on each party’s bargaining power (Becker, Reference Becker1981; Treas, Reference Treas1993; Amuedo-Dorantes et al., Reference Amuedo-Dorantes, Bonke and Grossbard2011). The institutional approach, meanwhile, suggests spouses are guided in establishing their economic arrangements by societal values and norms regarding conjugal conduct (Vogler et al., Reference Vogler, Brockmann and Wiggins2006; Stocks and Halleröd, Reference Stocks and Halleröd2007; Yodanis and Lauer, Reference Yodanis and Lauer2007). While those norms were once relatively homogenous under the dominant male breadwinner model, a multiplicity of discourses and ideals have now come to coexist (Vogler, Reference Vogler1998; Cherlin, Reference Cherlin2004).
One of those ideals posits that solidarity and dedication constitute defining values of love and family ties, promoting the adoption of conjugal redistributive practices (Schneider, Reference Schneider1968; Nyman, Reference Nyman1999; Swidler, Reference Swidler2003; Pepin, Reference Pepin2019). However, another key ideal of contemporary western societies calls on individuals to be independent and self-reliant in romantic relationships (Giddens, Reference Giddens1992; Beck and Beck-Gernsheim, Reference Beck, Beck-Gernsheim, Ritter and Wiebel1995). This ideal discourages redistribution, instead fostering equity in contributions (Burgoyne and Lewis, Reference Burgoyne and Lewis1994). Thus, according to the institutional view, the extent of sharing deployed by contemporary western couples depends primarily on where spouses stand on conflicting values of family solidarity and independence (Vogler, Reference Vogler1998; Ashby and Burgoyne, Reference Ashby and Burgoyne2008, Reference Ashby and Burgoyne2009; Bennett et al., Reference Bennett, De Henau, Himmelweit, Sung, Scott, Plagnol and Dex2012; Evertsson and Nyman, Reference Evertsson and Nyman2014).
As emphasised by previous work, the tension between those two values also shapes how redistribution is organised, on a practical level, not just how much of it occurs. Specifically, while redistribution rarely involves a complete equalisation of resources between partners, studies find that it often proceeds through the (implicit or explicit) marking of specific domains of consumption as areas in which values of conjugal fairness should prevail. For example, focussing on couples using a separate purse system, Evertsson and Nyman (Reference Evertsson and Nyman2014) have found that primary earners frequently believe their spouse should enjoy the same access as them to certain products and services, such as leisure activities. In those cases, primary earners cover the cost of those items or, in order to allow their partner to afford them, shoulder more of the other expenses. Similarly, Belleau and Proulx (Reference Belleau and Proulx2010) found that in couples employing the common pot system, many spouses deem it legitimate for the lower-earning partner to freely draw from the pot for certain expenses, such as health-related ones, but not for others.
While various rationales may orient how couples define the areas in which spouses should be equal, and although spouses may disagree on what those areas are – or on whether equality is truly achieved (Nyman, Reference Nyman1999) – they often correspond to realms viewed as important for material or psychological well-being. As scholars have emphasised, this practice of equalising the partners’ consumption in only certain (but important) areas helps spouses bridge ideals of solidarity and independence, as it performs fairness, albeit a bounded form of it that leaves room for individualism (Evertsson and Nyman, Reference Evertsson and Nyman2014).
Conjugal redistribution in the area of retirement savings
Though research stresses that financially heterogamous couples often achieve equality in only some domains, little research has investigated how spouses approach their consumption of specific goods or services. Do they view cultural outings as something both spouses should enjoy to the same extent? What about vacations? Here, we consider the case of retirement savings. As we already noted in introductory comments, research on within-couple wealth inequalities and the gender asset gap have ruled out the idea that all couples necessarily share their accumulated wealth (Deere and Doss, Reference Deere and Doss2006; Grabka et al., Reference Grabka, Marcus and Sierminska2015). In the context of growing life expectancy, however, private retirement savings are increasingly cast culturally as a critical resource for well-being in old age (Langley, Reference Langley2008; van der Zwan, Reference van der Zwan2014). Thus, we posit that some financially heterogamous couples may define retirement savings as a sphere in which conjugal equality should apply. In line with that idea, Metzger (Reference Metzger2018) found that retirement savings by one partner fosters savings by the other, suggesting partners may assist one another in building up retirement savings.
Heterogamous spouses might deploy various strategies to achieve balance in their retirement savings. For example, they may jointly own their investment accounts. The primary earner may also contribute to the lower earner’s account, save on his or her behalf, or, if using a pooled incomes system, allow withdrawals from the common pot for savings. Our measurement strategy to identify couples that are redistributive will reflect this variety. Also, previous research has stressed that several individual and relationship characteristics influence retirement savings allocation and adhesion to values of family solidarity and independence. We expect those characteristics affect redistributive behaviours in the area of retirement savings and our analyses will explore those patterns. We discuss each factor in turn.
Age and age heterogamy
Attitudes towards retirement change with age: concerns and savings for retirement increase as individuals get closer to retirement (Campanale et al., Reference Campanale, Fugazza and Gomes2015). Thus, we posit that spouses with an age difference may have diverging views on retirement and be less likely to balance their savings than age homogamous couples. Also, given that concerns for retirement grow with age, one could expect older couples to be more prone to balancing savings than younger ones. Consistent with this idea, Carman and Hung (Reference Carman and Hung2017) have found that the share of retirement savings in the name of the male partner (usually the higher earner) decreases with age.
Studies on money management among older couples, however, suggest an opposite prediction. Those works have shown that older couples often continue to operate the systems of money management that were dominant in earlier decades, in which a male breadwinner had full control over resources and defined an amount to be used by the caregiver (Bisdee et al., Reference Bisdee, Daly and Price2013). In this context, older couples may expect the male breadwinner to continue to provide for the caregiver through allowances following retirement, instead of helping her to save. Our analyses will explore how age relates to the management of retirement savings, in addition to examining its association with age heterogamy.
Specialisation
Financially heterogamous couples may feature a single breadwinner or two earners with unequal wages. Single-earner couples are more likely to pool their resources than dual earners with an income difference (Heimdal and Houseknecht, Reference Heimdal and Houseknecht2003; Lauer and Yodanis, Reference Lauer and Yodanis2011). This is because partners with unequal salaries may view this inequality as the product of differing career choices, rather than the outcome of an agreed-upon division of labour, leading to weaker feelings of obligation. Thus, we expect single-earner couples to be more likely to balance retirement savings compared to dual earners.
Gender
Although most primary earners are men, it is nowadays not uncommon for women to occupy this position. Despite this change to traditional gender roles, cultural norms continue to associate the breadwinner status to men and the caregiver to women (Lewis, Reference Lewis1993; Price, Reference Price2006; Yodanis and Lauer, Reference Yodanis and Lauer2007). Because of those gendered expectations, men and women typically behave differently as primary earners (Yodanis and Lauer, Reference Yodanis and Lauer2007). Men build on their financial resources to reduce their share of household work, while women continue to shoulder this unpaid labour in an attempt to ‘do gender’, despite their breadwinner status (Brines, Reference Brines1994; Bianchi et al., Reference Bianchi, Milkie, Sayer and Robinson2000). Women’s positions as breadwinners are also often conceived of as temporary, lasting only while the male partner builds his own career (Stocks and Halleröd, Reference Stocks and Halleröd2007).
Given those insights, one wonders whether women primary earners might feel less expected or pressured than men to provide for their spouse. Also, women breadwinners likely face greater material difficulty than men in providing for a spouse, because their earnings (Price, Reference Price2006) and assets (Deere and Doss, Reference Deere and Doss2006) are typically lower. Thus far, however, few empirical studies have examined whether the gender of the primary earner influences conjugal redistribution of financial resources. Our analyses will explore how this factor relates to the redistribution of retirement savings.
Union duration and children
Spouses who have been together for a long time are more likely to share resources, as they are more committed and adhere more strongly to values of family solidarity (Raijas, Reference Raijas2011; Addo, Reference Addo2017). Thus, union duration should be associated with the balancing of retirement savings. Like union duration, having common children fosters resource-sharing (Treas, Reference Treas1993; Vogler et al., Reference Vogler, Brockmann and Wiggins2008). However, Ravazzini and Kuhn (Reference Ravazzini, Kuhn, Tillmann, Voorpostel and Farago2018) have found that the presence of children reduces the ability to save, due to the excess expenses associated with childrearing. Hence, couples with children may find it difficult to cover the retirement savings of both spouses and having children may not be associated with the balancing of retirement savings. In line with this view, previous studies have found that having children has little influence on within-couple wealth inequalities (Grabka et al., Reference Grabka, Marcus and Sierminska2015).
Multiple couples also have stepchildren, and research has found that they are less likely to share ownership of their home, compared to families without stepchildren (Lersch and Vidal, Reference Lersch and Vidal2016). This may be because parents seek to preserve their assets for their own children alone (Burgoyne and Morison, Reference Burgoyne and Morison1997). Thus, we expect couples with stepchildren to be less likely to adopt a redistributive management of retirement savings, compared to spouses without children from previous unions.
Marriage and cohabitation
Scholars have long argued that married couples are more likely to pool their resources than cohabitants (Heimdal and Houseknecht, Reference Heimdal and Houseknecht2003; Vogler et al., Reference Vogler, Brockmann and Wiggins2006; Lyngstad et al., Reference Lyngstad, Noack and Tufte2011; Hamplová et al., Reference Hamplová, Le Bourdais and Lapierre-Adamcyk2014), and studies have shown that wealth gaps are also less pronounced among married couples (Grabka et al., Reference Grabka, Marcus and Sierminska2015). To explain those phenomena, some have stressed that cohabitation is a transitional stage in which spouses are still deciding whether or not they want to commit (Nock, Reference Nock1995; Brines and Joyner, Reference Brines and Joyner1999; Stanley et al., Reference Stanley, Rhoades and Markman2006).
Another view posits that married and cohabiting couples adhere to different values, because legal systems tend to impose greater mutual obligations to married couples than to spouses living in common law (Perelli-Harris and Sánchez Gassen, Reference Perelli-Harris and Sánchez Gassen2012). In Québec (Canada), for example, common law spouses have no right to their partners’ resources following separation or death (unless they have a will or contract). Married spouses, however, must split several resources, including retirement assets, upon divorce (Leckey, Reference Leckey2009) and those resources are also passed on to the surviving partner after death (Roy, Reference Roy, Belleau and Martial2011; Lavallée et al., Reference Lavallée, Belleau and Guilhermont2017) Footnote 1 . Because of those types of legal differences, it has been argued that common law offers a more flexible alternative to marriage and that it is adopted primarily by couples privileging individualistic values, while the more solidarity-oriented ones marry (Giddens, Reference Giddens1992; Clarkberg et al., Reference Clarkberg, Stolzenberg and Waite1995).
While those insights could suggest that married spouses are more redistributive regarding retirement savings than cohabitants, it must be noted that Québec, the context of this study, counts among several regions of the world in which cohabitation has become widespread and a socially accepted alternative to marriage, rather than a mere transitional stage Footnote 2 . Additionally, scholarship has debated the idea that cohabitation is necessarily synonymous with individualism, stressing that common law spouses are diverse in the meaning they attribute to conjugality, especially in societies where cohabitation is prevalent (Hiekel et al., Reference Hiekel, Liefbroer and Poortman2014; Vogler et al., Reference Vogler, Brockmann and Wiggins2008). For example, studies have shown that, in several regions, including Québec, many cohabiting couples are entirely unaware that their mutual legal obligations differ from those that apply to the married (Belleau, Reference Belleau2012, Reference Belleau2015; Sutherland, Reference Sutherland2013). This confusion stems largely from the fact that, when cohabitation becomes common, governments often begin to treat common law and marriage as equivalents for fiscal purposes, leading many to assume that marriage and cohabitation are the same under family law, as well (Belleau, Reference Belleau2012). Couples unaware of the legal differences between marriage and cohabitation usually did not select common law to avoid obligations, but rather, due to marriage’s religious connotation or costs. Therefore they exhibit similar attitudes as the married toward commitment and solidarity, instead of being more individualistic (Belleau, Reference Belleau2012).
Those additional insights on marriage and the diversity of cohabitating unions lead us to expect that differences in the management of retirement savings across union type may be weak in Québec and that these differences may depend on awareness to the distinct legal statuses between marriage and common law. More specifically, we posit that cohabiting couples that know about this legal difference may have chosen common law for the lack of obligations it implies and adhere to more individualistic values. Those couples may thus be less likely than the married to adopt a redistributive management of savings. However, cohabiting spouses who do not know about the legal differences should be more similar to the married in their position on solidarity and independence and therefore in their management of retirement savings.
Methodology
Data
Our data are from a survey fielded in Québec in 2015 as part of a project titled: Unions et désunions conjugales au Québec: regards croisés sur les pratiques et les représentations sociales et juridiques de la vie à deux Footnote 3 . This project sought to understand money management practices among working-age couples and to compare those living in common law unions to the married. The target population included individuals aged between twenty-five and fifty who were in a co-residential couple domiciled in Québec. The questionnaire was fielded by Bureau des Interviewers Professionnels (BIP), a survey firm, by phone (N=1,199) and internet (N=2,047).
The online sample was drawn from BIP’s web panel, which comprises 25,000 registered individuals who were randomly sampled from the general population of Québec by phone, through the ASDE sampler software (which randomly selects phone numbers from targeted areas). 13,882 members of this panel were in the desired age range and invited to fill out the survey. The response rate was 21.1 per cent, but only 2,041 respondents were currently co-residing with a partner and allowed to complete the questionnaire. The phone sample was drawn randomly from the population of Québec using the ASDE sampler. The response rate was 63.5 per cent. Mixing phone and web panels is increasingly common because, although web questionnaires have higher non-response rates, they reach younger populations, and yield similar results as phone surveys (Shin et al., Reference Shin, Johnson and Rao2012; Dillman et al., Reference Dillman, Smyth and Christian2014). Data was collected from only one spouse: the one who answered for the phone sample and, for the web sample, the one who received the email invitation.
In both panels, common law unions were oversampled to facilitate analyses on that subpopulation. Probability weights were created by BIP to adjust for this over-representation. It was also found that the final sample over-represented college-educated individuals compared to the 2011 census, and BIP adjusted the weights to better align with this source. All results presented below were weighted. More information on sampling is available in Belleau et al. (Reference Belleau, Lavallée and Seery2017). Also, in Appendix A, we compare data from this study with data from several national surveys conducted by Statistics Canada, including the 2011 Census.
Because we are interested in financially heterogamous couples, we restricted the original sample to those couples alone. We classified couples as heterogamous if one partner earns more than 60 per cent of the couple’s total income. Some respondents did not report their spouse’s income or their own. A follow-up question asked about whether they earn about the same, slightly more (or less), or much more (or less) than their partner. We coded all respondents who did not answer ‘about the same’ as financially heterogamous. Results are not sensitive to classifying respondents who earn only slightly more (or less) than their partner in the homogamous category. By those measures, 60 per cent of couples are heterogamous, for a final working sample of 1,933 cases.
Measurements
Outcome variable
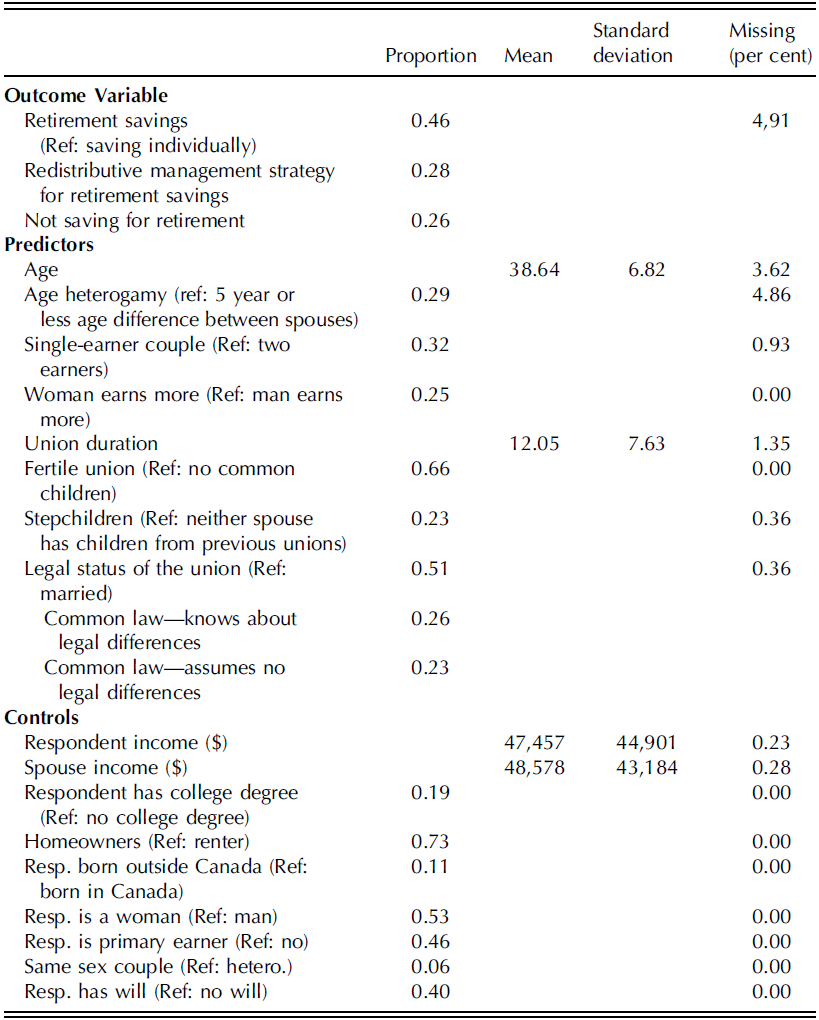
The outcome variable comprises three categories: 1) couples that do not save for retirement; 2) those that keep retirement savings a primarily individual responsibility; and 3) those that adopt a redistributive management strategy. As we already noted, a variety of strategies may allow financially heterogamous couples to achieve more equality in the savings of the partners, including co-owning investment accounts, having the primary earner save on behalf of the other, and more. Thus, our survey question did not focus on any one specific strategy. Instead, we invited couples to describe their practice by having them select which of the following three statements most closely matched their situation: 1) We do not save for retirement; 2) We save for retirement individually; 3) We try to balance the retirement savings of both partners. Respondents who selected option three were coded as deploying a redistributive management strategy. Table 1 below presents descriptive statistics for this variable (and all others).
Weighted descriptive statistics for non-imputed sample (N: 1,933)

Independent variables
To measure age and age heterogamy, one variable indicates the age of the responding partner (centred on the mean age of thirty-height) and the other is a dummy variable coded as one for partners with an age difference above five years (which is the seventieth percentile of age differences). One variable distinguishes couples with a single earner (32 per cent) from those with both partners in the labour force. A second variable indicates whether a woman (25 per cent) or a man is the higher earner. Our sample includes respondents in a same sex couple so that when a man is primary earner, the lower earner is not necessarily a woman or vice-versa. Our analyses adjust for whether or not the couple is same sex (see below), and results are not sensitive to excluding those couples. Union duration indicates, for both married and common law couples, the number of years since the beginning of their co-residence (centred on the mean of twelve years). Another variable indicates fertile unions (i.e. having at least one common child, 66 per cent). One variable indicates whether stepchildren are present (i.e. at least one of the spouses has children from a previous union, 23 per cent).
One last predictor variable distinguishes between three categories of married and common law couples: 1) married couples (51 per cent); 2) common law spouses who know about their differing legal status compared to the married (26 per cent); and 3) common law spouses who do not know (23 per cent). The distinction between the two types of common law couples is based on how they classified the following statement: ‘After a few years of cohabitation, common law couples have the same legal status as married couples.’ Those who identified the statement as false know they are different from the married; those who answered ‘true’ do not.
Control variables
Our analyses adjust for several socio-demographic characteristics of both responding spouse and partner. Those include respondent’s and spouse’s annual incomes. Both variables are divided by 10,000 and mean-centred (the means are $47,457 for respondents and $48,578 for spouses). We adjust for whether the couple lives in a rented or owned dwelling (73 per cent) and for the respondent’s educational attainment (whether he/she has a college degree; 19 per cent have one). A variable also indicates whether the respondent was born outside Canada (11 per cent). We control for the gender of the respondent (53 per cent selected woman) and for whether he/she is the higher earner (46 per cent) in the couple, since Haussen (Reference Haussen2019) has found this status may influence preferences regarding redistributive policies. Lastly, we adjust for whether the respondent has a will (40 per cent).
Modelling
Our model is a multinomial logistic regression predicting the three-category outcome variable with all predictors and control variables. Redistributive management of retirement savings is the baseline, so the model explores both the risk of saving individually and of not saving at all against that of balancing retirement savings. This article is concerned primarily with the factors associated with the adoption of a redistributive management strategy versus an individual one for couples that are saving. Our presentation of results reflects this focus, but we also describe the factors affecting the relative risk of not saving at all.
Missing values
Some of our variables contain a non-negligible proportion of missing values: in particular, respondent’s and spouse’s incomes are unobserved in 23 and 28 per cent of cases, respectively. A few other variables also exhibit a smaller proportion of missing values (as described in Table 1 above). To address this issue, we employed multiple imputation, which ‘creates multiple copies of the dataset, each of which contains different estimates of the missing values’ (Enders, Reference Enders2010: 187). Estimates were obtained using a Bayesian approach and auxiliary variables – those with complete information that may have been correlated with selection into missing or incomplete variables in the analytical model. Our imputation strategy created twenty copies of the dataset and used chained equations to impute missing values (through the mi impute chained command in Stata). Our results hold when not imputing and using listwise deletion of missing cases. They also hold when not including the income variables as control, which have the highest proportions of missing values (results from those robustness checks available upon request).
Results
Table 1 presented above shows that 26 per cent of respondents in our sample do not save for retirement, 46 per cent say they and their partner save individually, and 28 per cent declare that they and their partner strive to balance retirement savings across spouses. Those figures mean that, among respondents who are financially preparing for retirement, 38 per cent employ a redistributive strategy, while 62 per cent use an individualised one. The relative risk of an independent versus a redistributive strategy is thus 1.64, meaning that the probability of an independent strategy is 64 per cent greater than the probability of a redistributive one in our sample.
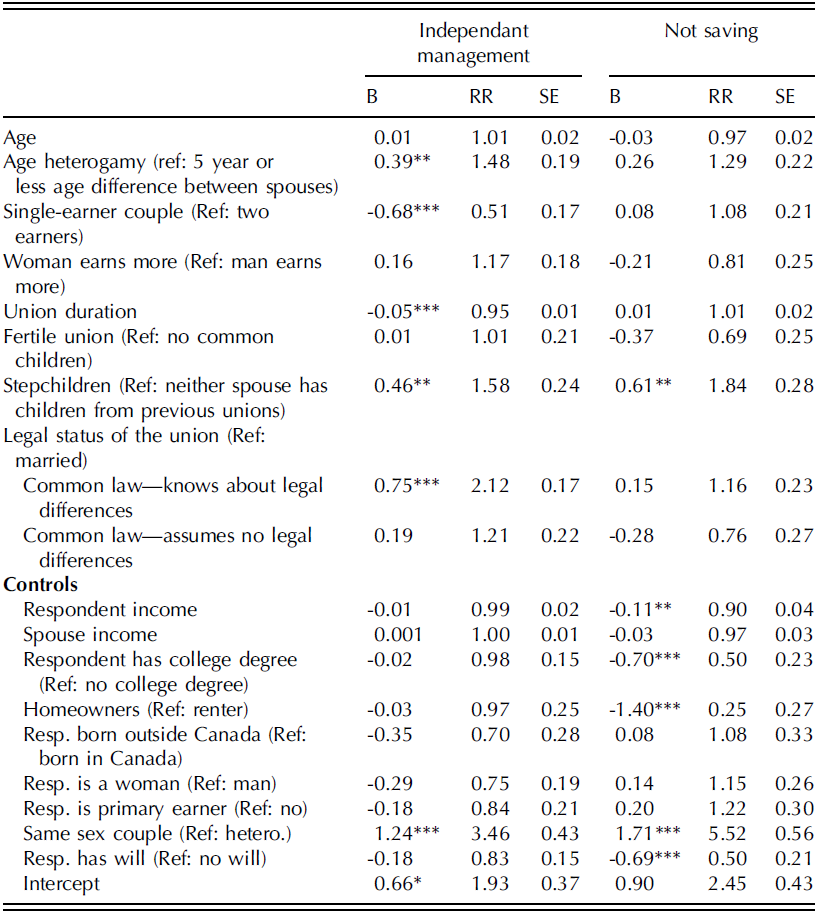
The first part of the multinomial model explores how the relative risk of an independent versus a redistributive strategy varies with the predictor variables. Results are presented in Table 2 below. Our first set of hypotheses regards age and age heterogamy. Our results fail to find evidence that the responding partner’s age is associated with saving individually versus balancing retirement savings. However, age heterogamy has a significant effect in the model. As expected, partners with an age difference exhibit a higher relative risk of saving individually versus balancing retirement savings, compared to those of the same age: the relative risk of saving individually is 48 per cent higher for age heterogamous couples compared to couples in the same age range.
Multinomial logistic regression (Baseline: Redistributive retirement savings, N: 1,933)
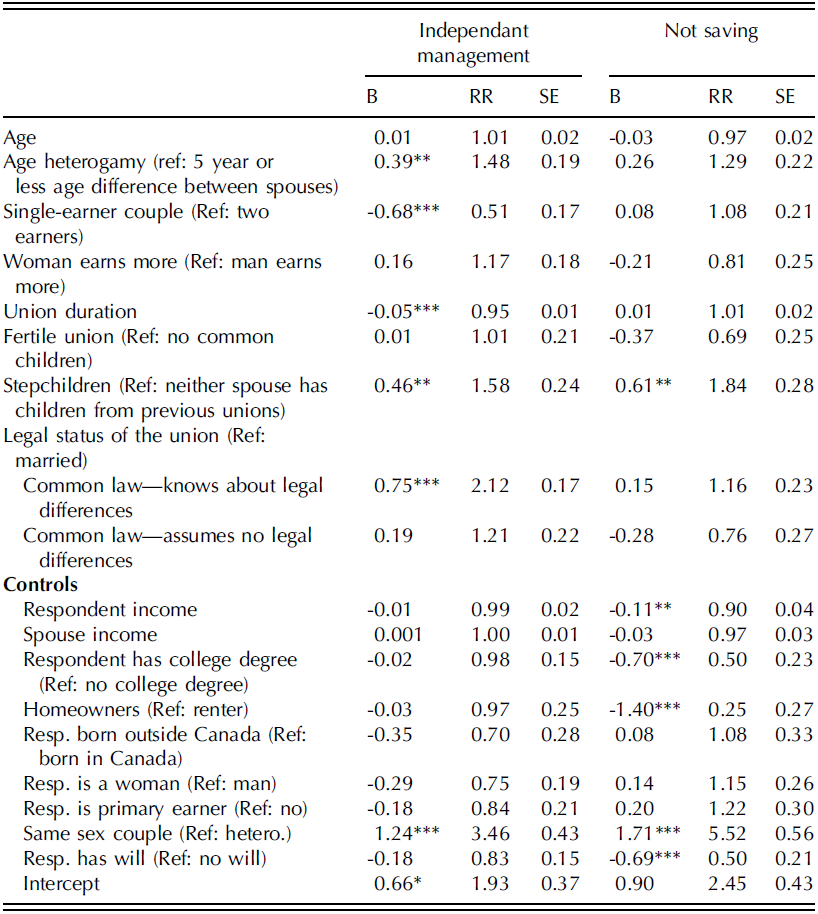
Notes: Multiple imputation estimation; weighted results; *p<0.10, **p<0.05, ***p<0.01, two-tailed tests.
Regarding the issue of specialisation, our findings indicate that couples with one partner not in the labour force have a significantly lower relative risk of using an independent strategy compared to dual-earner couples, as was hypothesised. Specifically, the relative risk of saving individually for single-earner couples is only about half that found among dual-earner couples. Our analyses also explore whether the gender of the primary earner is related to how retirement savings are managed. Our results fail to provide evidence of an association.
Another hypothesis posits that union duration might increase the propensity to adopt a redistributive management of retirement savings. In line with this idea, we find that each additional year of co-residing significantly decreases (by an estimated 5 per cent) the relative risk of an independent versus a redistributive saving strategy. Regarding having common children, our results do not detect a significant association with how couples manage their retirement savings. However, the presence of stepchildren seems to discourage a redistributive management of retirement savings, as was expected. Indeed, the relative risk of an individualised strategy versus a redistributive one is 58 per cent higher among couples with stepchildren compared to those without.
Our last hypothesis suggests that differences between married and cohabiting couples are contingent on knowledge of the distinct legal statuses of marriage versus common law unions. Our results align with that idea: the relative risk of saving individually is significantly higher – more than twice as high – among cohabiting spouses who are aware of the legal differences, compared to the married group. However, common law couples not aware of the legal distinctions do not differ significantly from the married in their relative risk of saving individually.
Our analyses control for several additional characteristics of the respondent and spouse. The majority of these, however, are not significantly associated with the relative risk of an independent versus a redistributive management of savings. The one exception is being in a same sex union. Those couples exhibit a significantly higher relative risk of saving individually compared to heterosexual partners. Additionally, the second part of our multinomial model explores how the various predictors are associated with the relative risk of not saving at all for retirement versus adopting a redistributive strategy. Results indicate that the relative risk of not saving is strongly related to markers of socio-economic status. More specifically, a higher respondent income, being a homeowner, and having a college degree are all associated with a lower relative risk of not saving, suggesting that couples with available financial resources are more likely to save than poorer families. Having stepchildren and being in a same sex union also increase the relative risk of not saving. Having a will is associated with a lower relative risk of not saving.
Discussion
Recent research has shown that financially heterogamous spouses do not all share or equalise their retirement savings (Grabka et al., Reference Grabka, Marcus and Sierminska2015). But do some of them do so? In this article we estimated that, in the Canadian province of Québec, 28 per cent of adults between twenty-five and fifty in a financially heterogamous union (and 38 per cent of those of them saving for retirement) report that their couple seeks to balance the retirement savings of the partners.
Before further discussing those results and their implications, we stress that our analyses have some limitations. First, we employ cross-sectional rather than longitudinal data and therefore our results do not have a causal interpretation. Second, our analyses do not detect a significant association between age and the management of retirement savings. While this may be due to a statistical power issue, as our sample was not especially large (N: 1,933), the lack of an age effect may also lie in the fact that our data cover only adults aged between twenty-five and fifty, while retirement savings likely extend beyond this age range. Future research should thus explore whether the conjugal management of retirement savings changes after fifty.
Another limitation stems from a lack of information about the partner’s assets, pension values, and saving rates. This issue raises the question of the extent to which larger endowments or more intensive savings strategies may affect how retirement savings are managed, calling for future studies to address this gap. Additionally, couples dissatisfied with their relationship and at possible risk of separating could be less redistributive in their management of retirement savings. We could not adjust for this factor, however, because the data did not include markers of conjugal satisfaction, and the cross-sectional study prevented us from comparing couples that separated to those who remained together over time. Similarly, indicators of previous separation experiences were not available (only information on stepchildren). Future studies will thus benefit from data that offer opportunities to explore and control for those elements.
Finally, we opted to ask respondents to select between individually saving versus trying to balance savings as the management strategy best fitting their situation. This raises an issue of interpretation; couples employing the same strategy (for example, saving in their own accounts but both drawing from the same common pot) may have provided different answers to our question. Yet, we believe our strategy also has a key upside: an obvious alternative approach that has been employed in other studies consists of asking couples whether or not they own joint saving accounts (Kan and Laurie, Reference Kan and Laurie2014). In Canada, however, tax-deferred retirement accounts, which are major retirement savings vehicles, cannot be owned jointly. Hence, this strategy is too limited in the Canadian context, and we believe our measurement allowed us to grasp a broad range of redistributive strategies.
Despite certain limits, then, our study offers several important contributions. First, while a large field explores intra-household economies, few recent studies have focused on financially heterogamous couples and examined their redistributive practices. Instead, studies have explored the broader topic of integrated versus independent finances (Nyman, Reference Nyman1999; Eickmeyer et al., Reference Eickmeyer, Manning and Brown2019; Pepin, Reference Pepin2019). We extended research on conjugal redistribution by considering how financially heterogamous couples handle their retirement savings. Our findings indicate that several factors are associated with redistributive behaviours in this sphere. In particular, single-earner couples are more likely than dual-earner ones to balance savings across partners, in line with specialisation and exchange theories of conjugal economic organisation. Union duration also increases the propensity to be redistributive with retirement savings, supporting the idea that couples adhere more strongly to values of family unity and share more as their commitment grows.
Also, while studies have long found that having common children is associated with resource pooling (Treas, Reference Treas1993), we did not detect a significant association of this factor with a redistributive management of retirement savings. The potential statistical power issues related to our sample size must be considered, but that said, other studies also failed to find a significant association between having children and wealth equality between spouses (Grabka et al., Reference Grabka, Marcus and Sierminska2015). As we noted above, a likely explanation for this pattern is that having children challenges a couple’s saving capacity so that those with children may have difficulty covering both spouses. Another important finding is that having stepchildren is negatively associated with a redistributive management of retirement savings, in line with the notion that parents may seek to preserve their resources for their own children.
Furthermore, previous work on the breadwinner role has emphasised that men remain culturally associated with this role, so that being the primary earner carries different expectations and produces different outcomes for men and women (Yodanis and Lauer, Reference Yodanis and Lauer2007). One may thus wonder whether women could be under less pressure than men to provide for their spouse when occupying the breadwinner position. Our study, however, failed to find a significant effect of gender on redistributive management of retirement savings. Here again, our sample size may play a role in the lack of statistical significance. Additionally, our study concerned the redistribution of retirement savings alone. Thus, it will be important for future work to explore how gender relates to conjugal redistribution in other areas and using larger samples.
Our analyses also add insights to existing literature on the distinctions between marriage and common law unions. Scholars have long argued that cohabiting couples are more individualistic than married couples and choose common law precisely because legal obligations are weaker than in marriage (Clarkberg et al., Reference Clarkberg, Stolzenberg and Waite1995; Brines and Joyner, Reference Brines and Joyner1999). A number of scholars, however, have called for more nuance, stressing that cohabiting couples form a heterogeneous group and that many are deeply committed to values of family solidarity, especially as cohabitation increasingly represents an alternative to marriage for long-term relationships and family formation (Vogler et al., Reference Vogler, Brockmann and Wiggins2008; Hiekel et al., Reference Hiekel, Liefbroer and Poortman2014). Our findings reinforce this view of cohabitation, using novel empirical evidence. Specifically, we find that, in Québec, an important proportion of cohabiters (47 per cent of them in our sample) do not even know that their legal mutual obligations differ from those for the married. Importantly, those cohabiting couples are just as likely as the married to be redistributive with respect to retirement savings, challenging the view that cohabitants are all individualistic couples who chose common law for the lack of obligation it entails. Those findings emphasise the need for future research to better grasp heterogeneity among cohabitants when studying differences between marriage and common law.
Finally, our results also extend retirement research and can help inform policy decision-making in this domain. Indeed, it remains common for policymakers and retirement scholars to assume that retirement savings constitute a household-level good. This is the case in the Canadian context, as reflected by the fact that wealth and savings data are collected primarily at the household level in the main national survey on the topic (Statistics Canada’s Survey of Financial Security). While recent research has begun to show that couples do not all share or balance their retirement savings, the present study clarifies the prevalence of a redistributive management of savings among couples with an income differential. We find that this behaviour is by no means adopted by the majority of couples surveyed (38 per cent of those who save). Thus, our results stress that, through the shared savings assumption, researchers and policymakers risk largely overstating the savings available to lower-income individuals partnered with better-off spouses (who are mostly women). They also risk understating the number of them who may need assistance from the state in old age. This insight calls for scholars and policymakers to abandon the shared savings assumption, especially for financially heterogamous couples. Importantly, in Canada, our results also call for detailed individual-level wealth data collection to better understand the retirement preparation of this country’s partnered population, as well as the gender gaps in this area.
Acknowledgments
The authors would like to acknowledge that funding from the Social Science Research Council of Canada was received in support of this project. The authors would also like to thank Lara Janson for copyediting this article.
Appendix A. Comparing with other sources of data
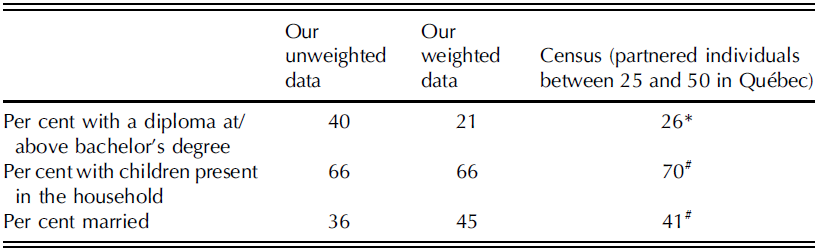
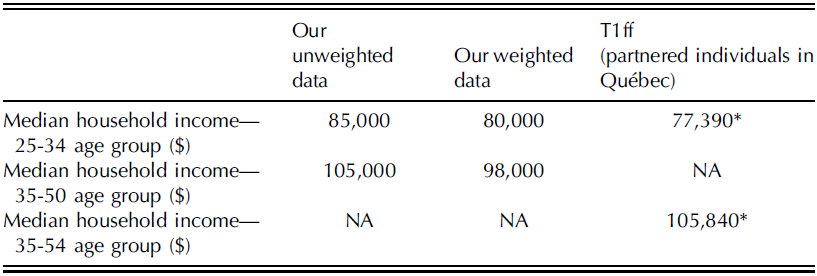
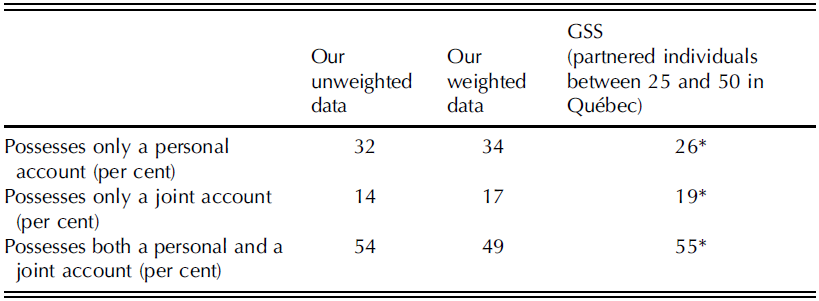
We compared data from our survey with data from the Québec samples of partnered individuals between 25 and 50 of three Canadian national surveys conducted by Statistics Canada. More specifically, in Table A1, we compare education levels, the proportion of couples with and without children, and the proportion of married couples in our own survey data and in the corresponding sample of the 2011 Census. In Table A2, we compare the median household income in our sample to the median household income obtained from the T1ff tax returns file of 2015. In Table A3, we compare the proportion of couples with personal and joint bank accounts in our sample and in the General Social Survey of 2011, which is the primary nationally representative survey on the topic of the family in Canada. In all three tables, we provide weighted and unweighted descriptive statistics for our data. It should also be noted that the descriptive statistics we provide are for the entire survey sample (N: 3,246) and not for the subsample of financially heterogamous couples used in this study. This is because it is easier to compare the full sample to other sources than the reduced sample employed here.


Comparison of our data with the 2011 GSS data

Source: *Belleau et al., Reference Belleau, Lavallée and Seery2017