





Introduction
Early adolescence (ages 10 to 14 years) marks substantial anatomical and physiological maturation, neural reorganization including a decrease in the cortical gray matter/white matter ratio (Giedd et al., Reference Giedd, Blumenthal, Jeffries, Castellanos, Liu, Zijdenbos, Paus, Evans and Rapoport1999), changes in functional network connectivity (Keller et al., Reference Keller, Sydnor, Pines, Fair, Bassett and Satterthwaite2023), propensity toward risk-taking (Steinberg, Reference Steinberg2010), and social and emotional development (Steinberg, Reference Steinberg2005).
Unpredictable, uncontrollable situations, such as the COVID-19 pandemic, challenge coping abilities (Russell & Lightman, Reference Russell and Lightman2019) and increase stress (Ifdil et al., Reference Ifdil, Putri and Amalianita2021). During adolescence, the impact of stress may be more enduring and qualitatively different than for adults, partially due to ongoing development (McCormick et al., Reference McCormick, Mathews, Thomas and Waters2010). The pandemic required rapid adaptation with limited opportunities for in-person interaction, major changes to schooling (distanced learning), limitations on sport and other extracurricular activities, and less access to social support systems (Loades et al., Reference Loades, Chatburn, Higson-Sweeney, Reynolds, Shafran, Brigden, Linney, McManus, Borwick and Crawley2020) at a time of increased anxieties over personal and family health threats and economic hardships. These factors contributed to considerable increases in mental health problems among adolescents during the pandemic (Alzueta et al., Reference Alzueta, Perrin, Baker, Caffarra, Ramos-Usuga, Yuksel and Arango-Lasprilla2021; Kiss et al., Reference Kiss, Alzueta, Yuksel, Pohl, de Zambotti, Műller-Oehring, Prouty, Durley, Pelham and Baker2022; Magson et al., Reference Magson, Freeman, Rapee, Richardson, Oar and Fardouly2021; Zhou et al., Reference Zhou, Zhang, Wang, Guo, Wang, Chen, Liu, Chen and Chen2020). The pandemic and its associated stressors may have also affected brain development during sensitive periods such as adolescence (Gotlib et al., Reference Gotlib, Miller, Borchers, Coury, Costello, Garcia and Ho2023), potentially influencing the maturation of reward system sensitivity – a process known to undergo marked changes during this stage.
Reward sensitivity has been linked to many behavioral changes seen during adolescence, such as increased risk-taking (O’Brien et al., Reference O’Brien, Albert, Chein and Steinberg2011) and a focus on social connections (Foulkes & Blakemore, Reference Foulkes and Blakemore2016). Reward sensitivity appears to peak in adolescence (Galván, Reference Galván2010), and those at risk for affective disorders tend to show reduced neural (Nelson et al., Reference Nelson, Perlman, Klein, Kotov and Hajcak2016) and behavioral responses (Spear, Reference Spear2011) to rewards. Notably, blunted reward sensitivity can already be observed in early adolescence (Colder et al., Reference Colder, Hawk, Lengua, Wiezcorek, Eiden and Read2013; Hayden & Platt, Reference Hayden and Platt2010) and predicts likelihood of future depressive episodes or symptoms (Forbes et al., Reference Forbes, Christopher May, Siegle, Ladouceur, Ryan, Carter, Birmaher, Axelson and Dahl2006). However, alterations in reward responsivity are not limited to depressive disorders (Auerbach et al., Reference Auerbach, Admon and Pizzagalli2014; Auerbach et al., Reference Auerbach, Pagliaccio, Hubbard, Frosch, Kremens, Cosby, Jones, Siless, Lo, Henin, Hofmann, Gabrieli, Yendiki, Whitfield-Gabrieli and Pizzagalli2022). Reward responsivity has also been linked to other psychiatric disorders, including schizophrenia (Kester et al., Reference Kester, Sevy, Yechiam, Burdick, Cervellione and Kumra2006), anxiety disorders (Becker et al., Reference Becker, Simon, Miltner and Straube2017), substance use (Colder et al., Reference Colder, Hawk, Lengua, Wiezcorek, Eiden and Read2013), addiction (Luijten et al., Reference Luijten, Schellekens, Kühn, Machielse and Sescousse2017), eating disorders (Bodell et al., Reference Bodell, Wildes, Goldschmidt, Lepage, Keenan, Guyer, Hipwell, Stepp and Forbes2018), and symptoms of inattention and hyperactivity–impulsivity (Toplak et al., Reference Toplak, Jain and Tannock2005) in adolescence.
Despite the substantial progress in understanding adolescent reward sensitivity, attempts to characterize its development are limited by the variety of tasks used across studies. Some studies compare adolescents to adults (Bjork et al., Reference Bjork, Knutson, Fong, Caggiano, Bennett and Hommer2004; Bjork et al., Reference Bjork, Smith, Danube and Hommer2007) or children (May et al., Reference May, Delgado, Dahl, Stenger, Ryan, Fiez and Carter2004) but are not sensitive to nuanced longitudinal changes during adolescence, and most use small sample sizes (Hoogendam et al., Reference Hoogendam, Kahn, Hillegers, van Buuren and Vink2013; Jarcho et al., Reference Jarcho, Benson, Plate, Guyer, Detloff, Pine, Leibenluft and Ernst2012; van Duijvenvoorde et al., Reference van Duijvenvoorde, de Macks, Overgaauw, Moor, Dahl and Crone2014), limiting the generalizability. Some research suggests that adolescents process rewards differently from both children and adults. Compared to adults, they seek more intense or frequent rewards to achieve comparable levels of brain activation (Spear, Reference Spear2000) and adapt more slowly to varying reward contingencies (Javadi et al., Reference Javadi, Schmidt and Smolka2014). This finding aligns with others that adolescents experience less pleasure from rewarding stimuli (Gardner, Reference Gardner1999), evidenced by decreased positive affect, increased negative affect (Larson & Richards, Reference Larson, Gillman and Richards1997; Reitsema et al., Reference Reitsema, Jeronimus, van Dijk and de Jonge2022), and increased sensitivity to negative stimuli (Yuan et al., Reference Yuan, Ju, Meng, Chen, Zhu, Yang and Li2015). Compared to children, adolescents report less pleasure from sweetness (Naneix et al., Reference Naneix, Darlot, Coutureau, Cador and Dalley2016), suggesting that adolescents may engage in heightened reward-seeking behaviors to compensate for reduced sensitivity (Spear, Reference Spear2000).
Overall, the literature indicates that while adolescents and adults engage similar reward-related brain circuitry (Bjork et al., Reference Bjork, Knutson, Fong, Caggiano, Bennett and Hommer2004; Javadi et al., Reference Javadi, Schmidt and Smolka2014; May et al., Reference May, Delgado, Dahl, Stenger, Ryan, Fiez and Carter2004), adolescents show specific immaturities, such as greater ventral striatal but not dorsal striatal activation and medial and lateral orbitofrontal cortex activation during reward-based guessing (May et al., Reference May, Delgado, Dahl, Stenger, Ryan, Fiez and Carter2004). Neuroimaging studies using monetary incentive delay (MID) paradigms (Knutson et al., Reference Knutson, Westdorp, Kaiser and Hommer2000) show more activation of the nucleus accumbens during reward anticipation in adolescents relative to adults (Bjork et al., Reference Bjork, Knutson, Fong, Caggiano, Bennett and Hommer2004; Galvan et al., Reference Galvan, Hare, Parra, Penn, Voss, Glover and Casey2006). This heightened activation, observed during ongoing prefrontal cortex maturation (Galvan et al., Reference Galvan, Hare, Parra, Penn, Voss, Glover and Casey2006), aligns with observations of heightened impulsivity and diminished capacity to regulate reward-driven behaviors (Galvan et al., Reference Galvan, Hare, Parra, Penn, Voss, Glover and Casey2006). Adolescents are behaviorally and emotionally more reactive to monetary incentives than adults (Ernst et al., Reference Ernst, Nelson, Jazbec, McClure, Monk, Leibenluft, Blair and Pine2005) and are more sensitive to positive feedback during affective decision making than adults and children (Cauffman et al., Reference Cauffman, Shulman, Steinberg, Claus, Banich, Graham and Woolard2010). Bjork et al. (Reference Bjork, Smith, Danube and Hommer2007) noted that when the potential penalty in pursuit of an explicit reward is mild, adolescents do not show significant activation in the posterior mesofrontal cortex (PMC: supragenual anterior cingulate cortex, extending into Brodmann’s areas 8, 6, and 32), in contrast to adults (Bjork et al., Reference Bjork, Smith, Danube and Hommer2007). However, during feedback, adolescents do not show the precuneus activation for large versus small incentives that adults manifest (Jarcho et al., Reference Jarcho, Benson, Plate, Guyer, Detloff, Pine, Leibenluft and Ernst2012). During adolescence, individual differences in maturation of regions involved in reward (Foulkes & Blakemore, Reference Foulkes and Blakemore2018; Mills et al., Reference Mills, Goddings, Clasen, Giedd and Blakemore2014) can influence reward sensitivity and related behavior (Bjork & Pardini, Reference Bjork and Pardini2015). For example, delayed maturation of the caudate in children has been associated with deficiencies in delayed gratification (Castellanos et al., Reference Castellanos, Lee, Sharp, Jeffries, Greenstein, Clasen, Blumenthal, James, Ebens and Walter2002). This self-reported reward sensitivity level is quantified via the Behavioral Inhibition and Behavioral Activation (BIS/BAS) scales (Kim-Spoon et al., Reference Kim-Spoon, Deater-Deckard, Holmes, Lee, Chiu and King-Casas2016), with higher behavioral activation system (BAS) scores linked to greater reward-seeking tendencies, while imbalanced activation may predispose adolescents to specific risk profiles (Kim-Spoon et al., Reference Kim-Spoon, Deater-Deckard, Holmes, Lee, Chiu and King-Casas2016).
Within the context of large-scale, longitudinal studies investigating adolescent brain development, the Adolescent Brain Cognitive Development (ABCD) Study is a key resource for elucidating neural mechanisms of reward. As part of its comprehensive protocol, ABCD employs the MID fMRI task to assess reward anticipation and outcome processes (Casey et al., Reference Casey, Cannonier, Conley, Cohen, Barch, Heitzeg, Soules, Teslovich, Dellarco, Garavan, Orr, Wager, Banich, Speer, Sutherland, Riedel, Dick, Bjork, Thomas and Dale2018). Baseline ABCD analyses (ages 9–10) highlighted robust engagement of classical reward circuitry: the ventral striatum (particularly nucleus accumbens) and associated regions, such as the orbitofrontal cortex and anterior cingulate cortex, in response to reward anticipation (Casey et al., Reference Casey, Cannonier, Conley, Cohen, Barch, Heitzeg, Soules, Teslovich, Dellarco, Garavan, Orr, Wager, Banich, Speer, Sutherland, Riedel, Dick, Bjork, Thomas and Dale2018; Chaarani et al., Reference Chaarani, Hahn, Allgaier, Adise, Owens, Juliano, Yuan, Loso, Ivanciu, Albaugh, Dumas, Mackey, Laurent, Ivanova, Hagler, Cornejo, Hatton, Agrawal and Aguinaldo2021; Hawes et al., Reference Hawes, Waller, Byrd, Bjork, Dick, Sutherland, Riedel, Tobia, Thomson, Laird and Gonzalez2021; Martz et al., Reference Martz, Hardee, Cope, McCurry, Soules, Zucker and Heitzeg2022). This aligns with a broader literature emphasizing the nucleus accumbens as a critical site for dopaminergic signaling linked to impulsivity and reward-driven behavior during adolescence (Chaarani et al., Reference Chaarani, Hahn, Allgaier, Adise, Owens, Juliano, Yuan, Loso, Ivanciu, Albaugh, Dumas, Mackey, Laurent, Ivanova, Hagler, Cornejo, Hatton, Agrawal and Aguinaldo2021). Recent findings based on ABCD data suggested that individual differences in reward-related activation can help predict trajectories of substance use (May et al., Reference May, Jacobus, Simmons and Tapert2022), emotion regulation (Lichenstein et al., Reference Lichenstein, Roos, Kohler, Kiluk, Carroll, Worhunsky, Witkiewitz and Yip2022), and other developmental outcomes (Agarwal et al., Reference Agarwal, Manza, Tejeda, Courville, Volkow and Joseph2023).
In summary, as brain reward systems mature during adolescence, they respond differently to rewards compared to children and adults, are changing in reward sensitivity, e.g., to monetary incentives, and are linked to the temporal development of prefrontal control systems. This brain maturation period is reflected in typical behavioral patterns during adolescence denoting reward seeking and emotional imbalance, where individual differences have been attributed to differences in family, friend, and socioeconomic structures. For example, cross-sectional analyses of ABCD MID fMRI task data found (1) that blunted reward processing in the nucleus accumbens is associated with parental substance use history and family history of alcohol problems (Kwarteng et al., Reference Kwarteng, Rahman, Gee, Infante, Tapert and Curtis2021; Martz et al., Reference Martz, Hardee, Cope, McCurry, Soules, Zucker and Heitzeg2022), (2) that youth with disruptive behavior disorders show differences in reward-related brain activation (Hawes et al., Reference Hawes, Waller, Byrd, Bjork, Dick, Sutherland, Riedel, Tobia, Thomson, Laird and Gonzalez2021), and (3) that neighborhood socioeconomic disadvantage is linked to blunted striatal recruitment during reward anticipation (Mullins et al., Reference Mullins, Campbell and Hogeveen2020). Prior studies considering the neural reward sensitivity and the behavioral activation system primarily focused on cross-sectional analyses (McNeilly et al., Reference McNeilly, Saragosa-Harris, Mills, Dahl and Magis-Weinberg2022), leaving longitudinal changes less explored. Longitudinal studies reinforce that adolescent reward processing changes as cognitive control and reward-related networks become more efficient (Braams et al., Reference Braams, van Duijvenvoorde, Peper and Crone2015). Finally, the pandemic and its associated stressors may provide the means to assess disruption of these brain systems’ maturational processes to reward and related behaviors.
The current study aims to provide a longitudinal, multimodal examination of reward-response development from ages 9–10 to 11–12, integrating self-reported reward sensitivity measures with neural activation during reward anticipation, with or without introduction of the large-scale stressor of the COVID-19 pandemic context between assessments. By combining behavioral, neural, and network-level perspectives, this work seeks to capture multiple levels of developmental adaptation that are often examined separately in prior research. Specifically, the study first characterizes age-related changes in self-reported reward sensitivity (BAS), then links these behavioral changes to task-based neural activation patterns and finally explores potential reorganization at the brain network level to reveal broader system-level dynamics underlying adolescent reward processing. Sex effects on self-reported reward sensitivity and corresponding neural activation were also examined. To investigate developmental and pandemic-related changes at the system level, we incorporated a brain network analysis. This integrative approach was used to advance our understanding of reward processing during adolescence, emphasizing the dynamic interplay between biological, psychological, and environmental factors at this critical stage of development and in the context of a potential stressor (pandemic).
Methods
Participants
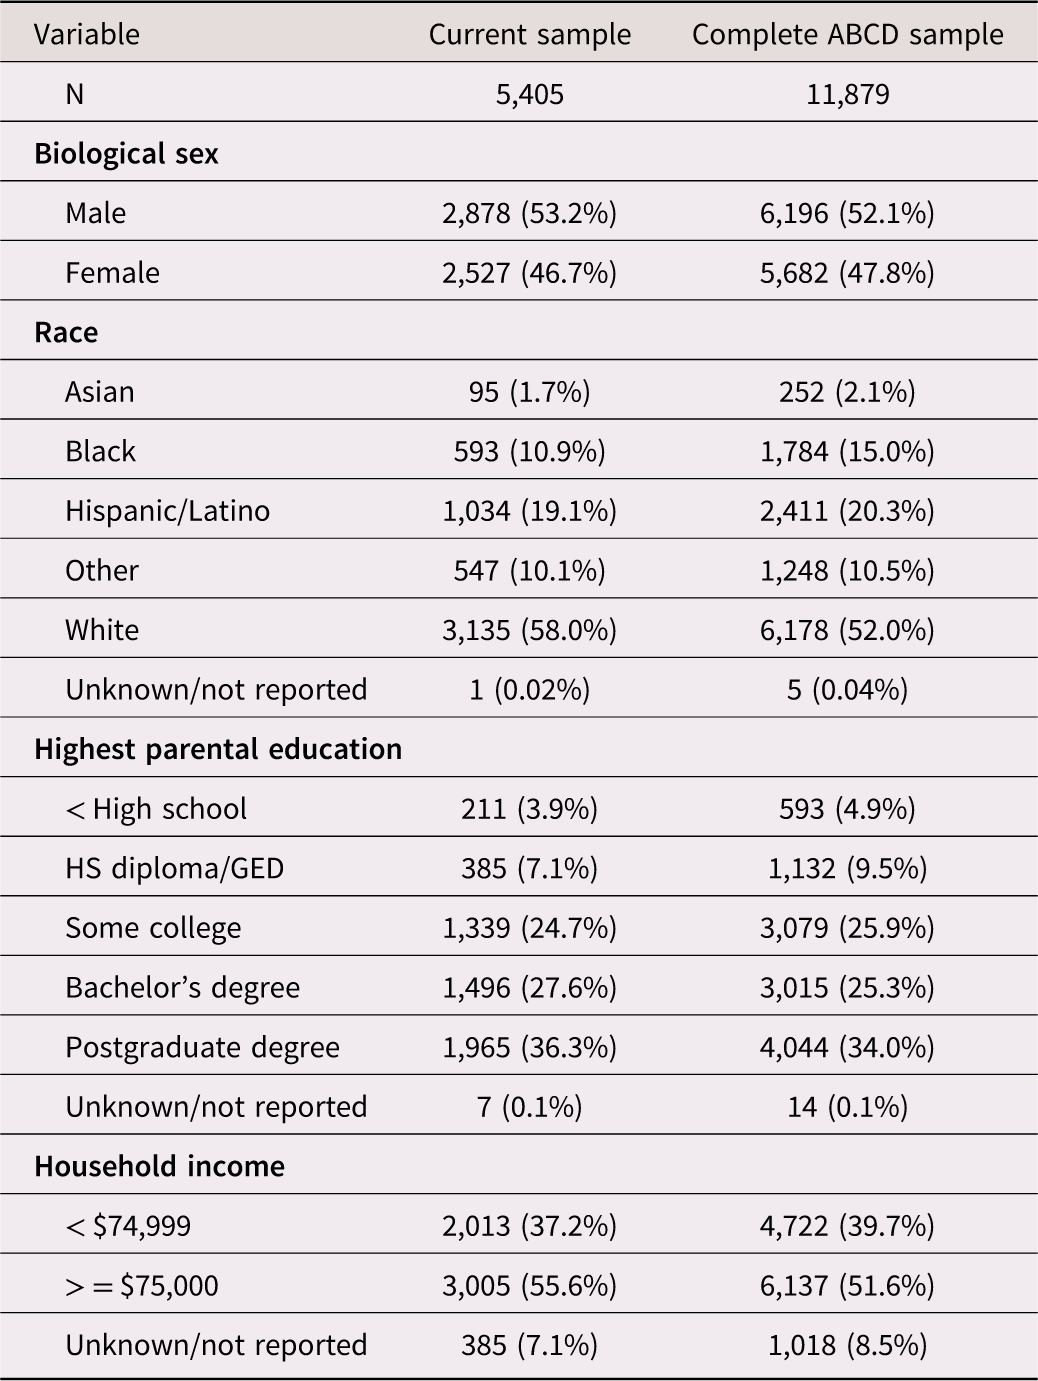
Data were obtained from the US-based, multi-site ABCD Study® (data version 5.1.0, https://doi.org/10.15154/z563-zd24), of 11,878 children recruited at age 9–10 years in 2016–2018 through 21 research sites spanning 17 states; https://abcdstudy.org/study-sites)(Garavan et al., Reference Garavan, Bartsch, Conway, Decastro, Goldstein, Heeringa, Jernigan, Potter, Thompson and Zahs2018) using primarily school-based recruitment to better approximate US demographics (Casey et al., Reference Casey, Cannonier, Conley, Cohen, Barch, Heitzeg, Soules, Teslovich, Dellarco, Garavan, Orr, Wager, Banich, Speer, Sutherland, Riedel, Dick, Bjork, Thomas and Dale2018; Garavan et al., Reference Garavan, Bartsch, Conway, Decastro, Goldstein, Heeringa, Jernigan, Potter, Thompson and Zahs2018; Hagler Jr et al., Reference Hagler, Hatton, Cornejo, Makowski, Fair, Dick, Sutherland, Casey, Barch, Harms, Watts, Bjork, Garavan, Hilmer, Pung, Sicat, Kuperman, Bartsch, Xue and Dale2019). Out of the full ABCD cohort (N = 11,879), imaging data were available for 10,138 participants at baseline, with 9,311 retained after exclusion for imaging artifacts such as motion or poor-quality fMRI data. At Year 2, fMRI data were available for 7,349 participants, with 6,586 retained after quality control. The subset with valid fMRI data and complete BAS assessments at both time points comprised 5,405 participants, which served as our analytical sample. Exclusions were primarily due to missing or low-quality imaging data. Written informed consent and assent were obtained from a parent/guardian and the youth, respectively. Procedures were approved by a centralized institutional review board at (University of California, San Diego, protocol number: #160091AW). All procedures complied with the Declaration of Helsinki. Compared to the ABCD cohort, the analytical sample here had more White youth (58% vs. 52%), less Black youth (10.9% vs. 15%), less youth from families with incomes below $75,000 (37% vs. 40%), and slightly higher average caregiver education levels (see Table 1).
Analytic sample characteristics at baseline (mean age: 9.91 years, range: 8.91–11.08 years)

Table 1. Long description
Current sample vs. Complete ABCD sample: sex 53.2% vs 52.1% male; race 58.0% vs 52.0% White, 10.9% vs 15.0% Black, 19.1% vs 20.3% Hispanic/Latino, 1.7% vs 2.1% Asian, 10.1% vs 10.5% Other – the analytic sample has proportionally fewer Black and more White participants. Parental education 36.3% vs 34.0% postgraduate degree, skewing slightly higher in the analytic sample. Household income ≥$75,000: 55.6% vs 51.6%, also slightly higher in the analytic sample.
Measures
Demographics and developmental factors: Sex-at-birth, age, race/ethnicity of the child, family annual income (below $75,000 vs. $75,000+ annual household income) and research site of the data collection were taken from the baseline year. For race categories we used a single categorical variable with the following groups: White, Black, Hispanic/Latino, Asian, Other, and Unknown/Not reported.
COVID-19: Participants were grouped based on Year 2 visit dates: (1) prior to the pandemic versus (2) during the pandemic, using February 1, 2020, as the onset of the pandemic in the U.S., based on WHO’s declaration of COVID-19 as a global health emergency (Figure S1).
Functional MRI measures: Every 2 years, ABCD participants undergo multi-modal MRI scans. fMRI tasks include reward anticipation and receipt (feedback) cues with a MID task (Casey et al., Reference Casey, Cannonier, Conley, Cohen, Barch, Heitzeg, Soules, Teslovich, Dellarco, Garavan, Orr, Wager, Banich, Speer, Sutherland, Riedel, Dick, Bjork, Thomas and Dale2018) to measure reward processing (Casey et al., Reference Casey, Cannonier, Conley, Cohen, Barch, Heitzeg, Soules, Teslovich, Dellarco, Garavan, Orr, Wager, Banich, Speer, Sutherland, Riedel, Dick, Bjork, Thomas and Dale2018; Chaarani et al., Reference Chaarani, Hahn, Allgaier, Adise, Owens, Juliano, Yuan, Loso, Ivanciu, Albaugh, Dumas, Mackey, Laurent, Ivanova, Hagler, Cornejo, Hatton, Agrawal and Aguinaldo2021) and assesses participants’ reactions to potential gains or losses. They respond to cues using a button box, aiming to win (or avoid losing) money or based solely on reaction times – choices are not involved. In “win” scenarios, quick responses could earn either $5.00 or $0.20, while in “lose” scenarios, timely reactions prevent the loss of the same amounts. “Neutral” trials involve the same actions but without financial stakes. The task’s structure starts with a visual cue indicating the trial type, followed by a variable-duration fixation period, and then a prompt to respond within a specific timeframe that adjusts based on performance to maintain a 60% accuracy rate. Feedback is immediately given post-response. The task includes two sessions (runs). Each session includes 50 trials across five minutes and forty-two seconds. Participants’ pay reflects task performance, averaging $20. For more information on the fMRI data preprocessing see Supplementary Section 1. Key contrasts in the MID task are activation to large reward versus neutral and to large loss versus neutral conditions, shown to have robust activation patterns in the ABCD sample (Chaarani et al., Reference Chaarani, Hahn, Allgaier, Adise, Owens, Juliano, Yuan, Loso, Ivanciu, Albaugh, Dumas, Mackey, Laurent, Ivanova, Hagler, Cornejo, Hatton, Agrawal and Aguinaldo2021). Subcortical areas included the amygdala, accumbens, putamen, caudate, thalamus, and hippocampus. Cortical areas focused on the cingulate gyrus and sulcus (anterior, middle, posterior, and marginal regions), insula, middle frontal gyrus, precuneus, and inferior frontal gyrus (including opercular, triangular, and orbital parts), orbitofrontal area and the superior frontal gyrus. The anticipation of large reward/loss versus neutral contrast was chosen because it has been shown to elicit the most robust and reliable activation within the reward circuitry – particularly the ventral striatum, orbitofrontal cortex, and anterior cingulate – across developmental samples (Bjork et al., Reference Bjork, Knutson, Fong, Caggiano, Bennett and Hommer2004; Chaarani et al., Reference Chaarani, Hahn, Allgaier, Adise, Owens, Juliano, Yuan, Loso, Ivanciu, Albaugh, Dumas, Mackey, Laurent, Ivanova, Hagler, Cornejo, Hatton, Agrawal and Aguinaldo2021; Demidenko et al., Reference Demidenko, Mumford, Ram and Poldrack2024; Hagele et al., Reference Hagele, Schlagenhauf, Rapp, Sterzer, Beck, Bermpohl, Stoy, Strohle, Wittchen, Dolan and Heinz2015; Knutson et al., Reference Knutson, Adams, Fong and Hommer2001). ROIs were selected a priori based on regions consistently implicated in reward anticipation in the MID task, following prior large-scale and meta-analytic studies (Chaarani et al., Reference Chaarani, Hahn, Allgaier, Adise, Owens, Juliano, Yuan, Loso, Ivanciu, Albaugh, Dumas, Mackey, Laurent, Ivanova, Hagler, Cornejo, Hatton, Agrawal and Aguinaldo2021; Knutson et al., Reference Knutson, Adams, Fong and Hommer2001; Wilson et al., Reference Wilson, Colizzi, Bossong, Allen, Kempton and Bhattacharyya2018).
BIS/BAS scale measures: Drive, fun-seeking, and reward responsiveness: The Behavioral Inhibition System and Behavioral Activation System (BIS/BAS) scale includes 20 items corresponding to one BIS subscale and three BAS subscales (Carver & White, Reference Carver and White1994). We used the three BAS subscale scores: Drive (four items on motivation to engage in goal-directed behavior (Pagliaccio et al., Reference Pagliaccio, Luking, Anokhin, Gotlib, Hayden, Olino, Peng, Hajcak and Barch2016)), Fun-seeking (four items on inclination towards spontaneous and enjoyable behaviors), and Reward Responsiveness (four items on anticipation of, and reaction to reward-related stimuli (Carver & White, Reference Carver and White1994)), with higher scores reflecting greater drive, a higher tendency to seek novel and exciting behaviors, and greater responsiveness to rewards, respectively (range: 0–12 for all scales).
Statistical analysis
Developmental changes in the BAS Scales: In the first step of the analysis, we aimed to identify developmental changes in BAS scale scores from Baseline to Year 2 (including both baseline and 2-year BAS scores), considering effects of participant age at baseline and whether the Year 2 assessment was performed before or during the pandemic. We used generalized linear mixed-effect models to analyze each BAS subscale. The following interaction terms were included: group-by-visit, where ‘group’ differentiates prior to versus or during the pandemic and ‘visit’ compares Baseline versus Year 2, group-by-age measures at baseline and visit by age at baseline. These interaction terms were designed to explore whether changes in reward sensitivity varied based on the timing of assessments (before vs. during the pandemic) and age at baseline (since participants ranged in age, 9–10 years at baseline).
To control for the diverse demographic composition of the sample, the models included sex, race, family income, and the time difference between assessments as fixed effects. The time difference between baseline and 2-year follow-up was entered as a covariate to account for variability in the interval between assessments. Additionally, to account for the repeated measures design and the ABCD recruitment strategies, we included a random effects structure with random intercepts for subject ID and research site nested within family ID. All continuous predictors were standardized (z-scored) prior to analysis; reported beta coefficients therefore reflect the predicted change in outcome per 1 SD increase in each predictor. All statistical analyses were performed using the lme4 package in R.
Associations between the behavioral reward sensitivity measures and the neuroimaging measures: In the next step of the analysis, we investigated the associations between the behavioral reward sensitivity measures (BAS scales) and neuroimaging fMRI data from a subset of preselected ROIs associated with the MID task. We aimed to explore how neural activity in these ROIs related to reward sensitivity and how these relationships changed over time. For each model, we included an interaction term between the respective BAS scale and Visit (Baseline vs. Year 2) to account for developmental changes in the associations between reward sensitivity and neural activation. The models included the group (assessed prior vs. during the pandemic) as a main effect, along with age at baseline, as a key developmental variable. To control for potential confounding effects, we included demographic variables (race, sex, and family income) and the time difference between baseline and 2-year follow-up to account for variability in the interval between assessments. Additionally, we controlled for potential differences due to the scanner manufacturer (Siemens, GE, Philips), as the neuroimaging data were collected on different MRI systems across study sites. The random effects structure remained consistent with the previous step, incorporating random intercepts for subject ID and for family ID nested within research site to account for the repeated measures design.
To address multiple comparisons across the 24 brain regions examined per predictor, Benjamini–Hochberg (BH) false discovery rate (FDR) correction was applied within each analytic family (per predictor row across 24 ROI models; (Benjamini & Hochberg, Reference Benjamini and Hochberg1995; Genovese et al., Reference Genovese, Lazar and Nichols2002)). Corrected q-values are reported alongside raw p-values. Findings are interpreted as significant where q < 0.05; findings that do not survive correction are reported with q-values noted and are not interpreted as primary findings. Effect sizes are reported as standardized beta coefficients.
Neural network approach
We employed a network analysis approach to investigate system-level developmental changes in neuroimaging measures. The analysis aimed to capture how functional connectivity between specific brain ROIs changes between Baseline and Year 2. First, we calculated the differences in activation measures for each ROI between these two time points (Year 2 minus Baseline).
To examine the system-level changes, we computed partial correlations for each pair of activation measures within the set of ROIs, controlling for all other activation scores. This allowed us to identify significant (p < .01) relationships between pairs of brain regions, which reflect functional connectivity. We followed the method suggested by Borsboom & Cramer (Borsboom & Cramer, Reference Borsboom and Cramer2013) for estimating functional connectivity networks using partial correlations. This approach is similar to other network-level approaches adapted to task-evoked fMRI contrasts in prior studies (Göttlich et al., Reference Göttlich, Beyer and Krämer2015; Masharipov et al., Reference Masharipov, Knyazeva, Korotkov, Cherednichenko and Kireev2024; Zhao et al., Reference Zhao, Makowski, Hagler, Garavan, Thompson, Greene, Jernigan and Dale2023). In addition, we applied a correlational threshold of |r| > = 0.1 to ensure that only more robust correlations were included in our analysis.
The correlations were calculated using a method from the Python package Pingouin. (Vallat, Reference Vallat2018) For visualization, a heatmap was used to display the significant functional connectivity changes between brain regions from Baseline to Year 2. The heatmap is divided into four quadrants, representing left and right hemispheres and two functional networks (executive and reward). Each axis lists specific brain regions (ROIs), and each cell shows the partial correlation between two regions.
The color scale indicates the strength and direction of correlations, with red for positive correlations and blue for negative correlations. Darker colors represent stronger correlations, while lighter or blank cells indicate weaker or non-significant correlations. This heatmap provides a clear overview of how connectivity between brain regions evolves over time, revealing developmental changes in functional networks.
To examine system-level changes in the context of the COVID-19 pandemic, we conducted an additional analysis on a subset of the sample, comparing the brain network of those assessed during the pandemic (N = 1,318) with a matched control group (N = 1,318) of participants who had their Year 2 assessment prior to the pandemic. The control group was matched on socio-demographic factors (age, sex, race, parental education) so that differences in functional connectivity could be assessed. These comparisons were also visualized using heatmaps. Additional covariates were not included, as the pairwise partial correlation approach (controlling for all other regions) already accounts for shared variance, and adding covariates could increase model complexity and bias connection weights.
Results
Developmental changes in the Behavioral Activation System (BAS) scales
Time of assessment was associated with a consistent decrease in scores across all BAS subscales, with lower scores observed in Year 2 compared to Baseline. For BAS Drive, scores were lower in Year 2 compared to Baseline (χ2 = 65.14, p < .01) (Figure 1A). Similarly, BAS Reward Responsiveness (Figure 2) showed a decrease from Baseline to Year 2 (χ2 = 413.17, p < .01, β = 1.65 Baseline relative to Year 2), reflecting a decline in motivation. BAS Fun Seeking also followed this pattern, with lower scores in Year 2 (χ2 = 678.76, p < .01) than at Baseline (β = 2.11 Baseline vs. Year 2, Figure 3A), indicating reduced tendencies toward seeking novelty or fun over time. The timing of the assessments (Year 2 assessment before or during the pandemic) was also associated with differences across the BAS scales. BAS Drive was slightly lower for those assessed during the pandemic (χ2 = 6.77, p = .009, q = 0.013, β = −0.94) (Figure 1A). BAS Fun Seeking was slightly higher (χ2 = 4.12, p = .042, q = 0.105), however, this did not survive FDR correction and is not interpreted as a significant finding. The effect of timing (before vs. during the pandemic) on BAS Reward Responsiveness was not significant after FDR correction (χ2 = 3.21, p = .073, β = −0.08, q = 0.146).
BAS drive across time points and demographic groupings. (A) BAS drive measured at baseline and year 2, shown overall and split by timing of the year 2 assessment (before vs. during the COVID-19 pandemic). (B) BAS drive stratified by biological sex (male and female) at both baseline and year 2. (C) BAS drive grouped by age at baseline (mean age = 119.08 months), comparing participants “Older than the mean” and “Younger than the mean” at baseline and year 2. The mean is displayed as a white circle within each box.

Figure 1. Long description
Panel A: BAS Drive declines from Baseline (mean 3.98) to Year 2, slightly lower if Year 2 fell during the pandemic (3.55) vs. before (3.61) – a small but significant effect. Panel B: males (gold) score higher than females (teal) at both timepoints, both declining from Baseline to Year 2. Panel C: younger and older (vs. mean age) groups start similar at Baseline but the age gap narrows further by Year 2, consistent with the reported age × visit interaction.
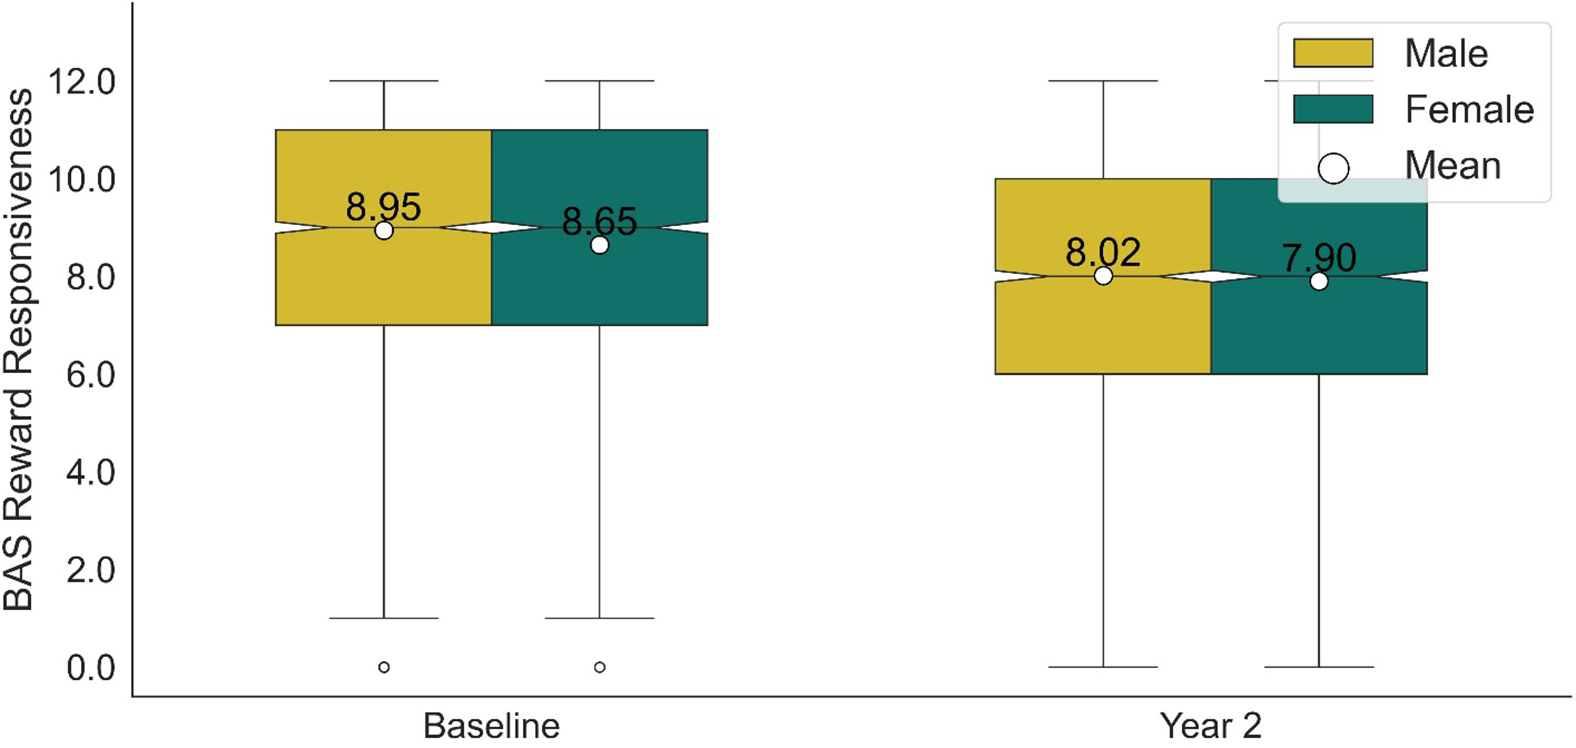
BAS reward responsiveness by assessment year and biological sex. Boxplots display BAS reward responsiveness scores for males and females at baseline and year 2. The white circles represent group means. Individual dots indicate outliers.
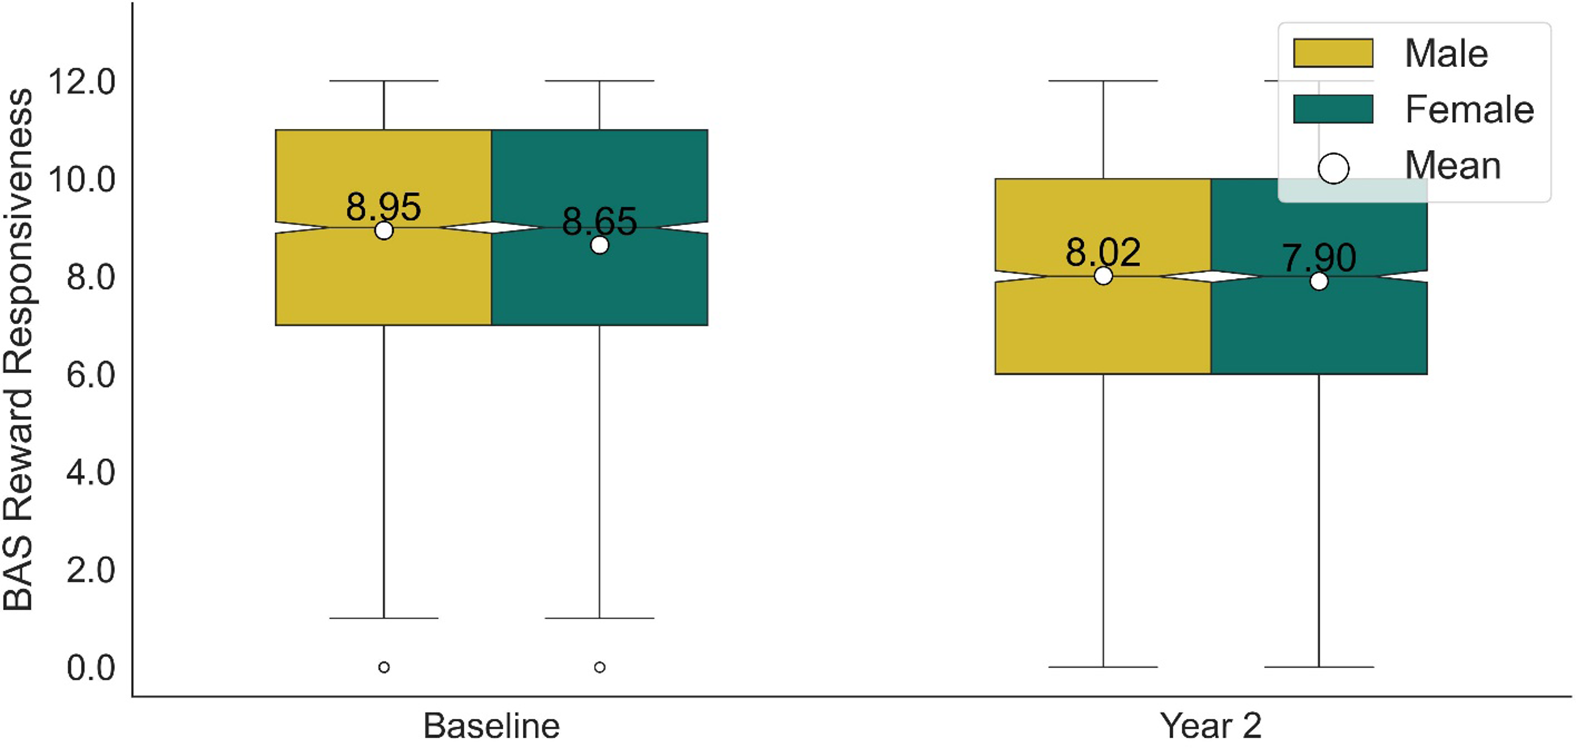
Figure 2. Long description
Males (gold) score higher than females (teal) at both Baseline (8.95 vs 8.65) and Year 2 (8.02 vs 7.90); both sexes decline from Baseline to Year 2, consistent with the significant main effects of sex and visit.
BAS fun seeking across time points, assessment periods, and biological sex. (A) BAS fun seeking scores at baseline and year 2, further broken down by assessment period: before and during the COVID-19 pandemic. Note: the split by assessment period did not survive FDR correction, q = .105. (B) BAS fun seeking scores by biological sex (male and female) at baseline and year 2. White circles indicate group means, and individual dots represent outliers.

Figure 3. Long description
Panel A: BAS Fun Seeking declines from Baseline (5.68) to Year 2, with a small before/during-pandemic difference (4.54 vs 4.48) that did not survive FDR correction. Panel B: males (gold) score higher than females (teal) at Baseline and Year 2, both declining over time.
Males reported higher BAS scores than females on all three subscales: BAS Drive (χ2 = 64.98, p < .01, β = −0.51 Females vs. Males) (Figure 1B), BAS Reward responsiveness (χ2 = 13.39, p < .01, β = −0.20 Females vs. Males) (Figure 2) and BAS Fun Seeking (χ2 = 33.27, p < .01) (Figure 3B, β = −0.34 Females vs. Males).
There was a significant interaction between visit and age at baseline on BAS Drive (χ2 = 20.48, p < .01, q < 0.001, β = −0.21). Younger participants (those younger than the mean age at baseline) demonstrated a higher BAS Drive at Baseline compared to older participants, but this difference diminished by Year 2 (Figure 1C). No significant age-related effects were observed for BAS Motivation or BAS Fun Seeking.
Longitudinal changes and associations between the self-reported reward sensitivity measures and the neuroimaging measures
Looking into the changes from Baseline to Year 2 (Figure S2), increased activation was observed in the left precuneus (p = .001, q = 0.006, β = 0.01). Increased activation in the left nucleus accumbens area (p = .039, q = 0.234) and the right precuneus (p = .040, q = 0.240) did not survive FDR correction. Decreased activation was observed in the left putamen (p = .001, q = 0.006, β = −0.01), the right caudate (p < .001, q < 0.001, β = −0.01), and the right putamen (p < .001, q < 0.001, β = −0.02). Decreased activation in the left caudate (p = .013, q = 0.052) did not survive FDR correction. With respect to the pandemic, there were no significant differences between the groups assessed before or during the pandemic.
Higher BAS Drive was not significantly associated with any brain region after FDR correction during the ‘anticipation of a large reward’ versus ‘neutral’ task conditions. Uncorrected associations were observed in the right hippocampus (p = .012, q = 0.288), left amygdala (p = .045, q = 0.432), left precuneus (p = .048, q = 0.432), left inferior frontal gyrus (p = .049, q = 0.432), right superior frontal gyrus (p = .031, q = 0.372), and right middle frontal gyrus (p = .049, q = 0.432); however, none survived FDR correction, and these are not interpreted as primary findings.
The analysis identified interactions between BAS Drive and Visit (Baseline vs. Year 2) in multiple brain regions (Figure 4). Specifically, interactions were found in the left caudate (p = .017, q = 0.041, β = −0.01), left putamen (p = .004, q = 0.016, β = −0.01), left thalamus (p = .016, q = 0.041, β = −0.01), left cingulate gyrus (p = .023, q = 0.046, β = −0.01), left inferior frontal gyrus (p = .020, q = 0.041, β = −0.01), left middle frontal gyrus (p = .001, q = 0.024, β = −0.01), left superior frontal gyrus (p = .011, q = 0.033, β = −0.01), right cingulate gyrus (p = .020, q = 0.041, β = −0.01), right middle frontal gyrus (p = .009, q = 0.036, β = −0.01), right superior frontal gyrus (p = .003, q = 0.024, β = −0.01), right caudate (p = .004, q = 0.016, β = −0.01), and right hippocampus (p = .020, q = 0.041, β = −0.01), however interactions in right putamen (p = .041, q = 0.074, β = −0.01) and right thalamus (p = .045, q = 0.076, β = −0.01) did not survive FDR correction. These results indicate that participants with higher BAS Drive showed more pronounced differences in brain activation between the two visits. In contrast, participants with lower BAS Drive exhibited relatively stable activation patterns across both visits, suggesting that changes in neural responses to reward anticipation over time are more evident among individuals with higher BAS Drive.
The interaction between BAS drive and visit (Baseline vs. year 2) on brain activation across several regions of interest during reward anticipation. Each panel depicts the relationship between BAS drive and brain activation in a specific region. The blue lines represent activation patterns at year 2, while the red lines show activation at baseline. Shaded areas represent the 95% confidence intervals.

Figure 4. Long description
Fourteen regions (bilateral caudate, putamen, thalamus, cingulate and frontal gyri, right hippocampus). In most panels the red (Baseline) and blue (Year 2) lines overlap closely at low BAS Drive and separate at higher BAS Drive, matching the reported finding that visit-related activation differences are larger in participants with higher BAS Drive. Right putamen and right thalamus show the same trend but were not statistically significant.
The BAS Reward Responsiveness score showed a positive uncorrected association with activation in the right nucleus accumbens area (p = .026, q = 0.312, β = 0.02); however, this did not survive FDR correction and is not interpreted as a primary finding.
Our analysis identified significant interaction effects between the BAS Reward Responsiveness scale and Visit (Baseline vs. Year 2) across several regions of interest during the anticipation of large rewards versus neutral stimuli (Figure 5). These regions include the left caudate (p = .005, q = 0.020, β = −0.02), left putamen (p = .001, q = 0.008, β = −0.01), left thalamus (p = .001, q = 0.008, β = −0.01), left cingulate gyrus (p = .015, q = 0.030, β = −0.01), right cingulate gyrus (p = .013, q = 0.026, β = −0.01), right nucleus accumbens (p = .010, q = 0.026, β = −0.02), right caudate (p = .004, q = 0.016, β = −0.02), right putamen (p = .001, q = 0.008, β = −0.01), and right thalamus (p = .013, q = 0.026, β = −0.01). The following regions showed uncorrected associations that did not survive FDR correction and are not interpreted as primary findings: left insular gyrus (p = .027, q = 0.065, β = −0.01), left inferior frontal gyrus (p = .039, q = 0.078, β = −0.01), left middle frontal gyrus (p = .041, q = 0.078), right insular gyrus (p = .027, q = 0.065, β = −0.01), and right hippocampus (p = .029, q = 0.065, β = −0.01). The observed interactions suggest that reward sensitivity, as measured by the BAS Reward Responsiveness scale, is associated with developmental changes in neural activity across these regions. These interaction between BAS Reward Responsiveness and Visit (Baseline vs. Year 2) consistently revealed that the differences between the two visits were more pronounced and variable at the lower end of the BAS Reward Responsiveness scale across multiple regions, suggesting that developmental changes in reward sensitivity are more noticeable in individuals with lower initial responsiveness.
The interaction between BAS reward responsiveness and visit (Baseline vs. year 2) on brain activation across several regions of interest during reward anticipation. Each panel depicts the relationship between BAS reward responsiveness and brain activation in a specific region. The blue lines represent activation patterns at year 2, while the orange lines show activation at baseline. Shaded areas represent the 95% confidence intervals.

Figure 5. Long description
Fourteen regions (bilateral caudate, putamen, thalamus, cingulate/insular gyrus, left frontal gyri, right accumbens and hippocampus). The opposite pattern to Figure 4: red and blue lines diverge most at low BAS Reward Responsiveness and converge at higher values, matching the finding that visit differences are more pronounced in participants with lower initial reward responsiveness.
For the BAS Fun Seeking scale, there was no main effect on any of the regions analyzed. An uncorrected interaction between BAS Fun Seeking and Visit (Baseline vs. Year 2) was observed in the left inferior frontal gyrus (p = .041, q = 0.984, β = −0.01) (Figure 6); however, this did not survive FDR correction and is not interpreted as a significant finding.
The interaction between BAS fun seeking (BASF) and visit (Baseline vs. Year 2) on brain activation in the left inferior frontal gyrus during reward anticipation. The panel depicts the relationship between BAS fun seeking and brain activation in this region. The blue line represents activation patterns at year 2, while the orange line shows activation at baseline. Shaded areas represent the 95% confidence intervals.

Figure 6. Long description
Red (Baseline) and blue (Year 2) lines track closely together across most of the range, diverging only at the highest BAS Fun Seeking values, where Baseline drops and Year 2 rises. This interaction did not survive FDR correction and is not interpreted as a significant finding.
Sex differences in activation patterns
Female adolescents had lower activation compared to male adolescents in the left putamen (p = .012, β = −0.01) and right putamen (p = .016, β = −0.01), while exhibiting higher activation in the left middle frontal gyrus (p = .014, β = 0.01) and the left superior frontal gyrus (p = .019, β = 0.01) when anticipating rewards compared to neutral outcomes.
System-level developmental changes in the brain-network approach
As shown in Figure 7, the network analysis revealed coordinated patterns of change in brain activation between Baseline and Year 2, reflected in partial correlations between difference scores across regions of interest (ROIs). Overall, the observed correlations were in a positive direction. The darker cells (Figure 7), particularly in the left hemisphere executive network, suggest more synchronization of brain activity with developmental changes (LH mean r = 0.25, connection density of 0.66, RH mean r = 0.23, connection density of 0.5), with regions like the middle frontal gyrus (MFG), superior frontal gyrus (SFG), and precuneus (PREC) showing stronger correlations and more closely aligned developmental trajectories. In contrast, the reward-related areas exhibited fewer robust correlations (LH mean r = 0.09, connection density of 0.20, RH mean r = 0.09, connection density of 0.19), indicating that developmental changes in this network became less synchronized over time.
This heatmap illustrates synchronized changes in brain activation between baseline and year 2 across pairs of regions of interest (ROIs). Each cell represents a partial correlation between the activation change scores (Year 2 minus baseline) of two brain regions, controlling for all other regions in the network. To highlight robust relationships, only correlations with |r| ≥ 0.1 and p < .01 are shown. The dictionary for the labels is provided in supplementary section 3.

Figure 7. Long description
A symmetric grid with regions on both axes, divided into four quadrants (Left/Right × executive/reward), red-white-blue scale (dark red ≈ +0.4, dark blue ≈ -0.4, white ≈ 0). The diagonal is dark red (self-correlation); most off-diagonal cells are white, with scattered light red cells concentrated among left-hemisphere frontal regions and a few isolated blue cells elsewhere.
The interhemispheric correlations, shown along the diagonals indicate that some regions in the executive network had relatively stronger consistency over the 2-year period. Notably, areas such as the caudate (r = 0.66), the precuneus (r = 0.62), and the frontal gyrus (MFG r = 0.48, SFG: r = 0.61) displayed stronger self-correlations between the left and right hemispheres, suggesting more synchronized bi-hemispheric development across these regions. In contrast, regions like the inferior frontal gyrus (IFG: mean r = 0.23) and the insula, particularly the short insula (r = 0.19), and the amygdala (r = 0.33) exhibited self-correlations in the change from baseline to year 2, indicating interhemispheric specialization or segregation of developmental changes between hemispheres. Some parts of the cingulate cortex also appeared to be less synchronized between the two hemispheres, with weaker correlations compared to the anterior (r = 0.61) or posterior regions (mean r = 0.54).
System-level differences in the pandemic
This analysis compared the portion of the sample that completed their 2-year follow-up during the pandemic with a portion of demographically matched participants who were assessed for their 2-year follow-up prior to the pandemic. Figure 8A and 8B illustrate how the correlations between brain regions in the reward network differed between participants assessed prior to the pandemic and those assessed during the pandemic (for more information see Supplementary section 2).
Comparison of connectivity patterns in the reward network between participants assessed prior to, or during, the pandemic. The left matrix (A) represents the correlation differences between regions in the reward network, with red cells indicating stronger correlations during the pandemic and blue cells representing weaker correlations. The right matrix (B) visualizes the emergence or disappearance of functional connections, where positive values (red) indicate new connections evident in the group who had their year 2 visit during the pandemic but not in the group who had their year 2 visit pre-pandemic, and negative values (blue) represent connections that did not appear when the year 2 visit occurred during the pandemic but were evident in the group that had their year 2 visit pre-pandemic. The dictionary for the labels is provided in supplementary section 3.

Figure 8. Long description
Two heatmaps, same region layout as Figure 7, comparing network connectivity for participants assessed during vs. before the pandemic. Panel A shows correlation-strength differences; stronger during-pandemic correlations cluster in the right-hemisphere executive network, while the left-hemisphere reward network shows a denser mix of both stronger and weaker correlations. Panel B shows where connections appeared (red) or disappeared (blue) between groups, with a visible cluster of change in the right reward network around the hippocampus and insula, reflecting the reported reorganization of left-hemisphere reward connectivity.
The figures show widespread differences in correlations between the two assessments between the group assessed during the pandemic and the one assessed pre-pandemic. Figure 8A shows that stronger correlations during the pandemic were concentrated in the executive networks (LH: mean r = 0.013, RH: mean r = −0.009), especially in the right hemisphere (with a connection density (number of connections/nodes ^ 2) of 0.27 for positive and 0.22 for negative edges; overall density: 0.5). The reward network in the left hemisphere had higher connection density (0.23) than in the right hemisphere (0.18), and it exhibited significant reorganization, as reflected by the appearance and disappearance of edges (Figure 8B). The differences observed in the during-pandemic group versus the prior-pandemic group are aligned with the overall developmental patterns reflected in Figure 8.
Discussion
This study provides a multimodal examination of reward response in adolescents, integrating both self-reported reward sensitivity measures and neural activation patterns. The results highlight several important patterns in self-reported reward sensitivity across time, pandemic status, and sex. Across all subscales of the BAS – Drive, Motivation, and Fun Seeking – participants exhibited a consistent decline from Baseline to Year 2, suggesting a general reduction in reward sensitivity over time, as shown by others (Zhou & Neale, Reference Zhou and Neale2024). Importantly, self-reported reward sensitivity was associated with distinct patterns of neural activation, particularly in response to reward anticipation. Higher BAS Drive scores were linked to reduced activation in key limbic and reward-processing regions, including the right hippocampus, left amygdala, and left inferior frontal gyrus, while increased activation was observed in the right superior and middle frontal gyri; however, these associations did not survive FDR correction and should be interpreted with caution. Moreover, developmental changes in BAS Drive were accompanied by significant interactions with neural activation in multiple reward-related brain regions, including the caudate, putamen, thalamus, and cingulate cortex, further highlighting the evolving neural basis of reward sensitivity. Similarly, BAS Reward Responsiveness was positively associated with activation in the right nucleus accumbens, a core reward-processing region; however, this did not survive FDR correction and is not interpreted as a primary finding. Interaction analyses further revealed that developmental changes in BAS Reward Responsiveness were accompanied by significant shifts in neural activity across multiple regions, including the caudate, putamen, thalamus, and cingulate cortex. Notably, the relationship between BAS Reward Responsiveness and brain activation was more variable at lower levels of reward sensitivity, suggesting that adolescents with reduced reward responsiveness undergo more pronounced changes in neural function over time. In contrast, BAS Fun Seeking did not show direct associations with neural activation in most regions, and the interaction with time in the left inferior frontal gyrus also did not survive FDR correction).
The network-level analysis provided additional insights into the broader functional organization of these changes. Over time, the executive network exhibited increased synchronization, particularly in the left hemisphere, where regions such as the middle and superior frontal gyri and the precuneus showed stronger connectivity. In contrast, the reward network displayed weaker and less synchronized correlations. The system-level differences observed in the during-pandemic group versus the prior-pandemic group are aligned with the overall developmental patterns, which can potentially reflect an accelerated brain maturation in the group of participants who were assessed during the pandemic. Our findings suggest that, while structural changes during this period may be pronounced (Gotlib et al., Reference Gotlib, Miller, Borchers, Coury, Costello, Garcia and Ho2023), neurofunctional changes, particularly in reward processing, were nuanced, reflecting subtle effects of the pandemic on brain development.
Our results about a decline in reward sensitivity across a 2-year period of early adolescence align with the findings of Vervoort et al. (Reference Vervoort, Vandeweghe, Vandewalle, Van Durme, Vandevivere, Wante, McIntosh, Verbeken, Moens, Goossens and Braet2015) who studied 546 adolescents from the United States. They found that reward sensitivity (as measured by the BAS) decreased during early adolescence: participants aged 6–11 years consistently showed higher values than those aged 12–18 years. This pattern suggests a decline in behavioral activation tendencies over this developmental period. In contrast, Urosevic et al. (Reference Urošević, Collins, Muetzel, Lim and Luciana2012) found that BAS scores increased from early to late adolescence, declining in the early twenties, and Braams et al. (Reference Braams, van Duijvenvoorde, Peper and Crone2015) found no significant age-related changes in BAS scores in a sample across a broad age range (8.01–25.95 years) (Braams et al., Reference Braams, van Duijvenvoorde, Peper and Crone2015). The inconsistencies in the literature may result from cohort effects, differences in the samples85 and in the applied BAS definitions (Pagliaccio et al., Reference Pagliaccio, Luking, Anokhin, Gotlib, Hayden, Olino, Peng, Hajcak and Barch2016). Our finding of a decline in the BAS system could be partially explained by normative developmental shifts in social–affective processing (Crone & Dahl, Reference Crone and Dahl2012), environmental stressors (Berghorst et al., Reference Berghorst, Bogdan, Frank and Pizzagalli2013), or emerging responsibilities that redirect focus away from immediate rewards (Eccles et al., Reference Eccles, Midgley, Wigfield, Buchanan, Reuman, Flanagan and Mac Iver2013). The interaction we found between Visit and age is aligned with this and indicates that this decline may have begun earlier in participants who were older at baseline, whereas younger participants experienced a more pronounced decrease in BAS Drive between the two timepoints.
This decrease in the BAS system over time was particularly marked in the group who had their 2-year follow-up during the pandemic, which could reflect potential influences of large-scale disruptions linked with the pandemic and associated regulations on motivational systems (Martin, Reference Martin2023; Ravens-Sieberer et al., Reference Ravens-Sieberer, Kaman, Erhart, Otto, Devine, Löffler, Hurrelmann, Bullinger, Barkmann, Siegel, Simon, Wieler, Schlack and Hölling2021). For instance, Magson et al. (Reference Magson, Freeman, Rapee, Richardson, Oar and Fardouly2021) reported that younger adolescents (mean age around 13–15) exhibited declines in psychosocial functioning and increased vulnerability to external stressors during the pandemic period. Ravens-Sieberer et al. (Reference Ravens-Sieberer, Kaman, Erhart, Otto, Devine, Löffler, Hurrelmann, Bullinger, Barkmann, Siegel, Simon, Wieler, Schlack and Hölling2021) showed that quality of life and mental health – including aspects of motivation and engagement – declined after the onset of the pandemic in younger adolescents (Ravens-Sieberer et al., Reference Ravens-Sieberer, Kaman, Erhart, Otto, Devine, Löffler, Hurrelmann, Bullinger, Barkmann, Siegel, Simon, Wieler, Schlack and Hölling2021). Participants assessed before the pandemic showed slightly higher BAS Drive than those assessed during the pandemic, suggesting that the pandemic context may have suppressed goal-directed activity (Loades et al., Reference Loades, Chatburn, Higson-Sweeney, Reynolds, Shafran, Brigden, Linney, McManus, Borwick and Crawley2020). Reduced social interactions, cancellations of extracurricular activities, and restrictions on movement likely contributed to fewer opportunities for pleasure-seeking and socially rewarding pursuits (Rodman et al., Reference Rodman, Rosen, Kasparek, Mayes, Lengua, Meltzoff and McLaughlin2024).
The sex differences, present across the BAS subscales, suggest that biological sex is associated with distinct patterns of behavioral activation. Consistent with previous research, males in our sample showed higher BAS Drive scores (Jorm et al., Reference Jorm, Christensen, Henderson, Jacomb, Korten and Rodgers1998) than females, indicating that males tend toward more goal-driven behaviors (Jorm et al., Reference Jorm, Christensen, Henderson, Jacomb, Korten and Rodgers1998) and often show greater novelty- or sensation-seeking (Cross et al., Reference Cross, Cyrenne and Brown2013; Shulman et al., Reference Shulman, Harden, Chein and Steinberg2015). However, the evidence is not entirely consistent, and recent research found no significant differences between biological sex and BAS subscale scores (Jung et al., Reference Jung, Lee, Kim, Lee, Oh, Lho, Moon and Kwon2022), indicating that sex differences may be more pronounced at certain stages of adolescence and can vary across contexts.
Changes in neural activation from Baseline to Year 2 were found in several regions during the MID, with increased activation in the left nucleus accumbens, left cingulate gyrus, and bilateral precuneus, while decreased activation was observed in the left and right caudate and putamen. These patterns indicate that reward processing in the brain continues to undergo significant maturation during early adolescence, potentially reflecting adaptive responses to environmental and social contexts (Casey et al., Reference Casey, Getz and Galvan2008; Steinberg, Reference Steinberg2010).
Looking at the associations between brain activation and self-reported reward sensitivity measures, the findings highlight a broad neural network that spans subcortical structures (e.g., dorsal and ventral striatum, hippocampus) and cortical areas (e.g., frontal gyri, precuneus) during reward anticipation related to drive-related behaviors. Specifically, higher BAS Drive was associated with negative activation in regions such as the left amygdala, left precuneus, and right inferior frontal gyrus, while positive associations emerged in the left and right putamen, left middle and superior frontal gyri, right hippocampus, and right superior frontal gyrus. The BAS Reward Responsiveness score was also associated with distinct activation patterns, particularly in the right nucleus accumbens, a region integral to reward processing (Cho et al., Reference Cho, Fromm, Guyer, Detloff, Pine, Fudge and Ernst2013; Galvan et al., Reference Galvan, Hare, Parra, Penn, Voss, Glover and Casey2006). These results align with previous research demonstrating that greater reward sensitivity is linked to increased activation in both cortical and subcortical regions (Silverman et al., Reference Silverman, Jedd and Luciana2015) involved in reward processing and goal-directed behavior, particularly during adolescence, when reward systems are still maturing and are sensitive to both intrinsic and extrinsic motivational cues (Walker et al., Reference Walker, Bell, Flores, Gulley, Willing and Paul2017). Notably, while the thalamus and insula significantly influence nucleus accumbens activity during reward processing in both adolescents and adults (Cho et al., Reference Cho, Fromm, Guyer, Detloff, Pine, Fudge and Ernst2013), these networks are also dynamic and continue to mature over time, potentially shaping how reward sensitivity manifests across different developmental stages.
The interaction between BAS Drive and Visit (Baseline vs. Year 2) in multiple brain regions suggests that changes in reward-related neural responses over time are more pronounced in individuals with higher initial drive. Participants with higher BAS Drive exhibited greater shifts in neural activation across visits, whereas those with lower BAS Drive showed more stable patterns. Similarly, there were significant interactions between BAS Reward Responsiveness and Visit across several brain regions, showing more pronounced differences at the lower end of the BAS Reward Responsiveness scale. This may indicate that individuals with a stronger goal-oriented drive experience more dynamic changes in reward processing during adolescence, while adolescents with initially lower reward responsiveness exhibit greater neural variability over time. These findings align van Duijvenvoorde et al. (Reference Van Duijvenvoorde, Peters, Braams and Crone2016), who showed that reward processing in frontal and striatal regions evolves markedly during the teenage years, with more pronounced differences in those who report stronger sensation-seeking or higher motivational drive. Similarly, Braams et al. (Reference Braams, van Duijvenvoorde, Peper and Crone2015) reported that individual differences in approach-related traits predict greater developmental shifts in striatal responses to rewards during adolescence. In a broader sense, these patterns may also reflect a developmental adjustment in response to changing motivational cues or shifting environmental contexts, such as the changes in social connectedness (Blakemore, Reference Blakemore2012; Crone & Dahl, Reference Crone and Dahl2012).
Sex differences were also observed, with female adolescents showing lower activation in the left and right putamen but higher activation in the left middle and superior frontal gyri compared to males. These findings contribute to the growing body of literature highlighting sex differences in reward processing (Vermeersch et al., Reference Vermeersch, T’Sjoen, Kaufman and Vincke2009), suggesting that females and males may engage different neural circuits during reward anticipation or engage nodes differently within the same fronto-striatal reward circuit. A previous study examining the sex differences in ABCD participants neuronal activation at baseline and Year 2 during the MID task found that males exhibited higher neural reward sensitivity than females with pubertal stage not significantly associated with neural activation during reward anticipation or feedback, suggesting that age-related brain development, rather than puberty alone, primarily drives reward processing in early adolescence (Barendse et al., Reference Barendse, Swartz, Taylor, Fine, Shirtcliff, Yoon, McMillan, Tully and Guyer2024). This suggest these sex differences are potentially driven by other biological age-related or social factors (Spreckelmeyer et al., Reference Spreckelmeyer, Krach, Kohls, Rademacher, Irmak, Konrad, Kircher and Gründer2009).
The network analysis revealed that executive areas in both hemispheres appears to demonstrate more cohesive developmental changes (van Drunen et al., Reference van Drunen, Toenders, Wierenga and Crone2023), with stronger and more consistent correlations between regions. The reward network, however, shows more variability, with weaker and less consistent developmental shifts, particularly in the right hemisphere. These findings highlight that different networks and brain regions may undergo distinct patterns of development during the transition from Baseline to Year 2, with developmental effects slightly more emphasized in the context of the pandemic. However, these changes were subtle and not very widespread. To our knowledge, no other study has examined the longitudinal changes in brain function using functional MRI data within the context of the pandemic. Prior research indicates that the COVID-19 pandemic and associated lockdowns had significant impacts on adolescent brain development, mainly reflected in widespread structural changes, such as accelerated brain maturation (Gotlib et al., Reference Gotlib, Miller, Borchers, Coury, Costello, Garcia and Ho2023), particularly in females (Corrigan et al., Reference Corrigan, Rokem and Kuhl2024), as well as reduced cortical thickness (Corrigan et al., Reference Corrigan, Rokem and Kuhl2024) (e.g. medial prefrontal cortex (van Drunen et al., Reference van Drunen, Toenders, Wierenga and Crone2023)) and larger hippocampal (van Drunen et al., Reference van Drunen, Toenders, Wierenga and Crone2023) and amygdala volumes (Gotlib et al., Reference Gotlib, Miller, Borchers, Coury, Costello, Garcia and Ho2023).
Given that many adolescents experienced increased depressive symptoms, negative affect, and loneliness during the pandemic (Barendse et al., Reference Barendse, Flannery, Cavanagh, Aristizabal, Becker, Berger, Breaux, Campione‐Barr, Church, Crone, Dahl, Dennis‐Tiwary, Dvorsky, Dziura, van de Groep, Ho, Killoren, Langberg, Larguinho and Pfeifer2023) the subtle functional changes found in the current analysis, particularly in reward processing, may reflect the brain’s adaptive responses to heightened emotional challenges during times of crisis (Masten, Reference Masten2011).
This study had several strengths, including a diverse and relatively large sample and the ability to control for relevant covariates. Furthermore, we successfully linked brain-level reward processing effects to self-reported reward outcomes, providing a more comprehensive understanding of the observed developmental processes. However, several limitations should be considered and addressed in future research. First, our design focused exclusively on ROIs previously identified in the literature as potential targets. While this approach enhances specificity, it limits the exploration of other neural regions that may also play a role. Second, although the sample size was relatively large, it is not representative of the U.S. population, which limits the generalizability of our findings. Future studies should aim for broader and more representative samples to better capture population-wide trends. To address the complexity of multiple comparisons, Benjamini–Hochberg FDR correction was applied within each analytic family (behavioral models, brain-behavioral ROI models, and network analyses). The core findings reported in this paper survive this correction. Nonetheless, larger studies with replication samples are needed to confirm these findings, particularly those that approached but did not reach significance after correction.
Family income was measured at baseline and may not reflect potential changes in socioeconomic circumstances over the two-year follow-up period. It is also possible that regional variation in COVID-19 burden and related stressors influenced participants’ experiences. Although this was beyond the scope of the present analyses, prior work in the ABCD cohort has examined such effects in more detail (Marshall et al., Reference Marshall, Hackman, Kan, Abad, Baker, Baskin-Sommers, Dowling, Gonzalez, Guillaume, Kiss, McCabe, McCandliss, Pelham, Tapert, Van Rinsveld and Sowell2022). Moreover, pandemic-related disruptions in ABCD data collection may have introduced cohort effects that influence participation and developmental trajectories (Saragosa-Harris et al., Reference Saragosa-Harris, Chaku, MacSweeney, Guazzelli Williamson, Scheuplein, Feola, Cardenas-Iniguez, Demir-Lira, McNeilly, Huffman, Whitmore, Michalska, Damme, Rakesh and Mills2022); however, our analytic approach helps partially distinguish cohort-related influences from age-related patterns. We acknowledge the inherent limitations of task-based fMRI, including challenges in the reliability and stability of activation estimates, particularly in developmental cohorts (Demidenko et al., Reference Demidenko, Mumford, Ram and Poldrack2024; Kennedy et al., Reference Kennedy, Harms, Korucuoglu, Astafiev, Barch, Thompson, Bjork and Anokhin2022). Recent multiverse analyses have further demonstrated that analytic decisions – such as contrast selection, motion correction, and model parameterization – can significantly influence test–retest reliability in the MID task (Demidenko et al., Reference Demidenko, Mumford, Ram and Poldrack2024). In the current study, only data passing ABCD quality-control thresholds for motion and framewise displacement were included. Analytic decisions were carefully discussed with neuroimaging experts (including co-authors with extensive experience in the ABCD imaging pipeline) and were guided by prior literature using the MID task in developmental samples. Analyses were further restricted to well-validated task contrasts (Demidenko et al., Reference Demidenko, Huntley, Jahn, Thomason, Monk and Keating2020) and regions of interest consistently implicated in reward and executive control processes.
Furthermore, our confirmatory factor analysis indicated coherent covariance among regions within the reward network, supporting construct validity even in the context of expected developmental variability.
Despite these limitations, the findings provide meaningful insights into the neural and behavioral mechanisms underlying developmental processes, laying the groundwork for future investigations.
Conclusions
This study provides a comprehensive examination of reward processing in adolescents, integrating self-reported reward sensitivity measures with neural activation patterns. The findings highlight dynamic changes in reward sensitivity and neural responses during adolescence, with significant influences of age, sex, and the unique context of the COVID-19 pandemic. The observed declines in reward sensitivity over time, particularly among younger adolescents during the pandemic, underscore the profound impact of large-scale disruptions on motivational systems and brain development. These changes were paralleled by nuanced functional shifts in brain regions associated with reward processing, suggesting that adolescence is marked by ongoing maturation of neural networks in response to both intrinsic and extrinsic factors.
Sex differences in reward-related neural activation further emphasize the importance of considering biological and social influences in studying developmental trajectories. Notably, the interaction between reward sensitivity and time revealed that individuals with higher initial drive experience more pronounced changes in neural activity, while those with lower reward responsiveness show greater variability.
While subtle, the functional changes observed during the pandemic complement evidence of structural brain alterations, highlighting the adaptability of the adolescent brain under heightened emotional and environmental challenges. These results highlight the individual differences in reward processing, emphasizing that normative developmental changes are not necessarily uniform. To better support those who may be more vulnerable, it is essential for future research and interventions to address these variations especially in the context of major stressors experienced.
Supplementary material
The supplementary material for this article can be found at https://doi.org/10.1017/S095457942610193X.
Data availability statement
Availability of data: The datasets analyzed during the current study are from the ABCD data repository, available at the NIMH Data Archive Digital Object Identifier (DOI) 10.15154/8873-zj65. DOIs can be found at https://doi.org/10.15154/1518688.
Availability of code: The imaging data preprocessing pipeline is owned and maintained by the ABCD Study® and is publicly described at https://abcdstudy.org. The statistical analysis code developed for this manuscript is available from the corresponding author upon reasonable request.
Availability of methods/materials: All task protocols and measures used are part of the standard ABCD Study® protocol, publicly documented at https://abcdstudy.org.
Acknowledgments
Data used in the preparation of this article were obtained from the Adolescent Brain Cognitive Development SM (ABCD) Study (https://abcdstudy.org), held in the NIMH Data Archive (NDA). This is a multisite, longitudinal study designed to recruit more than 10,000 children age 9-10 and follow them over 10 years into early adulthood. The ABCD Study® is supported by the National Institutes of Health and additional federal partners under award numbers U01DA041048, U01DA050989, U01DA051016, U01DA041022, U01DA051018, U01DA051037, U01DA050987, U01DA041174, U01DA041106, U01DA041117, U01DA041028, U01DA041134, U01DA050988, U01DA051039, U01DA041156, U01DA041025, U01DA041120, U01DA051038, U01DA041148, U01DA041093, U01DA041089, U24DA041123, U24DA041147. A full list of supporters is available at https://abcdstudy.org/federal-partners.html. A listing of participating sites and a complete listing of the study investigators can be found at https://abcdstudy.org/consortium_members/. ABCD consortium investigators designed and implemented the study and/or provided data but did not necessarily participate in analysis or writing of this report. This manuscript reflects the views of the authors and may not reflect the opinions or views of the NIH or ABCD consortium investigators. The ABCD data repository grows and changes over time. The ABCD data used in this report came from: The ABCD data used in this report came from the ABCD 5.1 data release. DOIs can be found at https://nda.nih.gov/study.html?id=901 and https://nda.nih.gov/study.html?&id=1041.
Author contributions
Orsolya Kiss: analyzed the data, constructed the figures, and wrote the first draft of the manuscript. Conception and design of experiments and analysis: Orsolya Kiss, Fiona C. Baker, Eva M. Müller-Oehring. Writing - review & editing; Fiona Baker, Eva M. Müller-Oehring, Anya Harkness, Marie Gombert-Labedens, Susan F. Tapert, Andrew T. Marshall, Elizabeth Sowell, Lucy Y. Shao, Bohan Xu, Chun Chieh Fan, Wesley K. Thompson, Bader Chaarani, Deanna Greene.
Funding statement
O.K., F.C.B., and E.MO. were supported by the National Institutes of Health (R01MH128959, R01MH135492) and additional federal partners under award number U01DA041022. The content is solely the responsibility of the authors and does not necessarily represent the official views of the National Institutes of Health.
Competing interests
The authors declare no competing interests.
Pre-registration statement
This study was not pre-registered. The analyses presented are secondary analyses of existing data from the Adolescent Brain Cognitive Development (ABCD) Study®, and the specific hypotheses were formulated after data collection.



 Open access

