Introduction
In Australia at least half the 180,000 people in residential care have dementia (Australian Institute of Health and Welfare, 2012). These people are extremely vulnerable and require a great deal of assistance with activities of living. Many have high rates of inappropriately managed symptoms such as agitation and depression (Edvardsson et al., Reference Edvardsson, Winblad and Sandman2008; Desborough et al., Reference Desborough2011). These symptoms can occur when the care environment is unfamiliar and unpredictable (Edvardsson et al., Reference Edvardsson, Winblad and Sandman2008). Both the care that is provided and the physical care environment are factors in the person's ability to maintain a sense of well-being (Kitwood and Bredin, Reference Kitwood and Bredin1992).
Agitation can be reduced with person centred care (PCC) (Chenoweth et al., Reference Chenoweth2009; Desborough et al., Reference Desborough2011), which is informed by the Social-Psychological Theory of Personhood in Dementia (Kitwood and Bredin, Reference Kitwood and Bredin1992). The theory explains how agitation can result from negative contextual stimuli that disregard or deny personhood. The quality of the care interactions occurring has a great bearing on how people with dementia will feel. Warm, empathetic care interactions help the person to feel happy and relaxed, while negative, disrespectful and dis-engaged care interactions can lead to agitation and ill-being (Kitwood and Bredin, Reference Kitwood and Bredin1992). The aim of PCC is to support personhood and remaining abilities (Surr, Reference Surr2006; Chenoweth et al., Reference Chenoweth2009).
Direct care staff can acquire PCC skills through training and supervision, but management leadership and a supportive workplace culture are needed to reinforce PCC (Jeon et al., Reference Jeon, Luscombe, Chenoweth, Stein-Parbury, Brodaty and Haas2012). A person-centred culture requires that executive and front-line managers implement a person-centred organisational framework in which quality dementia care can be provided by direct care staff (Brooker, Reference Brooker2004). When this occurs direct care staff will have far greater opportunities to consider each resident's unique history in establishing a positive relationships with them and their family, altering work routines to meet the resident's needs and involving the resident in meaningful activities of daily care (Edvardsson et al., Reference Edvardsson, Winblad and Sandman2008; Stein-Parbury et al., Reference Stein-Parbury, Chenoweth, Jeon, Brodaty, Haas and Norman2012).
Empirical research has demonstrated that aspects of the physical environment can assist carers to help the person with dementia to feel more secure (Bicket et al., Reference Bicket2010). The care environment can be designed to reduce confusion, agitation and depression while improving social interaction and engagement with others and the environment (Day et al., Reference Day, Carreon and Stump2000; Fleming and Purandare, Reference Fleming and Purandare2010). A person-centred care environment (PCE) (Davis et al., Reference Davis, Byers, Nay and Koch2009) can prompt the person to maintain their daily living abilities (Briller et al., Reference Briller, Proffitt, Perez, Calkins, Marsden, Nay and Garratt2001; Brooker et al., Reference Brooker, Woolley and Lee2007; Brooker, et al., Reference Brooker, Argyle, Scally and Clancy2011) and can trigger memory cues and other cognitive processes that slow the decline in communication, social function and mobility (Fleming and Purandare, Reference Fleming and Purandare2010). Recognisable features in the physical care environment have a great bearing on how people with dementia will feel and behave (Surr, Reference Surr2006; Edvardsson et al., Reference Edvardsson, Winblad and Sandman2008).
Unlike with PCC there have been no large scale dementia studies designed to determine the effectiveness of PCE alone and combined with PCC. The PerCEN study aimed to address this knowledge gap. Given that both PCC and PCE are intrinsically site-level interventions, PerCEN was designed as a group randomised controlled trial.
Study Hypothesis
We hypothesised that both PCC and PCE would improve resident agitation, quality of life, emotional responses in care and depression, and improve care interaction quality, and that PCC+PCE would lead to even greater improvements in these outcomes relative to usual care and usual environment.
Method
Design
In a factorial group-randomised cohort design, assessments occurred at three time points (pre, post and eight months follow-up) to evaluate the effects of PCC, PCE and PCC+PCE (Chenoweth et al., Reference Chenoweth2011).
Study sites and participants
Residential care home eligibility criteria
Government accreditation and building certification; high-level care homes; accessible by sealed road, located within a 500 km radius of Sydney, Australia; with room for improvement in both PCE and PCC according to the Person-Centred Environment and Care Assessment Tool (PCECAT), a validated 44-item rating instrument with three domains designed for evaluation of residential aged care (Burke et al., Reference Burke, Chenoweth and Stein-Parbury2012). The PCECAT 4-point scale was rescored 0 (the best possible rating) and 1, 2, 3 (the worst possible ratings, ranked). A total “room for improvement score” (RFI) was calculated by summing across items (20 items in Domain 2 (Care Services), and 19 in Domain 3 (Environment). Homes that scored 1–3 for both Care Services and Environment RFI were considered eligible. Of 150 homes approached, 89 homes were suitable for screening and 38 were eligible (Figure 1).
Consort flow diagram/study protocol.

Resident eligibility criteria
Self-consent, proxy consent or Guardianship Tribunal consent; recorded dementia diagnosis; permanent stay; admission at least 3 months prior to baseline; assessed high care needs and presence of agitation; ability to participate over the life of the study (e.g. no florid mental illness or end-stage dementia). The 38 eligible facilities contained 1,474 residents, of whom 789 were eligible and 601 were consented.
Sample size and sampling
Sample size calculations were informed by our previous study (Chenoweth et al., Reference Chenoweth2009): within resident intra-class correlation (ICC) of 0.6; within-site ICC of 0.07; and relative benefit of PCC versus usual care of 8%. Assuming the same magnitude of effect for PCE versus usual care and fixing Type 1 error rate at 5%, we determined that 38 homes, with 10 residents per home at follow-up (380 in total), would have 80% power to detect a clinically important difference of 8%, and 12 residents per home would have 90% power (Murray, Reference Murray1998). Our previous study dropout rate was 25% from baseline to follow-up (Chenoweth et al., Reference Chenoweth2009), so the recruitment target was 15 residents per home.
Participant Recruitment
Research ethics approval was granted by the University of Technology Sydney Human Research Ethics committee approval number: UTS-HREC 2006-269A in November 2007, and also by the participating residential care homes. Proxy consent was obtained for all participating residents and both written and verbal consent were obtained from a small number of residents who were able to understand and remember the study's purpose and procedures prior to administering the measures that required their direct involvement.
Randomisation and masking
Eligible homes were stratified by: Care Services and Environmental RFI scores (3–10; >10); dementia specific unit (yes, no); location (inner metropolitan, outer metropolitan, rural); size (number of dementia beds – 10–20 beds (small), >20 beds (large); type (profit, not for profit).They were then randomly allocated to one of the four treatment groups (usual care and environment, i.e. non-intervention, PCC, PCE, PCC+PCE). Stratification, randomisation and analysis were conducted by the study statisticians, masked to homes’ identities. Data collectors were masked to intervention allocation.
Trial registration
The PerCEN study (ACTRN 12608000095369) was registered on 20th February 2008 after ethical approvals were obtained. Registered amendments to the trial protocol prior to data collection included the addition of two research instruments. The trial commenced in January 2009 following research staff training.
Measurement
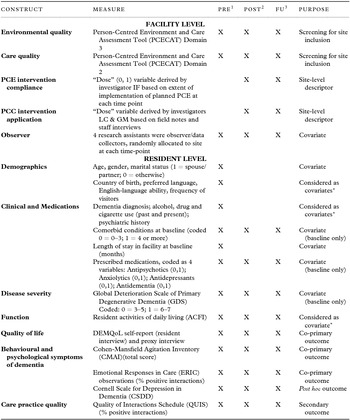
The study protocol publication (Chenoweth et al., Reference Chenoweth2011) gives full details of the study methodology, including: the intention-to-treat analysis of the co-primary resident outcomes and the quality care interaction measure; the relevant constructs, measures, purpose in analysis, and measurement time points (Table 1).
PerCEN study measures

Assessment timepoints: pre-intervention (1, Pre); post-intervention (Post, 2); 8 months follow-up (FU, 3).
*Considered as covariate, but not included in final models.
Study interventions
PCC alone was planned to be implemented in 9 homes, PCE alone in 10 homes and PCC+PCE in 10 homes. Written and verbal agreements were obtained from the facility executive and managers to enable implementation of the study interventions four months after baseline assessment.
Person-centred care (PCC)
Two experts in PCC and one PCC trainer from Alzheimer's Australia used experiential and adult learning approaches to train five staff from each of the 19 PCC homes (one care manager, one Registered Nurse, two Enrolled Nurses or Assistants in Nursing, 1 Diversion/Recreation Therapist). These staff received 32 hours off-site training which focused on paying attention to the residents’ feelings when agitated, interacting with residents in a person-centred way and using person-centred care planning to meet the residents’ psychosocial needs, followed by on-site supervision in these processes (range 2–16 hours) and telephone support.
Person-centred dementia environment (PCE)
Two experts in PCE principles (Davis et al., Reference Davis, Byers, Nay and Koch2009) planned and supervised implementation of recommended PCE interventions with a maximum budget of AUD$10,000 per home in the 10 PCE alone homes and in 6 of 10 PCE and PCC homes. Prior to implementing PCE the Environmental Audit Tool (EAT) scores identified features in each home that could be improved (Fleming, Reference Fleming2011). These included improvements to the safety, accessibility and utility of outdoor spaces, provision of a greater variety of social spaces and using colour and objects for way-finding and to improve feelings of familiarity.
Usual care and usual environment
In the remaining 9 non-intervention homes (UC+UE) any unplanned changes in care practices and environment that were initiated by the home managers between baseline and follow-up were regularly monitored.
Data collection procedures
Data collection occurred from February 2009 to February 2011 at three times: pre-intervention (Pre); post-intervention (Post); and eight months follow-up (FU).
Prior to recruitment two trained observers screened 89 eligible homes with the PCECAT (IRR = 0.96) to identify their room for improvement and 38 of these homes were recruited. The Project Manager visited the 38 participating homes and obtained written agreements from their managers that no staff would rotate between co-located intervention and control homes, or any other care unit within these homes. Agreements were obtained from all staff that they would not discuss any aspect of the study interventions with others outside their own care unit and with the research staff. A third trained assessor blind to treatment allocation evaluated the 38 recruited homes’ care environments using the EAT (Fleming, Reference Fleming2011) and four additional trained observers masked to intervention allocation obtained resident data (inter-rater reliability (IRR) = 0.86), randomised to different homes in all data collection rounds. Post-intervention data were collected six months after planned intervention commencement and follow-up data were collected 8 months following post-test.
Data analysis
Differences between the randomly allocated intervention groups in resident and home characteristics at baseline were tested with χ2 tests for categorical variables, and one-way ANOVA for continuous variables. Resident study completers were compared with non-completers on key baseline characteristics.
Outcome measures were scored according to standard algorithms: DemQOL (Smith et al., Reference Smith2005) proxy total score (possible score range 31–124), DemQOL self-report total score (possible score range 28–112), higher score is better for both; Cohen-Mansfield Agitation Inventory (CMAI) (Cohen-Mansfield, Reference Cohen-Mansfield1999), possible score range 29–203, higher score is worse; and Cornell Scale for Depression in Dementia (CSDD) (Alexopoulos et al., Reference Alexopoulos, Abrams, Young and Shamian1988), possible score range 0–38, higher score is worse. Emotional Responses in Care (ERIC) (Fleming, Reference Fleming2005) was analysed as the percentage of positive emotional responses, and Quality of Interactions (QUIS) (Dean et al., Reference Dean, Proudfoot and Lindesay1993) as the percentage of positive care interactions.
General linear mixed models were estimated using the methods for nested cohort designs described by Murray (Reference Murray1998). All three time points were included as outcomes to test for global group differences and for trends over time. Characteristics of homes and residents considered to be potential confounders were assessed for inclusion as covariates, based on criteria recommended by Murray (Reference Murray1998). The final models were adjusted for resident cognitive function Global deterioration rating scale for assessment of primary degenerative dementia (GDS) (Reisberg et al., Reference Reisberg, Ferris, de Leon and Crook1982), co-morbidities, length of stay, age, gender, marital status and use of antipsychotics, benzodiazepines, antidepressants and anti-dementia drugs at baseline. Intention-to-treat analyses were performed as per protocol (Chenoweth et al., Reference Chenoweth2011). Modelling was implemented with SASv9.3 Proc Mixed, using maximum likelihood estimation (SAS Institute, 2011).
A post hoc analysis examined the effect of each home's compliance (dose scores) with PCE and PCC interventions on its residents’ mean agitation (CMAI) change scores. Individual resident change scores were regressed and the same covariates included in the mixed models, analysing post and follow-up time-points separately. Adjusted mean change scores and 95% confidence intervals were plotted by home and intervention compliance.
Results
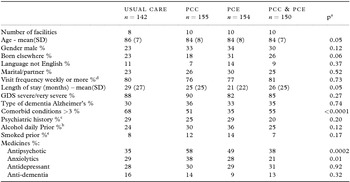
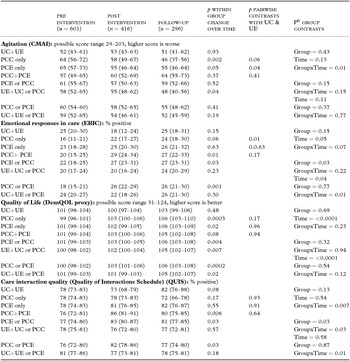
601 residents were recruited from 38 randomised residential care homes. Home characteristics used in stratification were reasonably balanced across randomisation groups, except for the PCECAT care service quality scores, where the majority randomised to PCC alone had less room for improvement. Resident drop-out assessed at post-test and follow-up are shown in Figure 1. The majority of residents with severe cognitive decline were female and aged 85 on average. Their pre-intervention characteristics differed by randomisation group in some respects (Table 2); a higher proportion of residents in PCC alone and PCE alone homes received antipsychotic medications, and co-morbidities were most prevalent in non-intervention homes and least prevalent in PCE alone homes. Resident completers and non-completers had similar characteristics and pre-intervention CMAI scores (for n = 185 missing at post, p = 0.37; for n = 305 missing at follow-up, p = 0.97), DEMQOL proxy scores (post, p = 0.76; follow-up, p = 0.98), ERIC ratings (Fleming, Reference Fleming2005) (post, p = 0.37; follow-up, p = 0.45), and for all other outcomes. Table 3 shows the adjusted mean scores for the co-primary and secondary outcome variables.
Characteristics of resident sample pre-intervention for n = 601

aF for continuous variables and χ2 for categorical variables.
bData missing for 20; c.Data missing for 13; d. Data missing for 8; e. Data missing for 15.
Abbreviations: GDS = Global Deterioration Scale
Pre-, Post-intervention and Follow-up adjusted mean scoresa (95% confidence intervals) for agitation, emotional responses to care, quality of life and quality of care interactions

Abbreviations: UC = usual care; UE = usual environment; PCC = person centred care; PCE = person centred environment; CMAI = Cohen-Mansfield agitation inventory; ERIC = Emotional Responses in Care; QUIS = Quality of interactions schedule.
a. Predicted mean from a mixed model which accounted for clustering within facility and adjusted for covariates. Estimates for all groups adjusted to the total sample mean levels for all covariates: Research Assistant; Global Deterioration Scale (severe/very severe); prescribed medicines: antipsychotic, anxiolytics, antidepressant, anti-dementia; number of co-morbid conditions (4 or more); length of stay (months); age; gender; marital status (spouse/partner).
b. Group, time and group by time effect in the mixed model for change over time, as well as separate time effects for each group.
Quality of life
A small number of residents were sufficiently competent to complete the self-report DEMQOL (Pre n = 120; Post n = 99; Follow-up n = 17) and 47 completed both Pre and Post. There were no statistically significant group differences for this subset (p = 0.92 for group, p = 0.63 for time, p = 0.23 for group-by-time interaction). DEMQOL proxy data indicated there were improvements in quality of life for residents in PCC homes (p = 0.0003 for change over time), PCE homes (p = 0.02 for change over time) and in PC+PCE homes (p = 0.08), however, the group-by-time interaction was not significant (p = 0.23).
Agitation
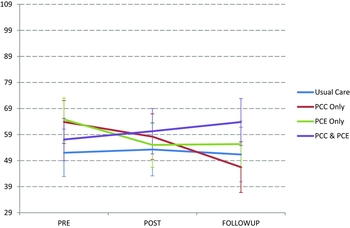
Residents in PCE homes and PCC homes had small statistically significant decreases in agitation (CMAI, p = 0.5, p = 0.002 respectively), while those in PCC+PCE and in the non-intervention homes had non- significant changes (see Table 3, significant group-by-time interaction, p = 0.01; Figure 2 for adjusted mean scores over time for each group).
Adjusted CMAI means scores pre/post/follow-up.

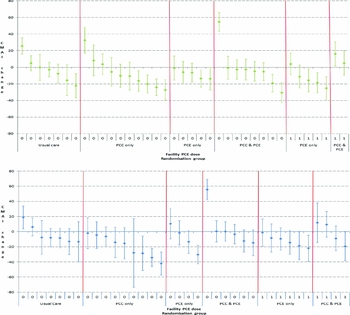
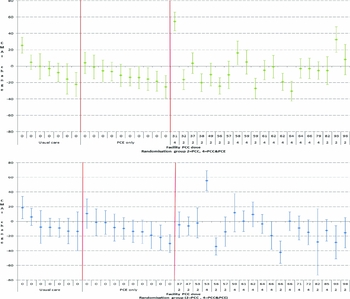
As homes varied in their implementation of PCC and/or PCE, and CMAI scores improved over time in PCC or PCE homes but not in PCC+PCE homes, we investigated the extent to which this might be related to compliance with the interventions. Inspection of the plots of mean CMAI change by home (Figure 3) revealed no clear evidence to link reduced agitation to variability in implementation of either planned PCC or PCE. Homes with the highest PCC implementation scores did not show the greatest reduction in agitation at Follow-Up and some of the non-intervention homes showed a similar level of improvement as some homes with the highest PCC implementation (Figure 4). However, one home assigned to PCC+PCE showed poor implementation of both interventions and substantial worsening of agitation. Model re-estimation excluding this outlier did not change the significance of any estimates, but did lower the mean agitation score in the PCC+PCE group, making it relatively stable over time rather than worsening. A further post hoc analysis examined the difference between CMAI score changes in homes with a substantial improvement in the EAT total score (10 or more) and the other homes, while controlling for clustering and adjusting for covariates. Both groups showed non-significant improvements in agitation, although the change for homes with improved EAT scores was larger than for other homes.
CMAI means changes per facility.

Adjusted mean change in CMAI and 95% confidence limits for each facility at Post (top panel) and Follow-up (bottom panel) by PCC implementation (O = not implemented; > O implementation “dose” score) and randomisation group.

Emotional responses
The percentage of positive emotional responses to care (ERIC) improved significantly over time for the PCC+PCE group (by 7% on average, p = 0.01), but as the group-by-time interaction was not significant (p = 0.07), we cannot infer differences among groups for emotional responses. There were no statistically significant differences in depression (CSDD) scores over time or between groups.
Quality of care interactions
Care interaction quality (QUIS) (Dean et al., Reference Dean, Proudfoot and Lindesay1993) improved in the PCC+PCE group post-intervention (p = 0.006, for change over time) (Table 3) but was not sustained at follow-up. QUIS improvements did not occur in the other groups (group-by-time interaction p = 0.007).
Costs
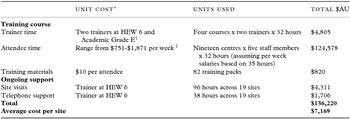
The total cost of delivering PCC to 19 homes was $136,220 ($7,169 per home). This included the costs of trainers, replacement staff attendees, training materials, site visits and telephone support (see Table 4). Some recommended changes to PCE alone and PCE+PCC homes were not implemented due to management safety concerns, council regulations and internal management disagreement. Both recommended and actual costs are reported here; the costs include environmental assessment, making the changes and additional funds contributed by 8 of the PCE alone homes and 4 of the PCE+PCC homes. The planned total cost of the recommended changes to PCE homes was $139,644 ($13,964 per home). The total actual PCE costs equalled $91,982 ($9,198 per home). The recommended total cost of the interventions in the PCE+PCC homes was $275,385 ($27,538 per home) and the actual total cost was $228,570 ($22,857per home).
Person centred care intervention costs

*All salary costs are assumed to include 28% for on-costs.
Discussion
The PerCEN study hypothesised that both PCC and PCE would improve resident quality of life, agitation, care interaction quality and emotional responses to care and that PCC+PCE would produce even better outcomes, compared with non-intervention groups. The small significant reduction in resident agitation with PCC and PCE interventions was paradoxically not seen in the PCC+PCE intervention, even though resident quality of life improved to different degrees with all three interventions. Despite these improvements, care interaction quality and a corresponding improvement in the residents’ emotional responses to care occurred only with PCC+PCE. It is possible that the study limitations had a bearing on these paradoxical study findings, such as: an inability to mask intervention site staff and managers to the interventions; the inability to control for facility-initiated improvements occurring in the non-intervention homes throughout the study; losing a substantial number of participating residents at follow-up; and the inability to compare participant and non-participant scores because not all available residents/proxies gave consent to join the study.
There were also severe limitations to the extent to which the planned interventions could be implemented within the time frame of the study. The mean PCC dose (compliance with the intervention) scores were 54 (SD 20) out of a possible score of 100 at post and 59 (SD 17) at follow-up, while for PCC+PCE homes these scores were 62 (SD 13) at post and 66 (SD 9) at follow-up. The PCE intervention was implemented by only 47% of PCE alone homes at post and 54% at follow-up and by only 14% and 27% respectively for PCC+PCE homes.
Although PCC training was standardised, PCC was implemented to varying degrees in most PCC alone homes because some care managers restricted the staff's opportunities to facilitate needed change. For example, in adequate time was allocated when the champions planned meetings with the staff to identify how they could pay greater attention to the residents’ preferred schedules and needs and to discuss these needed changes at staff handover sessions. On occasions the managers discounted the staff's agreed changes in care, offering arguments that essentially focused more on organisational efficiency than on resident comfort and pleasure. Some of the champions also found it difficult to influence the dominance of task-oriented care that was occurring, especially when their managers did not provide them with the authority to facilitate changes to this culturally entrenched care practice. Where PCC was able to be implemented as planned there was strong management support for the champions and encouragement of flexible work practices and staff involvement in decisions regarding resident care.
In some homes staff did not make the best use of the environment changes, such as enabling residents to freely explore a newly constructed garden, or moving furniture to allow small groups of residents to interact and engage with shared interests. Managers were not always willing to make the recommended PCE changes because of the perceived negative impact on revenue generation, wishing to adhere to corporate design and colour scheme requirements and holding alternative views on features of the environment that would interest the residents. Delays in gaining permission to carry out the recommended PCE changes and difficulties in getting tradesmen on-site within the time limits imposed by the study design, reduced the time in which the PCE interventions that were implemented could have an effect. To address these concerns a further follow-up analysis is planned to measure the dose and duration effect in homes where PCE was implemented.
Another possible explanation for anomalies in resident agitation and quality of life scores is that the changes in the EAT(environment) total change scores between pre-intervention and follow-up ranged from -8 to 29, suggesting that the physical environment was subject to substantial change in all facilities over the study period. As Table 4 shows some of the largest changes occurred in PCC alone and non-intervention groups, indicating that even under normal conditions the physical environment can change substantially over a 14 month period. It is likely that these facility-initiated changes influenced the study outcomes, since differences in structures and processes of care can influence quality of life outcomes (Brooker, Reference Brooker2004). These changes were unable to be controlled by the researchers and were brought about by care staff simply locking, or opening, a door to the garden, making an existing kitchen accessible and increasing, or decreasing, levels of auditory or visual stimulation in the home. Future investigation of PCE in this setting will require making detailed observations of how the care staff can manipulate the environment to assist, or hinder, the resident's access and exposure to environmental changes.
The lack of a strong association between PCE and quality of life (Smith et al., Reference Smith2005) may have been due to reported difficulties in measurement of quality of life, especially by self-report (Ott and Fogel, Reference Ott and Fogel1992; Beer et al., Reference Beer2010). Other studies have identified that quality of life measurement and the concepts that identify well-being in dementia (Kitwood and Bredin, Reference Kitwood and Bredin1992) are not clearly articulated or easily measured by proxies or by the person themselves. Proxy ratings generally underestimate quality of life compared with self-rating (Hounsome et al., Reference Hounsome, Orrell and Edwards2011). Measurement of depression in dementia was similarly difficult to rate for residents and their proxies, who tended to under-estimate the presence and degree of depression. This might explain why there were non-detectable changes in proxy-rated depression scores for the study sample as a whole.
Even though the homes randomised to PCE had some room for improvement in relation to the care environment and care services, baseline agitation (CMAI) (Cohen-Mansfield, Reference Cohen-Mansfield1999) scores were high in both the PCE and the PCC groups, compared with the PCC+PCE group and the non-intervention group. Contrary to studies showing reductions in agitation being associated with environmental improvements (Davis et al., Reference Davis, Byers, Nay and Koch2009; Fleming and Purandare, Reference Fleming and Purandare2010), the 27% of residents exposed to environmental improvements in PCC+PCE homes had no significant improvements in their mean level of agitation. Nevertheless, there were significant reductions in agitation for residents in some PCE only homes where 54% were exposed to intervention. Differences in findings cannot be explained by difficulties in measuring agitation, as the CMAI (Cohen-Mansfield, Reference Cohen-Mansfield1999) has proven to be sensitive to change in many studies, including in our previous study (Chenoweth et al., Reference Chenoweth2009). An explanation for the anomaly in these findings could be the relationship between CMAI scores and the changes in the EAT (Fleming, Reference Fleming2011) scores that occurred irrespective of the PCE intervention.
Despite these inconsistent findings and the study limitations, the study had manystrengths. This is the first study to rigorously test the effect of environmental alterations that were designed to the requirements of aged care homes and residents with moderate to severe dementia. The follow-up period was long, the numbers of participants were sufficient to undertake longitudinal data analyses, data sets were detailed and complete, and outcomes included self-reported depression and quality of life data. These data will add to the small but growing international repository of self-reports of depression and quality of life for people with advanced dementia.
Conclusion
The PerCEN study showed reduced agitation in people with advanced dementia living in aged care homes which instituted PCC and PCE, even though this improvement was not significant for all residents exposed to PCE. There were significant and non-significant improvements in resident quality of life with PCC and PCE respectively. While the PCC+PCE intervention produced significant improvements the quality of care interactions and resident care responses, there were no corresponding significant improvements in resident agitation and quality of life. None of the interventions improved resident depression scores. These mixed findings suggest that there is a need for future research to examine different methods for: assessing clinically-relevant quality of life, well-being and depression in people with advanced dementia living in aged care facilities; controlling facility-initiated changes during study trials; implementing PCE in aged care homes; instructing care staff how to help people with dementia engage with PCE; and evaluating PCE benefits for aged care residents and staff. Future efforts to investigate the therapeutic effects of PCE and PCC+PCE in aged care homes should take into consideration the time and financial resources required to plan, implement and evaluate such changes.
Conflict of interest
None.
Description of authors’ roles
LC: Conceptualised the study design and methodology with IF and RF; prepared and submitted the study grant application; obtained funding and research ethics approval for the study; provided oversight of the study; took responsibility for budget management and report submissions; provided leadership with JS-P for the PCC method; assisted J S-P and H-H J with designing the participant interview tools and PCC dose and duration scores; assisted with analysing the PCC dose and duration scores; and analysed the staff and other qualitative data; wrote the first draft and reviewed all subsequent drafts of the paper; and edited and submitted the final paper. IF: Conceptualised the study design and methodology with RF and LC; contributed to the study grant application; provided leadership with RF for the PCE method; provided oversight for the PCE changes; assisted RF with designing the PCE dose and duration scores; analysed the PCE dose and duration data; and reviewed all drafts of the paper. RF: Conceptualised the study design and methodology with LC and IF; contributed to the study grant application; provided leadership with IF for the PCE method; assisted IF with designing the PCE dose and duration scores; analysed the PCE dose and duration data; gave supervision in the EAT assessments and data analyses; and reviewed all drafts of the paper. MK: Gave expert advice on the study design, measures, and statistical methods; contributed to the study grant application; provided expert advice in data analyses and interpretation of the study results; and reviewed all drafts of the paper. JS-P: Provided leadership with LC for the PCC method; assisted with designing the participant interview tools and the PCC dose and duration scores; assisted with analysing the PCC dose and duration scores and the qualitative data; and reviewed all drafts of the paper. GL: Gave expert advice on the study design, measures, and statistical methods; undertook the first-level statistical tests on the data and assisted with interpretation of the study results; and reviewed all drafts of the paper. PK: Provided expert advice and conducted a range of the statistical tests with the data; assisted with interpretation of the study results; and reviewed all drafts of the paper. Y-H J: Assisted with designing the participant interview tools and the PCC dose and duration scores; assisted with analysing the PCC dose and duration scores; provided leadership for and assisted with the qualitative data analyses; and reviewed all drafts of the paper. MH: Gave expert advice on the study design and data required for the cost analysis; undertook the costs analysis; and reviewed all subsequent drafts of the paper. HB: Gave expert advice on the study design, measures, and statistical methods; gave expert advice in data analyses and interpretation of the study results; and reviewed all drafts of the paper.
Acknowledgments
The authors acknowledge and appreciate the expert advice of the Associate Investigators and their contribution to the study: Professor Victoria Traynor, University of Wollongong, Australia; Dr. Laurel Hixon, University of Oxford, United Kingdom; and Professor Shankar Sankarin, University of Technology, Sydney, Australia.
The willing participation of the 38 residential aged care facilities executive, managers and staff is greatly appreciated, as is the generosity of the residents and their associated families.