1. Introduction
Despite the rapid growth of other types of social media, Internet discussion forums remain a highly popular communication and knowledge exchange channel. It is common to see discussion forums dedicated to several specific domains, such as art and artists, sports, collectible items, cars, electronic devices, operating systems, and programming languages, to name only a few of the most typical examples. They usually contain richer, deeper, and longer discussions than microblogging services, such as Twitter or Facebook. Unlike regular blogs, they include posts from numerous authors with vastly varying levels of activity, writing styles, and skills, as well as proficiency in the area to which the forum is devoted. This makes discussion forum posts both an interesting and challenging source of data for text mining (Marra, Moore, and Klimczak Reference Marra, Moore and Klimczak2004; Lui, Li, and Choy Reference Lui, Li and Choy2007; Feldman et al. Reference Feldman, Fresko, Goldenberg, Netzer and Ungar2008; Kramer Reference Kramer2010; Li and Wu Reference Li and Wu2010; Said and Wanas Reference Said and Wanas2011; Holtz, Kronberger, and Wagner Reference Holtz, Kronberger and Wagner2012; Hoogeveen et al. Reference Hoogeveen, Wang, Baldwin and Verspoor2018).
1.1 Motivation
Internet discussion forum mining can be useful for analyzing user interests and sentiments, particularly associated with topics of long-term, persisting involvement and areas of specialized knowledge or experience. Discovering and characterizing such topics and areas by text mining algorithms can serve various applications specific to the domains of particular forums. Some obvious examples include:
mining forums devoted to certain types of products (e.g., cars, smartphones) to discover requested features, usage patterns, common complaints, recommended products, solutions to typical problems, etc.,
mining forums devoted to certain types of hobbies (e.g., cycling, photography) to discover associated equipment needs, interest differences between beginner and advanced users, etc.,
mining forums devoted to certain actually or potentially illegal activities (e.g., soccer hooliganism, racist violence, street racing, drug production, and distribution or use) to discover the risk and types of possible illegal behavior, etc.
To make such applications possible, appropriate algorithms for various underlying text mining tasks are necessary, capable of producing good results despite all possible data imperfections inherent for discussion forums. This work focuses on the anomaly detection task: identifying outlying posts, most dissimilar to the previously observed typical posts, that can carry surprising or suspicious content, as well as indicate emerging new topics and areas of interest. While there are relatively few examples of anomaly detection being applied to text data (Kramer Reference Kramer2010; Dai Reference Dai2013; Kannan et al. Reference Kannan, Woo, Aggarwal and Park2017; Bakarov, Yadrintsev, and Sochenkov Reference Bakarov, Yadrintsev and Sochenkov2018), there is a huge amount of prior work on text classification (Yang and Pedersen Reference Yang and Pedersen1997; McCallum and Nigam Reference McCallum and Nigam1998; Joachims Reference Joachims1998; Forman Reference Forman2003; Hassan, Mihalcea, and Banea Reference Hassan, Mihalcea and Banea2007; Aggarwal and Zhai Reference Aggarwal and Zhai2012a; Dařena and Žižka Reference Dařena and Žižka2017; Rousseau, Kiagias, and Vazirgiannis Reference Rousseau, Kiagias and Vazirgiannis2015) and text clustering (Dhillon and Modha Reference Dhillon and Modha2001; Manning, Raghavan, and Schütze Reference Manning, Raghavan and Schütze2008; Aggarwal and Zhai 2012b; Balabantaray, Sarma, and Jha Reference Balabantaray, Sarma and Jha2013), to which it is closely related.
1.2 Novelty
This article is supposed to extend the current state of knowledge by adding some noteworthy novel contributions, summarized below.
1. Besides the most common bag of words text representation, a recent more refined Global Vectors (GloVe) representation (Pennington, Socher, and Manning Reference Pennington, Socher and Manning2014) based on word embeddings is employed which makes it easy to control the dimensionality and apply arbitrary general-purpose classification and clustering algorithms. While text representations based on word embeddings are becoming popular (Goldberg and Levy Reference Goldberg and Levy2014; Lau and Baldwin Reference Lau and Baldwin2016; Bakarov Reference Bakarov2018), there have been only few demonstrations of their utility for anomaly detection (Bertero et al. Reference Bertero, Roy, Sauvanaud and Trédan2017; Pande and Ahuja Reference Pande and Ahuja2017; Bakarov et al. Reference Bakarov2018), using word2vec (Mikolov et al. Reference Mikolov, Chen, Corrado and Dean2013a) rather than GloVe embeddings.
2. The applied anomaly detection techniques based on one-class SVM and k-medoids cluster dissimilarity are probably for the first time combined with the GloVe representation, applied to text data, and compared to their counterparts using the bag of words representation. Prior work using word2vec for anomaly detection (Bertero et al. Reference Bertero, Roy, Sauvanaud and Trédan2017; Pande and Ahuja Reference Pande and Ahuja2017; Bakarov et al. Reference Bakarov2018) did not combine it with clustering-based detection methods and did not include comparisons with bag of words.
3. Unlike in most prior work on anomaly detection using word embeddings (Bertero et al. Reference Bertero, Roy, Sauvanaud and Trédan2017; Bakarov et al. Reference Bakarov2018), large datasets are used (tens of thousands rather than hundreds) to better match the scale of realistic applications.
4. Unlike in most prior work on clustering-based anomaly detection (He et al. Reference He, Xu and Deng2003; Al-Zoubi Reference Al-Zoubi2009; Gao Reference Gao2009; Amer and Goldstein Reference Amer and Goldstein2012), the cluster dissimilarity approach is applied as a modeling algorithm, that is, with an anomaly detection model created on the training set and applicable to new data.
5. New cluster dissimilarity-based anomaly score definitions are proposed that may be promising alternatives to those known from the literature (He et al. Reference He, Xu and Deng2003; Amer and Goldstein Reference Amer and Goldstein2012).
6. One of the discussion forums used for this work is in Polish, which has not been the subject of so many text mining studies and which makes some of text preprocessing operations more complex than for English text.
7. The discussion forums used for this work are devoted to psychoactive substances received from home-grown plants, such as hashish or marijuana. This might permit applying some of the obtained results to monitoring the risk of drug-related crime.
1.3 Article overview
Background knowledge on the anomaly detection task as well as the related text classification and clustering tasks is summarized in Section 2. Section 3 presents the two text representations used in this article, the simple and common bag of words representation and the more refined GloVe representation. Two unsupervised anomaly detection techniques, based on one-class SVM and on cluster dissimilarity, are described in Section 4. Section 5 presents experimental results that evaluate the utility of the bag of words and GloVe representations for anomaly detection using the one-class SVM and cluster dissimilarity approaches. Section 6 concludes the article by summarizing its contributions and discussing their potential practical utility as well as possible future work directions.
1.4 Datasets
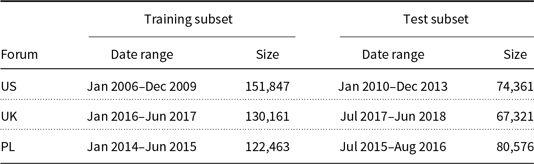
The experimental demonstrations presented in this article use posts retrieved from three discussion forums devoted to psychoactive substances received from home-grown plants, such as hashish or marijuana. These are one American forum, one British forum, and one Polish forum, further referred to as the US, UK, and PL forums. The collections of posts from each the three forums are partitioned into disjoint training and test subsets as presented in Table 1. The date ranges used for particular forums differ, as each of them exhibits different historical publication intensity, but the numbers of training and test posts are comparable and sufficiently large for reliable evaluation. Using a date-based split into training and test subsets rather than a random-split k-fold cross-validation is justified by the data size on one hand and mimicking realistic application conditions, where an anomaly detection model trained on historical data would be applied to new data, on the other hand.
Training and test subsets for the discussion forums

2. Background
Anomaly detection consists in identifying abnormal instances in data. It can be therefore considered a variation of binary classification. This article, however, studies the unsupervised variant of the task, in which no normal/anomalous labels are available, and detection has to be based on outlyingness or dissimilarity to all or most instances, assumed to be normal. Using discussion forum posts as the application domain makes it additionally related to text classification and text clustering.
2.1 Unsupervised anomaly detection
The essential objective of anomaly detection is to create a model capable of discovering untypical instances – highly dissimilar to all or most of those observed in the past. Such untypical instances are reported as possible anomalies, indicating some abnormal situations that may need attention (Chandola, Banerjee, and Kumar Reference Chandola, Banerjee and Kumar2009; Auslander, Gupta, and Aha Reference Auslander, Gupta and Aha2011; Goldstein and Uchida Reference Goldstein and Uchida2014, Reference Goldstein and Uchida2016). These could be bank frauds, computer system intrusions, device failures, health problems, etc. This is closely related to novelty detection performed using similar methods in a slightly different scenario in which detected untypical instances are considered indications of insufficient representativeness of the training set or changes in the domain, reducing the reliability of previously created predictive models (Pimentel et al. Reference Pimentel, Clifton, Clifton and Tarassenko2014). These may need adaptation or retraining, with novelties labeled by a human expert and used as additional training instances.
An anomaly detection model is created based on a training set assumed to contain exclusively or mostly normal and typical instances, with any abnormal or untypical instances sparse and with no labels available providing the true status of particular instances. The model created on the training set can be then applied to arbitrary data from the same domain to identify anomalies. This can be referred to as modeling unsupervised anomaly detection, as opposed to both non-modeling unsupervised anomaly detection and supervised anomaly detection. The former identifies outlying instances in a dataset without creating a model applicable to new data and appears to dominate in prior work on unsupervised anomaly detection. The latter is essentially a variant of the binary classification task, using training data with provided true status labels. The modeling unsupervised anomaly detection setting of the anomaly detection task adopted by this work is believed to be more interesting and have wider potential applicability than those alternatives.
Anomaly detection in text data definitely deserves more attention than it has received so far. Detecting untypical documents may provide interesting and useful signals, either related to suspicious or undesirable activities, or to arising new areas of interest and behavior patterns. This may be particularly useful for monitoring social media, including discussion forums. An anomaly detection model can be used to measure the intensity of publishing outlying posts and to select some of them for human review.
Prior related research mostly focused on techniques specifically dedicated to the text domain, for example, deriving attributes representing writing style (Guthrie et al. Reference Guthrie, Guthrie, Allison and Wilks2007), identifying semantic context (Mahapatra, Srivastava, and Srivastava Reference Mahapatra, Srivastava and Srivastava2012), using relational learning based on domain knowledge (Kumaraswamy, Wazalwar, and Khot Reference Kumaraswamy, Wazalwar and Khot2015), or nonstandard document-term matrix factorization (Kannan et al. Reference Kannan, Woo, Aggarwal and Park2017). This work revisits the less popular but more easily and widely applicable idea of applying general-purpose algorithms to text transformed to a vector representation (Manevitz and Yousef Reference Manevitz and Yousef2002). There is already some evidence that recent developments in word embeddings make this path more useful (Bertero et al. Reference Bertero, Roy, Sauvanaud and Trédan2017; Pande and Ahuja Reference Pande and Ahuja2017; Bakarov et al. Reference Bakarov2018).
2.2 Text classification
Text classification, also referred to as text categorization, consists in using a set of class-labeled documents from some domain, usually represented by a vector of attribute values derived from their textual contents, to create a model providing class predictions for arbitrary documents from the same domain (Sebastiani Reference Sebastiani2002). According to traditional machine learning terminology, the unknown true mapping of documents to classes is referred to as concept and can be considered a function  $c\,:\,X\to\mathcal{C}$
, where X denotes the domain and
 $\mathcal{C}$
is a finite set of classes (Cichosz Reference Cichosz2015). True classes are known for a subset of the domain
 $T\subset X$
called the training set. A model created based on the training set can be also considered a function
 $h\,:\,X\to\mathcal{C}$
, supposed to approximate the concept c. A probabilistic classification scenario is also often adopted in which the model is supposed to produce predictions of class probabilities rather than class labels.
2.2.1 Support vector machines
Support vector machines (SVM), which often belong to the most effective general-purpose classification algorithms, can be viewed as a considerably strengthened version of a basic linear-threshold classifier with the following enhancements (Cortes and Vapnik Reference Cortes and Vapnik1995; Platt 1998; Hamel Reference Hamel2009):
margin maximization: the location of the decision boundary (separating hyperplane) is optimized with respect to the classification margin,
soft margin: incorrectly separated instances are permitted,
kernel trick: complex nonlinear relationships can be represented by input space transformation using kernel functions.
Instead of binary linear-threshold SVM predictions, it may be often more convenient to use probabilistic predictions. This is possible by applying a logistic transformation to the signed distance of classified instances from the decision boundary, with parameters adjusted for maximum likelihood (Platt 2000).
A noteworthy property of SVM is the insensitivity of model quality to data dimensionality, which – unlike for many other algorithms – does not increase the risk of overfitting because model complexity is related to the number of instances close to the decision boundary rather than to the number of attributes. This is definitely a potential advantage in text classification applications, where high dimensionality is to be expected (Joachims Reference Joachims1998, Reference Joachims2002). With that being said, the SVM algorithm is not necessarily quick and easy to successfully apply, as it tends to be sensitive to parameter settings (in particular, the cost parameter, the kernel type, and kernel function parameters) and is computationally expensive for large datasets. Both the advantages and inconveniences of SVM are inherited by its one-class variant suitable for unsupervised anomaly detection that will be discussed in Section 4.
2.2.2 Random forests
The random forest algorithm is not a particularly popular choice for text classification, although some encouraging results have been reported (Rios and Zha Reference Rios and Zha2004; Koprinska et al. Reference Koprinska, Poon, Clark and Chan2007; Xue and Li Reference Xue and Li2015). It is also not directly applicable to unsupervised anomaly detection, although it has served as inspiration for the isolation forest algorithm applicable to this task (Liu, Ting, and Zhou Reference Liu, Ting and Zhou2012). The reason it is mentioned here is that it serves as an extremely useful comparison benchmark for evaluating the utility of the GloVe representation and verifying the parameter settings of the SVM algorithm. This is because it is known to usually yield nearly the best possible predictive quality with little or no risk of overfitting and very limited sensitivity to parameter settings.
A random forest (Breiman Reference Breiman2001) is an ensemble model represented by a set of unpruned decision trees (Breiman et al. Reference Breiman, Friedman, Olshen and Stone1984; Quinlan Reference Quinlan1986), grown based on multiple bootstrap samples drawn with replacement from the training set, with randomized split selection. Prediction is performed by simple unweighted voting of individual trees from the model, with vote distribution used to obtain class probability predictions. With sufficiently many diversified trees (typically hundreds), this simple voting mechanism usually makes random forests extremely accurate and resistant to overfitting.
2.2.3 Classification model evaluation
The most common classification quality measures such as the misclassification error or classification accuracy are not very useful whenever classes are unbalanced or likely to have different predictability. This is why a quality measure sensitive to misclassification distribution is required. In the experiments reported in this article, classification quality is visualized using ROC curves, presenting possible tradeoff points between the true-positive rate and the false-positive rate (Egan Reference Egan1975; Fawcett Reference Fawcett2006). The former is the share of instances of the positive class which are correctly predicted to be positive and the latter is the share of instances of the negative class which are incorrectly predicted to be positive. This is directly applicable to two-class classification, with one class considered positive and the other considered negative. The performance across all possible trade-offs can be summarized using the area under the ROC curve (AUC). The same method is also used for visualizing and summarizing the quality of anomaly detection, with anomalous instances considered positive and normal instances considered negative.
The AUC can be interpreted as the probability that a randomly chosen positive instance has a higher predicted probability of the positive class than a randomly chosen instance of a negative class. This clear interpretation is an additional benefit of the ROC analysis. Under severe class imbalance, however, with the vast majority of instances being negative, the false-positive rate will not decrease substantially even if a large share of positive class predictions is incorrect, because the number of false positives may be still small relative to the negative class count. This is why it may be reasonable to additionally consider the precision, which is the share of positive class predictions that are correct, and examine its trade-off with the recall, which is another term for the true-positive rate. The range of possible trade-offs is then visualized by precision-recall (P-R) curves and can be summarized by the area under the P-R curve (P-R AUC), even if it lacks the clean interpretation of the ROC AUC. This is another method of predictive performance evaluation applied in this article, both to classification and to anomaly detection models.
2.3 Text clustering
The clustering task consists in partitioning a dataset into similarity-based clusters and creating a model that can determine cluster membership for arbitrary new instances from the same domain (Hartigan Reference Hartigan1975; Everitt et al. Reference Everitt, Landau, Leese and Stahl2011). The partitioning is supposed to maximize intracluster similarity and intercluster dissimilarity. It can (but does not have to) be performed using an explicit dissimilarity measure. This is the case for the simplest and most common family of k-centers clustering algorithms.
2.3.1 Partitioning around medoids
Algorithms from the k-centers family share the following operation scheme (Anderberg Reference Anderberg1973; Jain and Dubes Reference Jain and Dubes1988):
1. the number of clusters is fixed and specified via the k parameter,
2. each cluster is represented by a single attribute value vector, called the cluster center,
3. clustering is performed by iteratively assigning instances to clusters with the closest (least dissimilar) centers and adjusting cluster centers based on assigned instances.
Particular algorithms differ primarily in the method of determining cluster centers. The most common k-means variation uses vectors of attribute means for this purpose (Lloyd Reference Lloyd1957; MacQueen Reference MacQueen1967). For this work, a more refined k-medoid approach is used, in which cluster centers are real training instances which minimize the total dissimilarity to cluster members. This has the advantage of increased robustness with respect to outliers and attribute relationships, as well preserving convergence guarantees regardless of the dissimilarity measure used. More specifically, the interpretation of k-medoids known as partitioning around medoids or PAM is employed (Kaufman and Rousseeuw Reference Kaufman and Rousseeuw1990).
Any of k-centers clustering algorithm can work with text data in a vector representation. To receive meaningful results, it is necessary, however, to use a dissimilarity measure appropriate for this representation (Aggarwal and Zhai 2012b). A popular and reasonable choice is the cosine dissimilarity, defined as 1’s complement of the cosine of the angle between the attribute value vectors.
One issue related to text clustering with dissimilarity-based clustering algorithms is the negative effect of high dimensionality on similarity patterns in the data. This phenomenon, referred to as the curse of dimensionality, consists in vanishing dissimilarity differences (the minimum and maximum dissimilarity approaching each other) with an increased number of dimensions (Zimek, Schubert, and Kriegel Reference Zimek, Schubert and Kriegel2012). The issue is particularly likely to arise when classifying text documents in the bag of words representation, with hundreds or more attributes.
2.3.2 Clustering model evaluation
The requirement of specifying the number of clusters may be sometimes inconvenient, but it is a common practice to use a clustering quality measure to guide the selection of k. Several such measures are described in the literature (Bezdek and Pal Reference Bezdek and Pal1998; Halkidi, Batistakis, and Vazirgiannis Reference Halkidi, Batistakis and Vazirgiannis2001; Arbelaitz et al. Reference Arbelaitz, Gurrutxaga, Muguerza, Pérez and Perona2013). For this work we adopt the silhouette width measure (Rousseeuw Reference Rousseeuw1987) which can be used to assess how well each instance fits within its cluster.
The silhouette width is a number from the  $[{-}1,1]$
interval, representing the normalized difference between the dissimilarity of an instance to the closest other cluster and its dissimilarity to its own cluster. Large values indicate instances that fit their clusters well and the average silhouette width for all instances can serve as the overall clustering quality measure.
The actually selected number of clusters may but does not always have to be the one maximizing the average silhouette width, since additional criteria can be applied (e.g., avoiding clustering with highly unbalanced clusters or with excessive differences of per-cluster silhouette width). Inspecting a visual representation of silhouette width for members of particular clusters in the form of a silhouette plot provides a quick insight into the size and homogeneity of clusters and can help to select the number of clusters.
3. Text representation
The first issue to be resolved when applying predictive modeling algorithms from the fields of machine learning and statistics to text data is transforming the analyzed document corpus into a representation that can be handled by these algorithms. This is usually a vector representation in which each document is assigned values of a fixed, common set of attributes (Dumais et al. Reference Dumais, Platt, Heckerman and Sahami1998; Aggarwal and Zhai Reference Aggarwal and Zhai2012a; Szymański Reference Szymański2014; Allahyari et al. Reference Allahyari, Pouriyeh, Assefi, Safaei, Trippe, Gutierrez and Kochut2017). A document is then represented by a vector of its attribute values, with the number of vector elements being the same for all documents. More complex nonvector representations are occasionally applied that may better preserve the semantic structure of the analyzed text (Rousseau et al. Reference Rousseau, Kiagias and Vazirgiannis2015), but they require dedicated model creation algorithms which are beyond the scope of this article. We will write  $\mathbf{a}(x)$
to refer to the vector of attribute values for instance x.
3.1 Bag of words
The simplest vector text representation that remains common in text mining applications is the bag of words (BoW) representation (McCallum and Nigam Reference McCallum and Nigam1998; Joachims Reference Joachims1998; Aggarwal and Zhai Reference Aggarwal and Zhai2012a; Szymański Reference Szymański2014), in which attributes directly correspond to words or, in a slightly more general setting, n-grams – word sequences of length n (usually  $n\leq 3$
). Words or n-grams used for this representation are called terms. All occurrences of the same term in a document are treated in the same way, regardless of their position and surrounding terms, which makes this representation perfectly order- and context-insensitive (apart from partial sensitivity resulting from using n-grams for
 $n>1$
). This clearly limits its capability of preserving semantic information, offering simplicity, ease of use, and direct attribute interpretability in return.
The BoW representation can be used in different variations, depending on how attributes corresponding to terms are exactly defined. The most common term frequency variation with single-word terms ( $n=1$
) is used for this work, with the value of attribute
 $a_t(x)$
for term t and document x defined as
 \begin{equation} a_t(x) = \textrm{TF}_t(x)\end{equation}
where  $\textrm{TF}_t(x)$
is the number of occurrences of term t in document x. The matrix of all such attribute values for a particular set of documents is referred to as the document-term matrix. While a modified TF-IDF variant, weighting terms based on their specificity represented by inverse document frequency, is useful for some applications (Manning et al. Reference Manning, Raghavan and Schütze2008), it did not bring any improvements for text classification algorithms used in this work. It is essential to ensure that the set of attributes of the bag of words representation is fixed and common for all documents. This can be achieved by using a fixed common vocabulary.
The order- and context-insensitivity of the bag of words representation are likely to cause loss of semantic information contained in analyzed documents. This is only partially improved by using n-grams for  $n>1$
, which may cause other problems: occurrence frequencies for 2-grams or 3-grams often become extremely small and most of them occur only in few documents, whereas the total number of them may be very large, resulting in a very high-dimensional and extremely sparse representation. Despite its limitations, the BoW representation remains effective in many applications, in which raw term occurrence statistics constitute a sufficient description of text content. Attribute values are simple and efficient to calculate, although using them may be not always so efficient unless some form of dimensionality reduction is applied. The dimensionality of the bag of words representation is typically between several hundred and several thousand (or more if n-grams with
 $n>1$
are used).
3.2 Global vectors
Limitations of the bag of words representation can be overcome by more refined context-sensitive approaches. These include representations based on word embeddings, such as word2vec (Mikolov et al. Reference Mikolov, Chen, Corrado and Dean2013a), which is obtained by training a two-layer neural network to associate words with their occurrence contexts. This produces word vectors (vector representations of words), but a related doc2vec algorithm can be used to obtain document vectors as well (Le and Mikolov Reference Le and Mikolov2014). There are some recent encouraging results with anomaly detection using the word2vec representation (Bertero et al. Reference Bertero, Roy, Sauvanaud and Trédan2017; Pande and Ahuja Reference Pande and Ahuja2017; Bakarov et al. Reference Bakarov2018). A related embedding-based data representation was also proposed for anomaly detection in a series of categorical events (Chen et al. Reference Chen, Tang, Sun, Chen and Zhang2016).
This article uses another representation based on word embeddings, known as Global Vectors or GloVe (Pennington et al. Reference Pennington, Socher and Manning2014). It can be considered a simpler and potentially more efficient alternative to word2vec that achieves similar effects using a different approach, based on term cooccurrence statistics. In the experiments reported by Pennington et al. (Reference Pennington, Socher and Manning2014), it outperformed word2vec with respect to both accuracy and computational expense in several word analogy and similarity tasks. It is also easier to apply due to a smaller number of adjustable parameters and less sensitivity to the exact parameter setup.
The algorithm uses a text corpus to create a cooccurrence matrix  $\Gamma$
such that
 $\Gamma[t,\kappa]$
is the frequency of term t appearing in the context of term
 $\kappa$
, for some pre-established context window size. The matrix can be used to estimate the occurrence probability of term t in the context of term
 $\kappa$
as follows:
 \begin{equation} P(t|\kappa) = \frac{\Gamma[t,\kappa]}{\sum_{t^{\prime}}\Gamma[t^{\prime},\kappa]}\end{equation}
The matrix is then factorized using stochastic gradient descent to determine term vectors such that the dot product of vectors for any two terms t and  $\kappa$
approximates
 $\log P(t|\kappa)$
. The dimensionality of this representation can be freely controlled and is typically orders of magnitude less than the dimensionality of the bag of words representation.
More precisely, the GloVe algorithm assigns two vectors to each term t: the word vector  $\mathbf{w}_t$
and the context vector
 $\tilde{\mathbf{w}}_t$
, such that the dot product
 $\mathbf{w}_t\bullet\tilde{\mathbf{w}}_{\kappa}$
approximates
 $\log P(t|\kappa)$
, or equivalently:
 \begin{equation} \mathbf{w}_t\bullet\tilde{\mathbf{w}}_{\kappa} + b_t + \tilde{b}_{\kappa} \approx \log\Gamma[t,\kappa]\end{equation}
where  $b_t$
and
 $\tilde{b}_{\kappa}$
are bias terms for
 $\mathbf{w}_t$
and
 $\tilde{\mathbf{w}}_{\kappa}$
, respectively. Word and context vectors are estimated using the Adagrad algorithm (Duchi, Hazan, and Singer Reference Duchi, Hazan and Singer2011), which is a variant of stochastic gradient descent with step-size adaptation, applied to the following weighted least squares objective:
 \begin{equation} \sum_{t_1.t_2}f(\Gamma[t_1,t_2]) \big(\mathbf{w}_{t_1}\bullet\tilde{\mathbf{w}}_{t_2}+b_{t_1}+\tilde{b}_{t_2} -\log\Gamma[t_1,t_2]\big)^2\end{equation}
The weighting function f, supposed to assign higher weights to more frequent term co-occurrences (but without overweighting the most frequent ones), is defined as:
 \begin{equation} f(v) = \begin{cases} (v/v_{\max})^{\alpha} & \text{if $v<v_{\max}$}\\[4pt] 1 & \text{otherwise} \end{cases}\end{equation}
where  $v_{\max}$
is the cutoff value for cooccurrence counts and the
 $\alpha$
exponent controls the sensitivity of weights to increased cooccurrence counts.
It can be easily seen that the GloVe representation captures some semantic information based on word context. Indeed, the logarithm of the occurrence probability ratio of two terms  $t_1$
and
 $t_2$
in the context of the same term
 $\kappa$
, which can be considered a measure of their semantic divergence:
 \begin{equation} \log\frac{P(t_1|\kappa)}{P(t_2|\kappa)} = \log P(t_1|\kappa) - \log P(t_2|\kappa)\end{equation}
is proportional to  ${(\mathbf{w}_{t_{1}}-\mathbf{w}_{t_{2}})\bullet\tilde{\mathbf{w}}_{\kappa}}$
.
For symmetric cooccurrence matrices word vectors  $\mathbf{w}$
and context vectors
 $\tilde{\mathbf{w}}$
should be roughly the same, with minor differences only due to different random initialization. This is the case for symmetric context windows, extending to both sides of the target term. Asymmetric context windows, extending only to the left, can work better for some specific applications, but more universal symmetric context windows are used for this work. Following the recommendation of Pennington et al. (Reference Pennington, Socher and Manning2014), the sums of word and context vectors are used as ultimate term vectors:
 \begin{equation} \mathbf{a}(t) = \mathbf{w}_t + \tilde{\mathbf{w}}_t\end{equation}
Word embeddings in general and GloVe in particular can be considered a potentially superior alternative to other vector text representations which achieve reduced dimensionality by transforming the bag of words document-term matrix. These include latent semantic analysis (Dumais Reference Dumais2005; Moldovan, Bot, and Wanka Reference Moldovan, Bot and Wanka2005; Kumar and Srinivas Reference Kumar and Srinivas2006) and latent Dirichlet allocation (Blei, Ng, and Jordan Reference Blei, Ng and Jordan2003). Word embedding methods are less computationally demanding and believed to be more effective in identifying semantic relationships than those earlier approaches (Mikolov, Le, and Sutskever Reference Mikolov, Le and Sutskever2013b).
Like word2vec (and unlike doc2vec), the GloVe representation produces word vectors rather than document vectors, which are actually needed to create document classification, clustering, or anomaly detection models. One simple and possibly imperfect approach to obtain GloVe document vectors is to perform weighted summation of word vectors for all terms occurring in the document, with term frequencies used as weights. The vector for document x would be then calculated as
 \begin{equation} \mathbf{a}(x) = \sum_{t\in x} \mathbf{a}(t) \textrm{TF}_t(x)\end{equation}
This solution, which can be considered a simple example of compositional semantics models (Mitchell and Lapata Reference Mitchell and Lapata2010; Yessenalina and Cardie Reference Yessenalina and Cardie2011), is adopted for this work.
4. Anomaly detection
Typical approaches to creating unsupervised anomaly detection models employ the following techniques:
one-class classification: detection based on predictions of a one-class classification model created using the training set,
neighbor dissimilarity: detection based on dissimilarity to the most similar training instances,
cluster dissimilarity: detection based on dissimilarity to the most similar cluster of a clustering model created using the training set.
Of those, the first and the third are used in this work, represented by the one-class SVM and PAM cluster dissimilarity algorithms, described below. The utility of neighbor dissimilarity-based algorithms, such as the local outlier factor algorithm (Breunig et al. Reference Breunig, Kriegel, Ng and Sander2000), for text anomaly detection may be worth investigating by future work, but they would make the detection process considerably more computationally intensive.
4.1 One-class SVM
One-class classification algorithms create classification models from unlabeled training instances, assuming that all or most of them belong to a single dominating class, and possibly few outlying instances have to be separated from this majority using the discrimination method adopted from standard binary or multiclass classification. The best known algorithm of this type is the one-class variation of support vector machines, referred to as one-class SVM or OC-SVM. Sharing the basic operation principle with standard SVM, it can be expected to offer similar advantages, including insensitivity to high-dimensional data and overcoming the linear separability limitation by the use of kernel functions.
The one-class SVM algorithm identifies a decision boundary that separates the majority of training instances lying close to one another from the rest of the space (Schölkopf et al. Reference Schölkopf, Platt, Shawe-Taylor, Smola and Williamson2001). The boundary is represented by a hyperplane maximally distant from the origin which separates most of training instances therefrom, with only a small set of outlying training instances left behind. The maximum share of outlying instances in the training set has to be specified via the  $\nu$
parameter. Then the OC-SVM decision boundary is obtained by solving the following quadratic programming problem:
minimize:
 \begin{equation} \frac{1}{2}\|\mathbf{w}\|^2 + \frac{1}{\nu|T|}\sum_x\xi_x-\rho \end{equation}
subject to:
 \begin{align} &\left(\forall x\in T\right) \;\;\; \mathbf{w}\bullet\mathbf{a}(x)\geq\rho-\xi_x\end{align}
 \begin{align} &\left(\forall x\in T\right) \;\;\; \xi_x\geq 0\qquad\qquad\ \ \end{align}
where  $\mathbf{w}$
and
 $\rho$
are model parameters and
 $\xi_x$
are slack variables for constraint relaxation.
Like for standard SVM, it can be transformed to a dual form, enabling the application of the kernel trick. Actually, only combined with a translation-invariant kernel function (such as the radial kernel) the principle of separating most of the training set from the origin of the space makes sense. In the transformed space with new attributes  $a_1^{\prime},a_2^{\prime},\dots$
we then have
 $\mathbf{a}^{\prime}(x)\bullet\mathbf{a}^{\prime}(x)=\textrm{const}$
, so instances can be seen as lying on a sphere centered in the origin. The separating hyperplane cuts off a segment of the sphere where most training instances are located.
One-class SVM predictions are signed distances from the decision boundary, positive on the “one-class” (normal) side and negative on the outlying side. The negated value of such signed distance can therefore serve as a simple anomaly score.
4.2 PAM cluster dissimilarity
The essential idea of clustering-based anomaly detection is that there is some inherent diversity of normal instances that can be adequately represented by a set of clusters, created based on the training set. Outlying instances would be then identified during prediction based on their dissimilarity to these clusters.
4.2.1 Model creation
The clustering model can be in general created using various clustering algorithms (Hartigan Reference Hartigan1975; Everitt et al. Reference Everitt, Landau, Leese and Stahl2011), but algorithms from the k-centers family (Anderberg Reference Anderberg1973; Jain and Dubes Reference Jain and Dubes1988) are the most common and convenient choice. With an explicit dissimilarity measure and simple model representation by cluster centers, they make it easy to identify the closest cluster for an arbitrary new instance and determine the dissimilarity between the instance and the cluster’s center. This permits adopting the modeling setting of the unsupervised anomaly detection task and calculating an anomaly score for new instances based on their dissimilarity to the closest cluster’s center.
While most of prior work used k-means clustering (Münz, Li, and Carle Reference Münz, Li and Carle2007; Jayasimhan and Gadge Reference Jayasimhan and Gadge2012), adopting the k-medoids or PAM algorithm for anomaly detection is particularly reasonable due to its robustness with respect to outliers and attribute relationships, as well as the capability of working with arbitrary dissimilarity measures (Syarif, Prugel-Bennett, and Wills Reference Syarif, Prugel-Bennett and Wills2012; Lei et al. Reference Lei, Zhu, Chen, Lin and Yang2012). The clustering model is created on the training set in the usual way. The number of clusters can be selected using a clustering quality measure, such as the silhouette width. This approach will be further referred to as PAM cluster dissimilarity or PAMCD.
4.2.2 Prediction
If the training set contains entirely or mostly normal instances, outlying instances can be identified during prediction in one or both of the following two ways:
as those for which their respective closest clusters are small and separated from most other clusters (and therefore likely to contain anomalous training instances),
as those highly dissimilar to their respective closest clusters (and therefore likely to be anomalous instances substantially different from training instances).
Which of these makes more sense depends on the presence and share of anomalous instances in the training set on one hand and on the properties and settings of the clustering algorithm on the other hand. The former could be useful if the training set contains sufficiently many anomalous instances to justify their own cluster or clusters, and the clustering algorithm is designed and configured to permit creating several small clusters to accommodate them. The latter would be preferred if the training set contains no or very few anomalous instances and the clustering algorithm is designed and configured to prefer creating larger and more balanced clusters, even at the cost of their reduced homogeneity. While this better matches the algorithm and experiment design adopted in this article, the anomaly scores described below combine the two prediction schemes.
4.2.3 Anomaly scores
During prediction for any instance x the closest cluster is determined as  $d_x=\arg\min_{d\in C}\delta(x,d)$
, where
 $\delta(x,d)$
is the dissimilarity between instance x and the medoid of cluster d, and C denotes the set of all clusters. It can hardly serve directly as an anomaly score, though, since particular clusters, corresponding to different regions of the domain, may differ in size and the level of homogeneity.
Probably the best known approach to anomaly score calculation based on cluster dissimilarity is the cluster-based local outlier factor or CBLOF (He et al. Reference He, Xu and Deng2003), which weights cluster dissimilarity by cluster size. It is defined as follows:
 \begin{equation} \pi^{\textrm{cblof}}_{\delta}(x) = \begin{cases} |T_{d_x}|\delta(x,d_x) & \text{if $d_x\in C_L$}\\[4pt] |T_{d_x}|\delta(x,d^{\prime}_x) & \text{if $d_x\in C_S$} \end{cases}\end{equation}
where the set of clusters C is partitioned into the subsets of large clusters  $C_L$
and small clusters
 $C_S$
,
 $d_x=\arg\min_{d\in C}\delta(x,d)$
is the closest cluster for instance x, and
 $d^{\prime}_x=\arg\min_{d\in C_L}\delta(x,d)$
is the closest large cluster for instance x. The partitioning into large and small clusters is controlled by adjustable parameters specifying the minimum share of training instances covered by large clusters (which could be set based on the expected share of normal instances in the training set) and the minimum ratio of the sizes of the smallest large cluster and the largest small cluster (typically a few or more). Small clusters may correspond to anomalous training instances, whereas large clusters can be safely assumed to represent normal training instances. When the closest cluster is a small one, the size of the closest cluster still serves as the weight, but the dissimilarity to the nearest large cluster is used instead. This is supposed to account for varying normal instance density, possibly resulting in clusters of substantially different sizes – with large clusters containing the majority of the data and small clusters several times smaller.
Another anomaly score has been also proposed and argued to be advantageous (Amer and Goldstein Reference Amer and Goldstein2012), which retains the partitioning into large and small clusters, but uses normalization by the average dissimilarity between cluster members and the cluster center instead of cluster size weighting. This is referred to as the local density cluster-based outlier factor (LDCOF):
 \begin{equation} \pi^{\textrm{ldcof}}_{\delta}(x) = \begin{cases} \dfrac{\delta(x,d_x)}{\sum_{x^{\prime}\in T_{d_x}}\delta(x^{\prime},d_x)/|T_{d_x}|} & \text{if $d_x\in C_L$}\\[14pt] \dfrac{\delta(x,d^{\prime}_x)}{\sum_{x^{\prime}\in T_{d^{\prime}_x}}\delta(x^{\prime},d^{\prime}_x)/|T_{d^{\prime}_x}|} & \text{if $d_x\in C_S$} \end{cases}\end{equation}
Both CBLOF and LDCOF were originally proposed and used for a nonmodeling unsupervised anomaly detection setting, where the task consists in identifying outlying instances in a given dataset rather than creating an anomaly detection model applicable to new data. This is why they assumed cluster membership assignment for all instances established during clustering, which (depending on the clustering algorithm) might not always be the same as the cluster with the closest center. The definitions presented above are actually reformulations of the original CBLOF and LDCOF definitions for the modeling scenario, based on identifying the closest cluster for each instance.
In addition to these two anomaly scores, three simple novel alternative scores are used in this work, which explore other possible methods of dissimilarity normalization. Assuming again that  $d_x=\arg\min_{d\in C}\delta(x,d)$
is the closest cluster for instance x, and
 $d^{\prime}_x=\arg\min_{d\in C_L}\delta(x,d)$
is the closest large cluster for instance x, their definitions are presented below.
LSCOF:local separation cluster-based outlier factor – it applies cluster size weighting like CBLOF, but additionally performs normalization by the cluster’s separation (the minimum dissimilarity between a training instance from this cluster and a training instance from another cluster) to make dissimilarity from highly separated clusters considered less indicative of anomalousness, since they may represent a low-density region:
(14) \begin{equation} \pi^{\textrm{lscof}}_{\delta}(x) = \begin{cases} |T_{d_x}|\dfrac{\delta(x,d_x)}{\min_{x_1\in T_{d_x},x_2\in T-T_{d_x}}\delta(x_1,x_2)} & \text{if $d_x\in C_L$}\\[14pt] |T_{d_x}|\dfrac{\delta(x,d^{\prime}_x)}{\min_{x_1\in T_{d^{\prime}_x},x_2\in T-T_{d^{\prime}_x}}\delta(x_1,x_2)} & \text{if $d_x\in C_S$} \end{cases} \end{equation}
LXCOF:local maXimum density cluster outlier factor – it is similar to LDCOF, but it uses the maximum rather than average dissimilarity between cluster members and the cluster center for normalization:
(15)
\begin{equation} \pi^{\textrm{lxcof}}_{\delta}(x) = \begin{cases} \dfrac{\delta(x,d_x)}{\max_{x^{\prime}\in T_{d_x}}\delta(x^{\prime},d_x)/|T_{d_x}|} & \text{if $d_x\in C_L$}\\[14pt] \dfrac{\delta(x,d^{\prime}_x)}{\max_{x^{\prime}\in T_{d^{\prime}_x}}\delta(x^{\prime},d^{\prime}_x)/|T_{d^{\prime}_x}|} & \text{if $d_x\in C_S$} \end{cases}\end{equation}
LICOF:local dIameter cluster-based outlier factor – it is similar to LSCOF, but it uses the closest cluster’s diameter (the maximum dissimilarity between two cluster members) rather than separation for normalization:
(16)
\begin{equation} \pi^{\textrm{licof}}_{\delta}(x) = \begin{cases} |T_{d_x}|\dfrac{\delta(x,d_x)}{\max_{x_1,x_2\in T_{d_x}}\delta(x_1,x_2)} & \text{if $d_x\in C_L$}\\[14pt] |T_{d_x}|\dfrac{\delta(x,d^{\prime}_x)}{\max_{x_1,x_2\in T_{d^{\prime}_x}}\delta(x_1,x_2)} & \text{if $d_x\in C_S$} \end{cases} \end{equation}


5. Experiments
This section presents computational experiments organized in two major studies:
text representation experiments: comparing the utility of the bag of words and GloVe representations for the text classification and text clustering tasks,
anomaly detection experiments: evaluating the quality of anomaly detection using the one-class SVM and PAM cluster dissimilarity algorithms.
5.1 Text representation experiments
To verify the text preprocessing setup and examine the utility of the bag of words and GloVe representations, they were both applied to the classification and clustering of forum posts.
5.1.1 Text preprocessing
The bag of words and GloVe document representations were created using the text2vec R package (Selivanov and Quing Reference Selivanov and Quing2018). The same text preprocessing was applied for each of the three decision forums to identify the vocabulary:
removing numbers,
converting to lowercase,
spelling correction and stemming using the Hunspell library via the hunspell R package interface (Oooms Reference Oooms2018) with the English and Polish LibreOffice dictionaries,
removing stop words,
filtering terms according to the following criteria:
— no less than 100 and no more than 10,000 occurrences in the training set,
— occurring in no less than
$0.2$
% and no more than 80% posts from the training set.

This produced vocabularies of 1613 words for the US forum, 1753 words for the UK forum, and 2155 words for the PL forum, out of hundreds thousands distinct tokens appearing in original unprocessed training posts. Only posts containing at least a single vocabulary term were left in the training and test sets, which reduced their size by about 4% for the US forum, 2% for the UK forum, and 3% for the PL forum. This is to avoid trivial anomalies entirely composed of nonvocabulary terms.
The Polish language poses some extra challenges to spelling correction due to the presence of diacritical characters in the alphabet. It is not uncommon to see posts with some or all of diacritics missing, which is likely to mislead spelling correction. Occasional occurrences of English words may be confused with misspelled Polish words. Dictionary-based stemming is also less reliable than for English due to much more complex inflection. More refined spell checkers and morphological analyzers dedicated to the Polish language, word sense disambiguation, as well as detecting foreign language terms and phrases, might improve the results substantially. Examining these possibilities of enhanced natural language processing is postponed for future work, though. Only one simple tweak was applied to improve the performance of Hunspell spelling correction – enforcing the preference for replacement words that only add missing diacritics.
The attributes of the BoW representation for the training and test sets were obtained as the corresponding term frequencies for all vocabulary terms. The word vectors of the GloVe representation were determined based on the term cooccurrence matrix for the training set, using the the same vocabulary, with the following parameter settings:
context window size: 5,
word vector dimensionality: 50,
weighting function cutoffv max: 10,
weighting function exponent α :
$\frac{3}{4}$
,maximum step size for stochastic gradient descent:
$0.1$
.


The training set word vectors were then used to obtain document vectors for the training and test sets by weighted summation according to Equation (8), using term frequencies for the training and test sets, respectively, as weights.
It is worthwhile to underline that “attribute definitions” for both the bag of words and GloVe representations (i.e., the vocabulary and word vectors) are entirely determined using the training set only and then applied to calculate attribute values for the training and test set. This guarantees there is no optimistic bias in subsequent model evaluation that could result from using the test set for any processing with impact on model creation.
5.1.2 Utility for classification
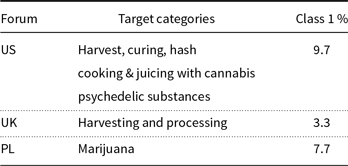
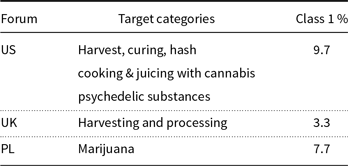
A binary classification task is considered, in which posts published in selected target categories are considered positive and labeled 1 and all other posts are considered negative and labeled 0. Out of top level forum categories, target categories presented in Table 2 were selected as potentially the most interesting due to possible associations with drug-related crime. As also shown in the table, the obtained classes are highly unbalanced, particularly for the UK forum.
Target categories and class distribution
The implementation of the SVM algorithm used for the experiments is provided by the e1071 R package (Meyer et al. Reference Meyer, Dimitriadou, Hornik, Weingessel and Leisch2018). The SVM parameters were set as follows based on preliminary runs:
the cost of constraint violation (cost): 1,
the kernel type (kernel):radial,
the kernel parameter (gamma): the reciprocal of the representation dimensionality,
class weights in constraint violation penalty (class.weights): 10 (the US and PL forums) or 20 (the UK forum) for class 1 (the minority class), 1 for class 0.
No extensive parameter tuning was performed, but to verify that the settings are at least reasonable, the random forest algorithm was used as a benchmark. This is also an opportunity to gather additional evidence related to the utility of the two text representations being evaluated. The implementation of the algorithm is provided by the randomForest R package (Liaw and Wiener Reference Liaw and Wiener2002), and it is used with the following parameter settings:
the number of trees (ntree): 500,
the number of attributes for split selection at each node (ntry): the square root of the total number of available attributes,
the stratified bootstrap sample size (sampsize): the number of instances of class 1 (the minority class).
Classification performance for the US forum.

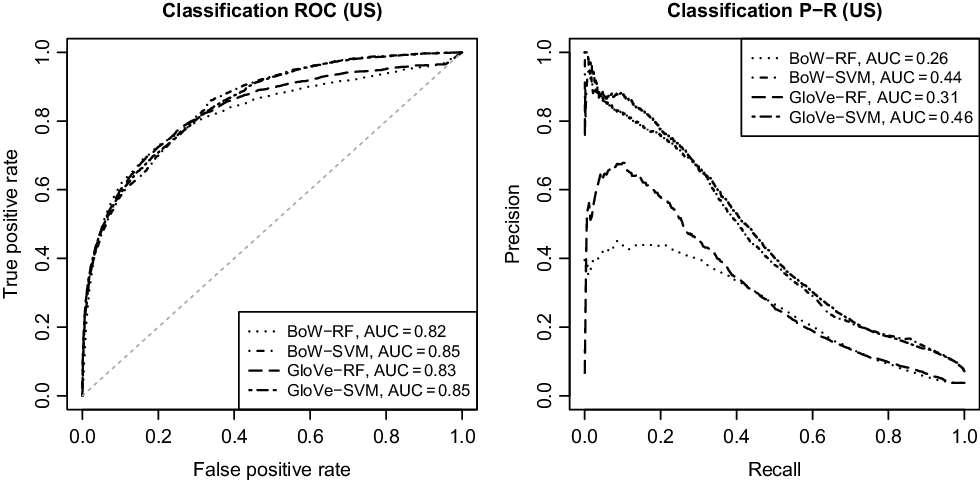
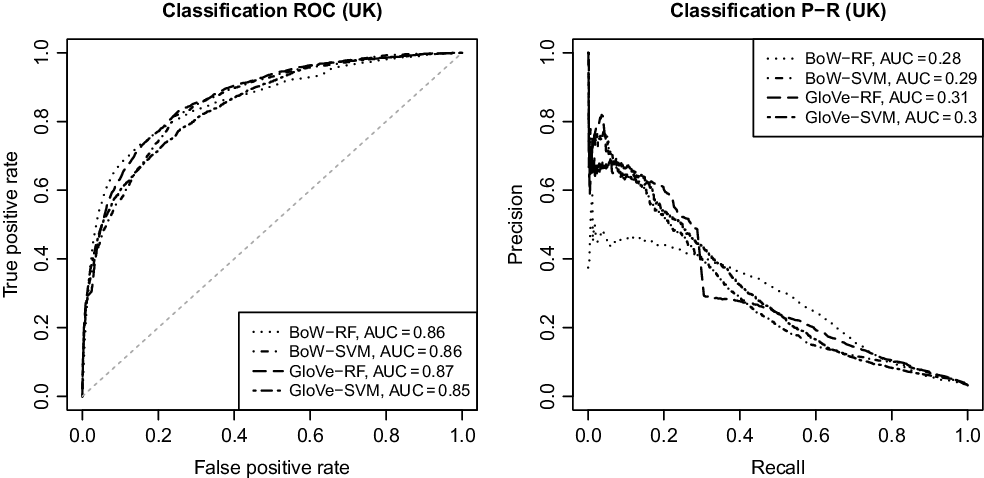
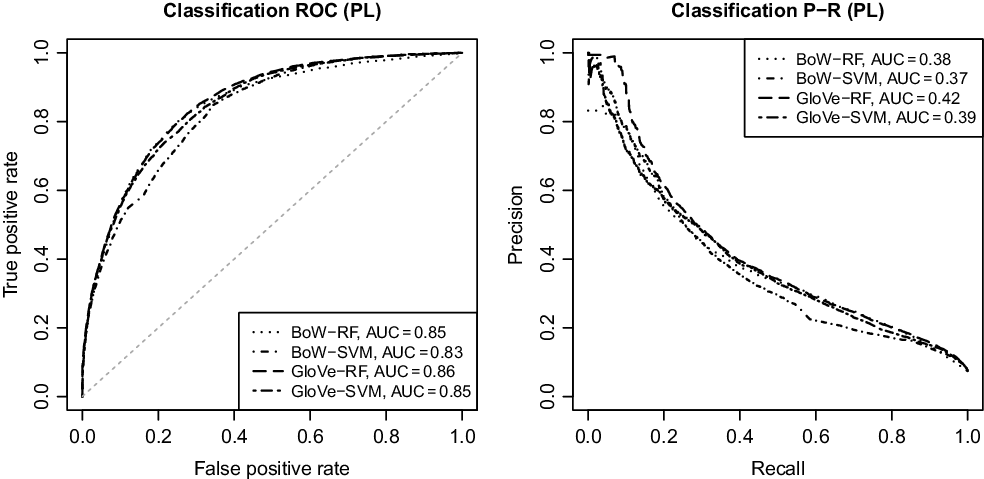
Probabilistic test set predictions of the obtained models were compared with true class labels to produce the ROC and P-R curves presented in Figures 1, 2, and 3. As we can see, the GloVe representation improves the predictive performance of the SVM and random forest algorithms in comparison to the bag of words representation. This is particularly noticeable for the US forum and is mainly reflected by the P-R curves, which are much more sensitive to changes in the number of false positives with highly unbalanced classes. The improvement is not very impressive, but may be sufficient to make a difference in a practical application. The prediction quality reached by SVM is the same as or better than that of the random forest algorithm, which confirms its settings are at least reasonable. It is particularly interesting to see how SVM outperforms random forest with respect to precision levels for the US forum.
No predictive performance loss with the 50-dimensional GloVe representation for the two algorithms confirms that it at least retains the predictive utility of the much higher-dimensional bag of words representation. With that being said, the models using bag of words still deliver high-quality predictions, which confirms that the SVM and random forest algorithms are resistant to high dimensionality. It is therefore noteworthy that GloVe can permit an improvement over the good baseline performance level.
Classification performance for the UK forum.

Classification performance for the PL forum.

While the experiments only investigate classification quality and not computational expense, it is worthwhile to mention that the GloVe representation reduced the overall computation time of model creation and evaluation in comparison to bag of words by a factor of more than 12 for SVM and more than 300 for random forest. This can be an important advantage in some applications.
5.1.3 Utility for clustering
The implementation of the PAM algorithm is provided by the cluster R package (Maechler et al. Reference Maechler, Rousseeuw, Struyf, Hubert and Hornik2018). The cosine dissimilarity, with the implementation provided by the proxy R package (Meyer and Buchta Reference Meyer and Buchta2018), was used for both the representations. To reduce the computational time and memory requirements associated with dissimilarity matrix calculation and storage, a 10% random sample of the training set was used for clustering model creation.
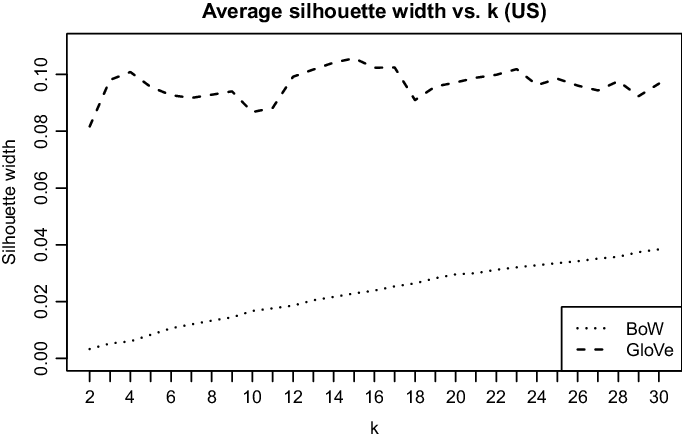
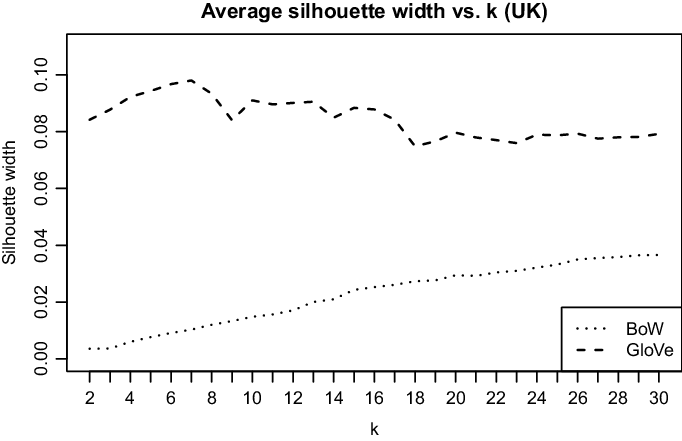
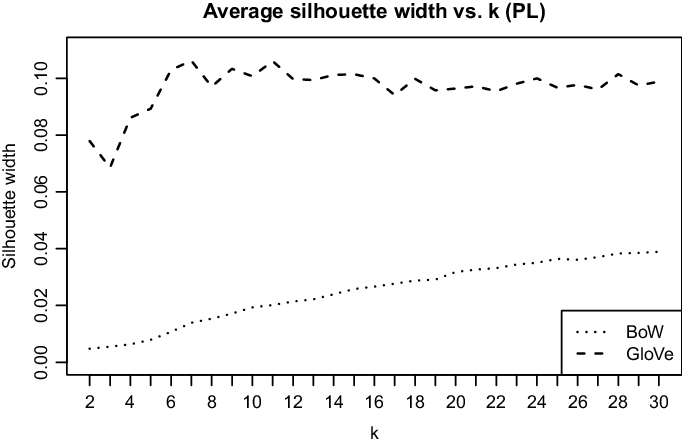
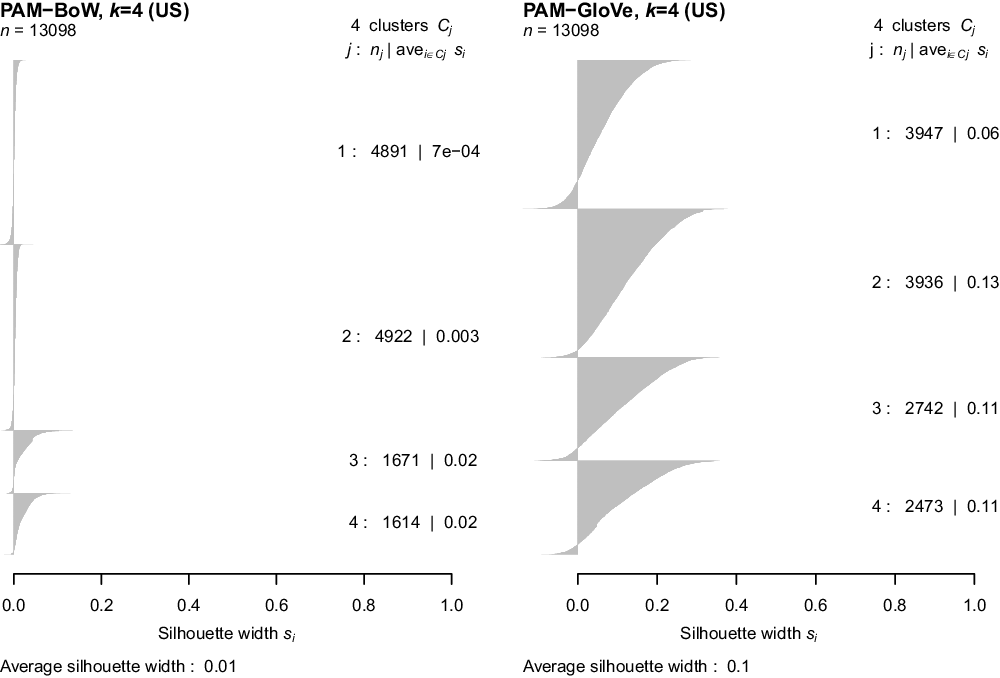
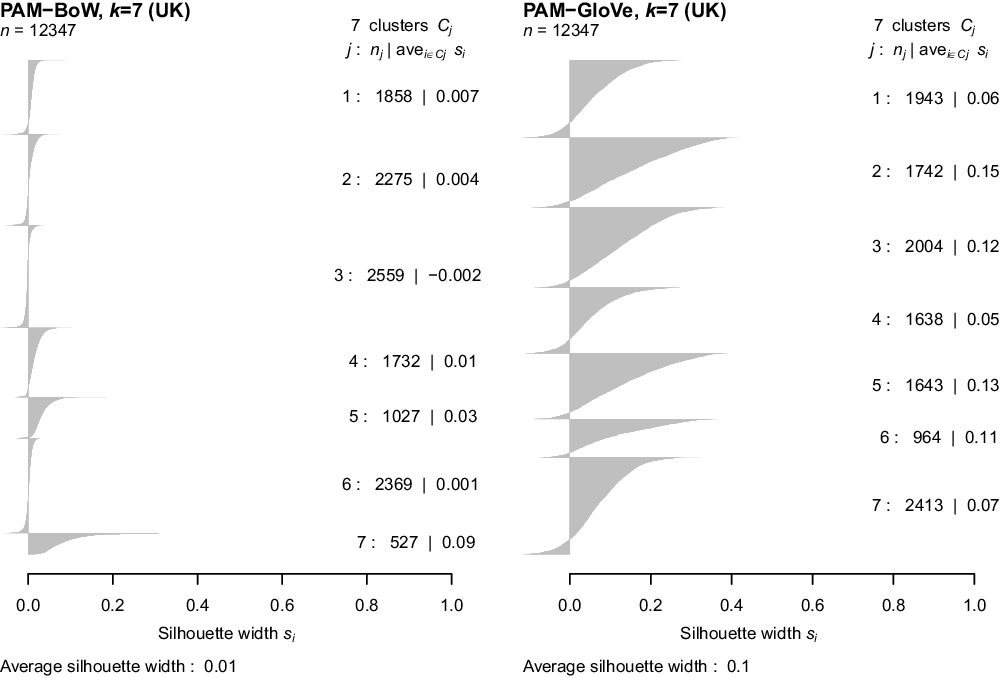
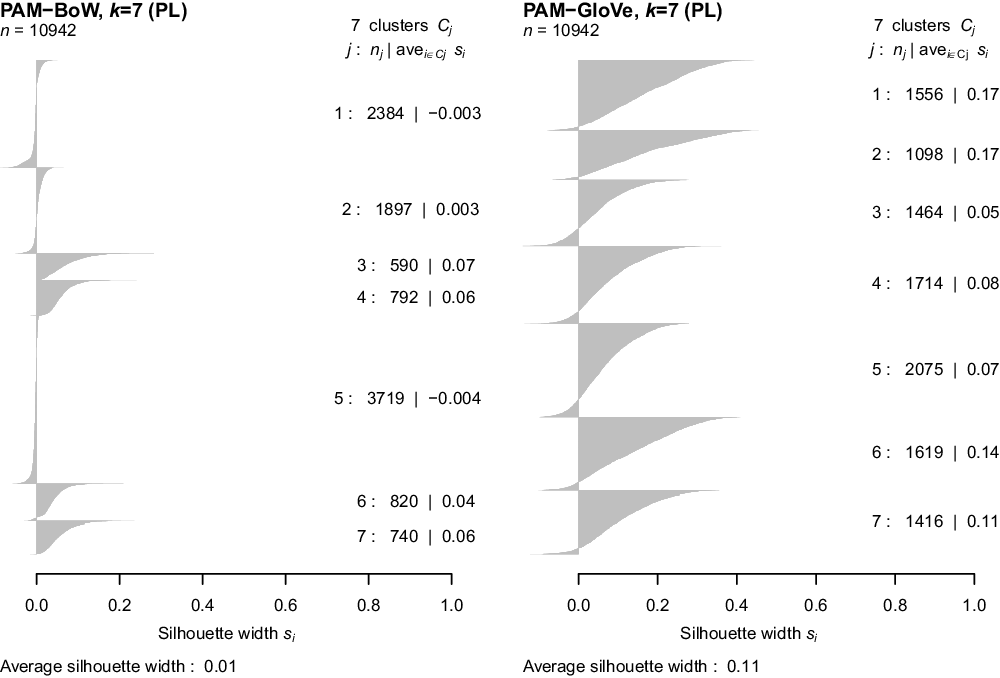
The average silhouette width values obtained using the two representations for k values in the range between 2 and 30 are displayed in Figures 4, 5, and 6. Clustering obtained using the bag of words representation turns out extremely poor regardless of the choice of k, although the average silhouette width monotonically increases with increasing k. Upon closer inspection, though, for  $k\geq 3$
there is always one or more clusters with near-zero or negative average silhouette width, which makes their superiority questionable. Therefore, rather than using
 $k=30$
, it appears more reasonable to set k to the same values as for clustering obtained using GloVe, assuming they better represent the “proper” number of clusters.
The average silhouette width for the US forum.

The average silhouette width for the UK forum.

The average silhouette width for the PL forum.

The silhouette plots for the US forum.

The superiority of the GloVe representation, with its much lower dimensionality, is striking, even if the average silhouette width of just about  $0.1$
still does not indicate a very good clustering. Unlike for bag of words, there is no monotonic average silhouette width increase with increasing k, but rather a mixed up and down pattern. The following heuristic was adopted to select k values for subsequent anomaly detection experiments:
if the maximum average silhouette width is achieved for
$k\leq 10$
: the k value maximizing the average silhouette width,otherwise: the smallest k for which the average silhouette width is within one standard deviation of the maximum average silhouette width.

This heuristic selects  $k=4$
for the US forum,
 $k=6$
for the UK forum, and
 $k=7$
for the PL forum.
Figures 7, 8, and 9 present silhouette plots obtained using the bag of words and GloVe representations with the k values selected above. It can be immediately seen that the results produced by the PAM algorithm using the GloVe representation are substantially superior to those produced using bag of words. The latter is likely to severely suffer from the curse of dimensionality, leading to diminishing similarity patterns. In particular, for the BoW representation each cluster has a very low level of intra-cluster similarity. The clustering models received using GloVe have well balanced and much better separated clusters, although their homogeneity can be still considered moderate at best. This may suggest there are no very strong and clear similarity patterns in the analyzed discussion forums, which is not unexpected. With that being said, the GloVe representation effectively overcomes or at least ameliorates the curse of dimensionality, making it possible to obtain a potentially useful clustering model.
The silhouette plots for the UK forum.

The silhouette plots for the PL forum.

Again, whereas the primary focus of the experiments is on clustering quality, it is noteworthy that the GloVe representation reduced the computational time needed for dissimilarity matrix calculation by a factor of 140 in comparison to bag of words. This is a huge computational saving that can be extremely desirable in some applications.
5.2 Anomaly detection experiments
The experiments with anomaly detection in discussion forum posts are performed using the following algorithm and text representation configurations:
one-class SVM with the bag of words representation,
one-class SVM with the GloVe representation,
PAM cluster dissimilarity with the bag of words representation,
PAM cluster dissimilarity with the GloVe representation.
For the PAM cluster dissimilarity configurations each of the five anomaly score definitions presented above were applied: CBLOF, LDCOF, LSCOF, LXCOF, and LICOF.
The same implementations of the SVM and PAM algorithms are employed that were previously used for classification and clustering demonstrations. The parameter setup of one-class SVM is the same as previously for standard SVM, except for the additional parameter  $\nu$
representing the maximum expected share of outlying instances in the training set, arbitrarily set to
 $0.1$
for the US and PL forums, and
 $0.05$
for the UK forum. To avoid excessive computational expense, a 10% random sample of the training set is used for PAM cluster dissimilarity, as in the previously presented clustering experiments. The k values selected before based on the average silhouette width are adopted for these experiments. Larger k were found to yield inferior anomaly detection performance in preliminary experiments. Since the clusterings for the GloVe representation are relatively balanced, all clusters are considered large for anomaly score calculation. For the bag of words representation the criteria for partitioning clusters into large and small were as recommended by He et al. (Reference He, Xu and Deng2003), that is, the minimum share of training instances covered by large clusters was set to
 $0.9$
and the minimum ratio of the sizes of the smallest large cluster and the largest small cluster was set to 5. Limited exploration of alternative settings in preliminary experiments did not reveal any improvement. Similarly, unweighted versions of the CBLOF, LSCOF, and LICOF anomaly scores (without cluster size weighting) were found not to perform any better than the original weighted versions.
Since no preassigned normal/anomalous labels for any subset of forum posts are available, predictive performance evaluation is performed using the following anomaly simulation scenario:
posts from the selected target categories presented in Table 2 (previously used to assign class 1 for classification experiments) are considered anomalous and posts from the other top-level forum categories are considered normal,
anomaly detection models are created on the training set with anomalous posts removed,
prediction quality is evaluated by comparing anomaly score values against true status for the test set containing both normal and anomalous posts.
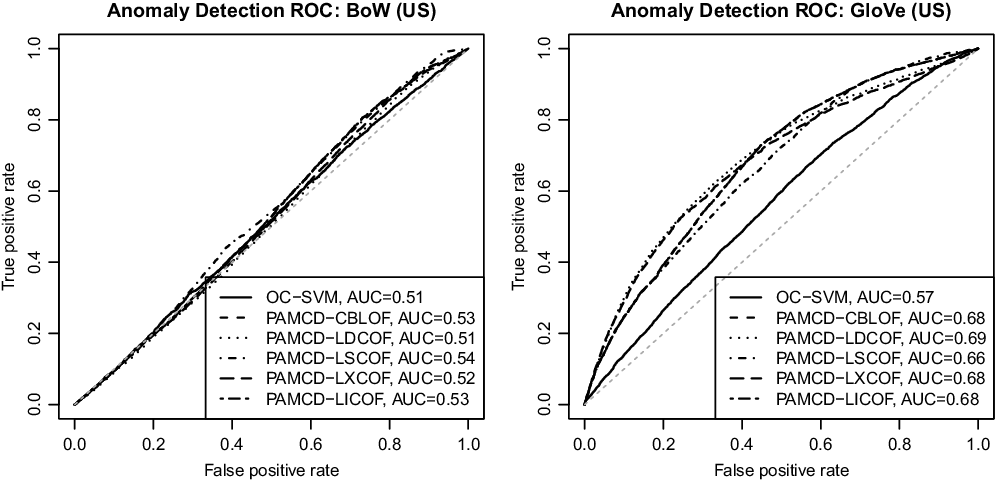
Anomaly detection ROC curves for the US forum.

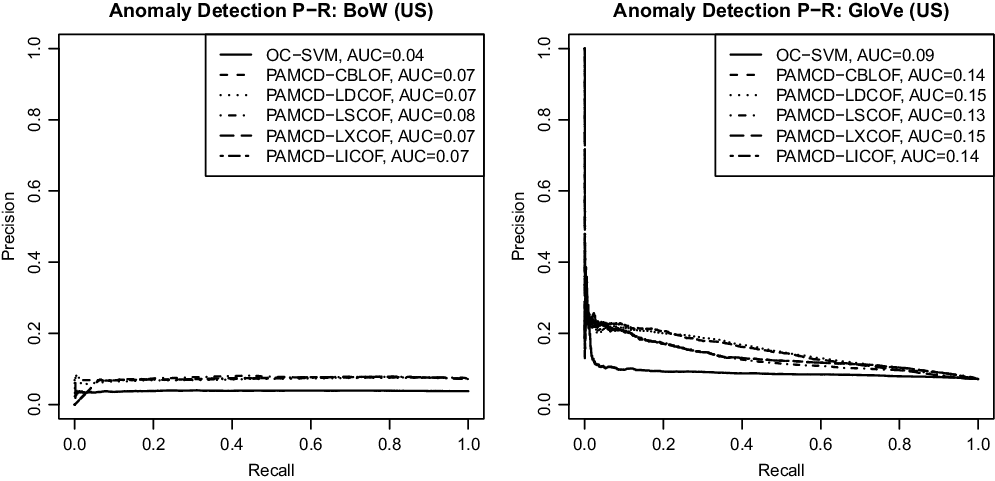
Anomaly detection precision-recall curves for the US forum.

Such an experimental procedure may not adequately represent all the challenges of real-world anomaly detection tasks, with anomalous posts coming from Internet trolls, intruders, or bots. It can be considered, however, more objective and realistic than introducing entirely artificial anomalies, and sufficient for the purpose of evaluating and comparing the performance of the investigated text representation methods and anomaly detection algorithms.
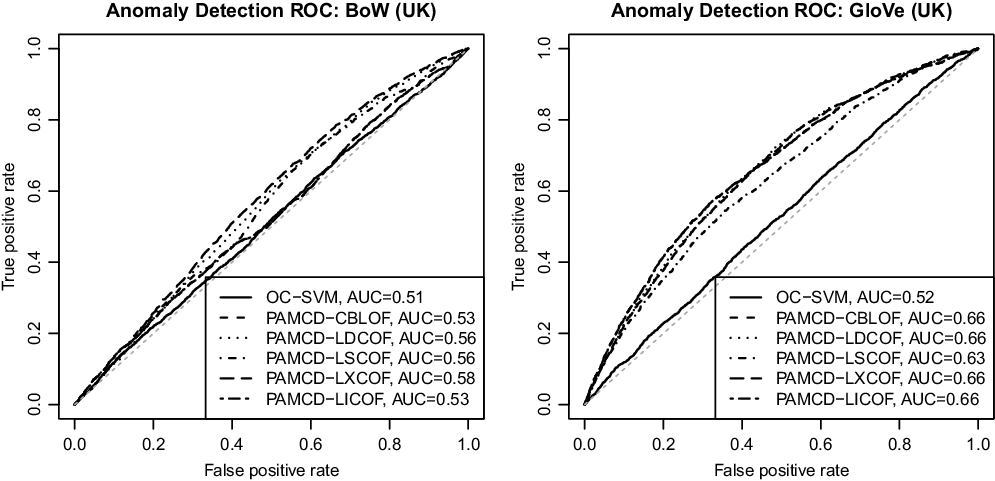
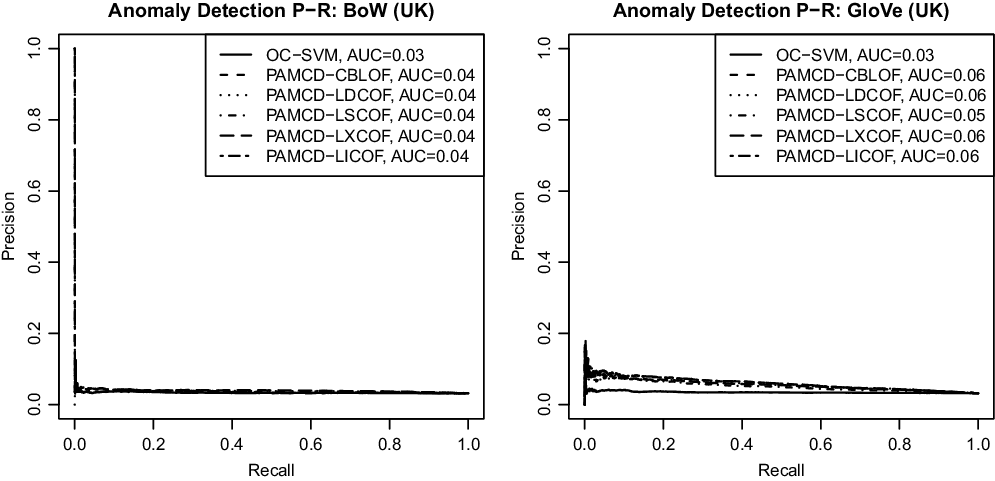
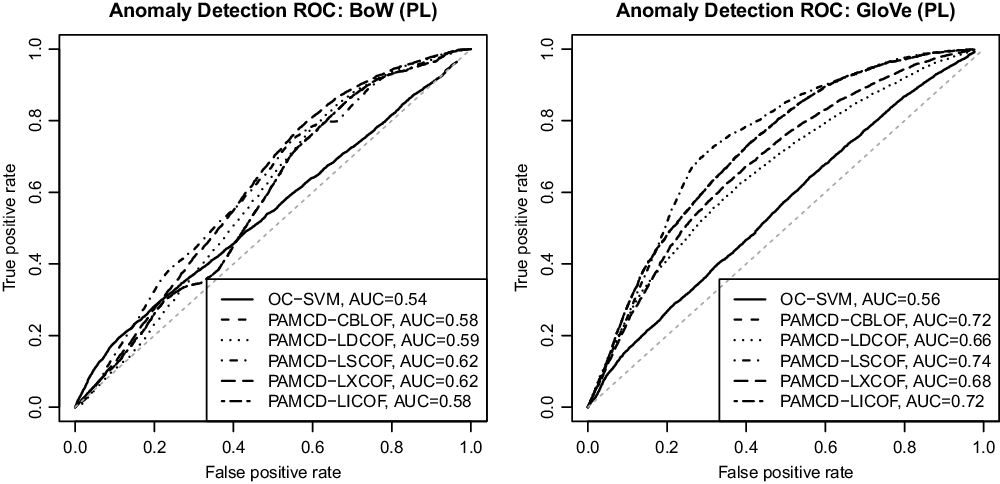
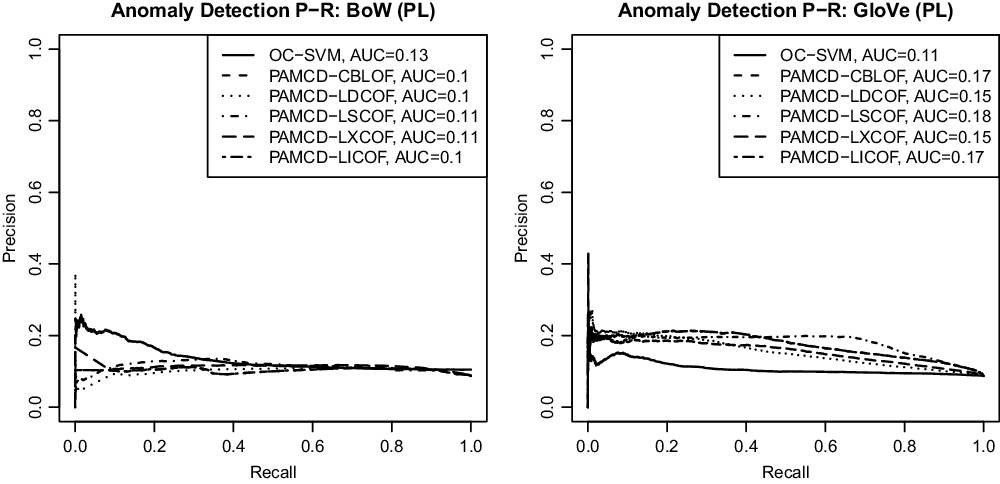
Figures 10 and 11 present the ROC and P-R curves obtained using the adopted evaluation procedure for the US forum. The corresponding results for the UK forum are presented in Figures 12 and 13, and for the PL forum in Figures 14 and 15. It can be immediately seen that the two unsupervised anomaly detection algorithms have much more trouble with discriminating the categories considered anomalous from the other forum categories than the previously demonstrated classification algorithms trained in the usual supervised way. This is of course hardly surprising. From a classification standpoint, the predictive performance of most evaluated anomaly detection configurations could be judged as poor. The task they were facing is definitely a hard one, though, given the unsupervised learning scenario and rather weak separation of forum categories. While the most successful of them achieves a reasonably high AUC of  $0.74$
for the PL forum, they all disappoint with low precision values, reaching
 $0.15$
–
 $0.18$
for the US and PL forums, and only
 $0.06$
for the UK forum for which class imbalance is the most extreme. While considerably better than random guess precision (which would be the share of posts from the categories considered anomalous in the data), this may be too little for application scenarios where examining false positives is time consuming or costly.
Anomaly detection ROC curves for the UK forum.

Anomaly detection precision recall curves for the UK forum.

Anomaly detection ROC curves for the PL forum.

Anomaly detection precision-recall curves for the PL forum.

It makes much more sense to compare the four anomaly detection setups with one another rather than with supervised classification. This comparison reveals two major findings. First, the GloVe representation turns out definitely more useful than the bag of words representation, leading to roughly the same or slightly better detection performance for the one-class SVM algorithm, but considerably superior detection performance for the PAM cluster dissimilarity algorithm. This observation is consistent with that from the previously presented classification and clustering experiments, and the computational savings due to the 50-dimensional GloVe representation are similarly huge as mentioned before. Second, PAM cluster dissimilarity, despite being potentially prone to curse of dimensionality issues, using only a 10% training set sample, clearly outperformed one-class SVM. It achieved slightly better results even with the bag of words representation, and substantially better results with Global Vectors. The combination of the PAMCD algorithm and the GloVe text representation appears therefore a much more promising approach to text anomaly detection. Additional experiments (unreported here to save space) were performed to verify that no detection performance improvement could be obtained by increasing the number of clusters, which suggests that the silhouette width-based heuristic for selecting the number of clusters worked reasonably well for the GloVe representation and that the bag of words representation fails to deliver satisfactory detection performance regardless of the number of clusters.
All the five approaches to anomaly score calculation based on cluster dissimilarity described above perform similarly for the US forum. For the UK forum, the LSCOF anomaly score turns out somewhat worse than the other ones. The performance of the anomaly scores for the PL forum is more diversified, with the LSCOF being a clear winner, followed by CBLOF and LICOF, which the other two scores noticeably worse. This makes it hard to make any definitive claims about the utility of the five investigated anomaly scores other than that the proper choice of the anomaly score may depend on the application domain. With that being said, it appears that the newly proposed LSCOF and LICOF scores, using normalization by cluster separation and diameter, may be useful at least in some applications and deserve further interest.
Anomaly detection performance differs substantially across the three discussion forums, with the best overall results obtained for the PL forum and the worst for the UK forum. These differences are more likely to be related to different levels of thematic cohesion of particular forums and their categories than to different languages.
6. Conclusion
The results presented in this article enhance the state of knowledge about the practical utility of text representation methods and anomaly detection algorithms for text data. They also encourage practical applications to discussion forum and other social media mining. With that being said, several issues arise that are worth investigating by future work.
6.1 Major findings
The major findings of this work are summarized below. While they are strictly speaking valid only for the particular application domain and datasets used for the reported experiments, at least some of them are likely hold for other application domains and datasets.
1. Discussion forum posts can be effectively and efficiently classified using the GloVe representation.
2. Discussion forum post clusters obtained using k-medoids clustering of GloVe document vectors are much more homogeneous and separated than those obtained using bag of words, which is much more likely to severely suffer from the curse of dimensionality.
3. The combination of k-medoids clustering and the GloVe representation appears a promising approach to modeling unsupervised anomaly detection in text data, substantially outperforming one-class SVM, as well as the cluster-dissimilarity approach with the bag of words representation.
4. The local separation cluster-based outlier factor (LSCOF) and the local diameter cluster-based outlier factor (LICOF) may be promising alternatives to clustering-based anomaly scores known in the literature, at least in the modeling setting and in combination with k-medoids clustering.
6.2 Practical utility
The primary practical utility of the reported research is related to the possibility of automatic monitoring of discussion forums and other social media channels. The usage scenario of detecting off-topic, suspicious, or otherwise outlying posts for human review and measuring the publication intensity of outlying posts in time appears realistic and useful. When applied to a discussion forum devoted to psychoactive substances, anomaly detection algorithms can serve the purpose of monitoring the risk of drug-related crime. This work is actually a spin-off of a research project on crime prediction using a variety of data sources, including discussion forum text data. Similar applications are also possible for other discussion forums associated with potentially illegal activities.
While anomaly detection models for this scenario would make their predictions primarily based on post textual content, it may be sometimes desirable or even necessary to include other attributes, characterizing the publication time, the publication method, the author, or the usage of nontextual content (such as mathematical formulas, images, and audio or video clips). This can be easily achieved by combining the GloVe text representation with additional nontext attributes. This is one more advantage over the bag of words representation, for which incorporating such attributes would be much more problematic.
6.3 Open issues and future work
The scope and depth of research presented in this article is unavoidably limited. The selection of algorithms used, while believed to be reasonable, could be definitely wider. No extensive parameter tuning was performed, which might have prevented some algorithms from achieving their top performance. More importantly, the effects of varying the settings of the GloVe algorithm, such as the context window size and word vector dimensionality, were not investigated. While preliminary runs with other settings were performed and found not to yield improvements, this is far from being a systematic study. Exploring the performance of other algorithms and parameter setups may be therefore one direction for future research, not necessarily very exciting, but definitely useful.
The performance of cluster dissimilarity approaches to anomaly detection may strongly depend on the exact definition of the anomaly score. It would be definitely desirable to systematically evaluate several alternative cluster-based anomaly scores, including those known from the literature and newly developed, across a variety of application domains and in combination with different clustering algorithms. This is particularly justified given the fact that most (if not all) of prior work on clustering-based anomaly detection adopted the nonmodeling scenario and therefore not all prior research findings may directly transfer to the modeling setting.
Text representation is at the heart of the approach to anomaly detection studied by this article. It would be therefore interesting to thoroughly examine possible enhancements to the process used to derive both the bag of words and GloVe representations. These may include using GloVe vectors pretrained on larger universal or domain-specific text corpora, more refined natural language processing techniques for foreign phrase detection, spelling correction, and stemming, a more adequate list of stop words, incorporating a thesaurus (both general and domain-specific) to combine synonymous terms, including selected particularly meaningful bigrams or trigrams in the vocabulary, and more carefully adjusted term filtering criteria. It may be also worthwhile to consider more appropriate methods of combining GloVe word vectors into document vectors, as well as comparing the utility of the GloVe representation with that of doc2vec, latent semantic analysis, latent Dirichlet allocation, and other vector text representations (Szymański Reference Szymański2014).
Other interesting directions of future work are related to the application domain addressed by this article. They include incorporating additional nontext attributes to forum post representation, which may improve the quality of anomaly detection models, as well as exploring more complex model application scenarios, possibly combining multiple models of different types. In particular, an anomaly detection model could be used for novelty detection to improve the predictive performance of a classification model.
The experimental procedure used to produce the results presented in this article is based on anomaly simulation, with posts from selected forum categories considered anomalous and removed from the training data. While useful for evaluating the performance of different text representation methods and anomaly detection algorithms, it may not adequately represent the challenges of real-world anomaly detection tasks. Experimenting with datasets containing true anomalies (e.g., posts coming from Internet trolls, intruders, or bots) would definitely provide a more reliable assessment of the practical utility of the investigated methods. Such a fully realistic experimental study also remains to be performed in future work.