1. Introduction
China has been the largest destination for foreign direct investment (FDI) among all developing countries for a number of years. While it has been acknowledged that the entry of foreign investment into China significantly boosts its economy (Cheung and Lin, Reference Cheung and Lin2004; Yao, Reference Yao2006), the environmental consequences of FDI in China have increasingly attracted attention with growing concerns over the deterioration of China's environment and pressure for increasing environmental protection. In 2000, the share of FDI invested in industrial sectors accounted for 63.47 per cent of total FDI (25.84 billion US$), and in 2004 the share increased to 70.95 per cent, indicating that the majority of FDI is invested in industries from which most of China's pollution has been generated. Hence, a question is whether FDI causes more pollution in China, and if it does, through which channels does it affect China's environmental quality?
A popular view of the FDI-pollution nexus is the so-called ‘Pollution Haven Hypothesis’, by virtue of which developing countries with lower abatement cost and less stringent environmental regulation usually have an advantage in attracting pollution-intensive foreign capital. A number of econometric studies have examined whether differences in environmental standards in host countries can be a location-specific determinant of foreign investment (Xu and Song, Reference Xu and Song2000; Smarzynska and Wei, Reference Smarzynska and Wei2001; Keller and Levinson, Reference Keller and Levinson2002; Eskeland and Harrison, Reference Eskeland and Harrison2003; List et al., Reference List, McHone and Millimet2004; Henderson and Millimet, Reference Henderson and Millimet2007).
The environmental consequences of foreign firms in China have also been studied, and the estimation results generally support that there is a positive role of FDI in reducing environmental pollution in China. For example, based on the data of nearly 1000 Chinese firms, Wang and Jin (Reference Wang and Jin2002) explore the differences in controlling pollution of industries with different types of ownership. They find that foreign-invested enterprises and collective-owned enterprises have better environmental performances in terms of both pollution control and emission intensities, while state-owned enterprises and privately owned enterprises in China are the worst performers in terms of water pollution emission intensity. These differences in environmental performances by different firms are, as argued by the authors, mainly due to the fact that foreign-invested enterprises may adopt more environmentally friendly technologies in their production. Similarly, based on city-level data for 260 Chinese cities, Liang (Reference Liang2006) also shows that the entry of foreign investment helps improve the environmental quality in China, since a negative relationship is found between FDI and air pollution in its estimation. The study finds that a 1 per cent increase in FDI decreases sulfur dioxide intensity by 0.6–0.7 per cent.
However, these studies used a single-equation estimation technique, and their estimation results may, therefore, be biased because of the presence of simultaneity. Furthermore, it is difficult to understand the mechanisms through which foreign investment affects local environmental quality in China using reduced-form estimation. It is Grossman and Krueger (Reference Grossman and Krueger1991) who first decomposed the environmental outcomes of the North American Free Trade Agreement (NAFTA) into three effects: the scale effect, composition effect and technique effect, and such a method of decomposition has been widely used in empirical studies on the trade-environment nexus (Antweiler et al., Reference Antweiler, Copeland and Taylor2001; Copeland and Taylor, Reference Copeland and Taylor2004). We adopt a similar approach and divide the environmental effect of FDI in China into three effects: the first is the scale effect, which means that by enlarging local output, foreign investment uses more resources and hence emits more pollutants. The second is the composition effect, namely the entry of foreign firms may affect China's industrial composition, depending on the pollution intensity of FDI. FDI can also change the ratio of factor inputs used in production such as the capital–labour ratio, depending on the factor intensity of FDI, which in turn affects the level of pollution. For example, capital-intensive industries usually generate more pollution emissions than labour-intensive ones. The last is the technique effect, which implies that foreign firms may bring about more environmentally friendly techniques, which help ease the emission intensities of production and at the same time cause some positive spillover effects resulting from the adoption of cleaner technology by local firms. Furthermore, if the entry of foreign firms helps improve the productivity of local firms either through cooperation or spillovers, there will also be a positive impact on local environmental quality since resources are likely to be more efficiently utilised, and thereby less pollution will be emitted.
To test the existence of these three effects through which FDI impacts on China's level of pollution, this study applies a simultaneous equation estimation technique using panel data of China's 29 provinces for the period 1992–2004. The study not only investigates the overall environmental consequence of foreign firms, but also aims to understand the variations in the environmental impact of FDI across different regions in China. To ensure the robustness of the estimation results, five kinds of different pollutants are used, including air, water pollution as well as solid wastes. Our estimation results generally support that there is a positive role of FDI in reducing pollution emissions in China, which is consistent with the findings reported in Wang and Jin (Reference Wang and Jin2002) and Liang (Reference Liang2006). However, our study goes a step further by decomposing the total environmental effect of FDI into the three pollution effects. In doing so, it enables us to demonstrate that such a positive effect can be attributed largely to the technique effect associated with the inflows of FDI. We also further decompose the three pollution effects into both the direct and indirect effects, and the results of such decomposition help us understand the specific mechanisms through which the entry of foreign firms affects China's environmental quality. While we are not the first ones to study the environmental consequences of foreign investment applying a simultaneous equations system, the econometric framework applied in the study has its own contribution in that it considers the interactions between foreign investment, pollution emissions and economic development in a unified analytical framework.Footnote 1
The study proceeds as follows. Section 2 describes the regional variations in FDI inflows and environmental performance across China's 29 provinces. Section 3 introduces the estimation model and Section 4 reports the estimation results. Section 5 concludes.
2. FDI and environmental pollution across provinces in China
The pattern of inflows of FDI to China shows remarkable spatial variations among different regions (see Appendix 1, available at http://journals.cambridge.org/EDE). The eastern regions have accounted for a much larger share of FDI due to the government's preferential policies, their favourable geographic location and more developed infrastructure facilities, while the accumulated FDI inflows into the inland provinces are much lower. Over our sample period 1992–2004, the mean value of the share of FDI in the eastern region is as high as 87.84 per cent. By comparison, the share of total FDI is 9.69 per cent for the nine provinces in the central regions, and only 2.45 per cent for the western regions. The mean value of FDI in Guangdong, whose share of FDI is the highest among China's 29 provinces, is 11.37 billion US$ during the sample period, which is double the sum of FDI invested in the 17 inland provinces (5.51 billion US$).
Despite the fact that foreign investment is highly concentrated in the eastern provinces, it is inconclusive to say whether the eastern provinces perform better or worse than inland regions with respect to pollution emissions in connection with the inflows of FDI. Guangdong, with the largest average share of 27.5 per cent, ranks the highest in terms of attracting FDI. However, it demonstrates a pattern of pollution which is quite similar to that in Hubei, Hunan as well as Guizhou in the central or western regions. The emission levels of four pollution indicators in Guangdong – industrial polluted water, chemical oxygen demand (COD), industrial smoke and industrial solid wastes – have similar mean values to that in Hubei, but the mean value of FDI in Hubei is less than one tenth of that of Guangdong. Different provinces within the same region also perform differently as far as the pattern of pollution is concerned. Taking the eastern region as an example, four out of the five pollutants (except COD) demonstrate increasing trends over the sample period in Guangdong. By comparison, Shanghai performs much better as its emission levels of three of the four pollutants (except industrial solid wastes) all decline over the same period. With significant regional variations in both the FDI inflows and the environmental performance in China, one needs to ask whether the entry of foreign firms helps reduce pollution emission and hence improves the local environmental quality. We aim to investigate the environmental consequences of FDI in China by using a simultaneous equations estimation method in this study.
3. Model specifications and data
Following Copeland and Taylor (Reference Copeland and Taylor2003), we decompose the emission level of pollution (polu) into three effects: the scale, composition and technique effects.Footnote 2 Gross domestic product (gdp) is widely used to measure the scale effect. This study adopts the ratio of industrial output to (gdp) to capture the pollution effect of changes in industrial composition (comp). Finally, the technique effect (tech) is measured by the ratio of total pollution emissions over industrial output, which is essentially the pollution intensity per unit of industrial output. According to Copeland and Taylor (Reference Copeland and Taylor2003), the technique effect is not only affected by the pollution tax rate, but also by other factors, such as technology advancement and R&D expenditures on environmental protection. Hence, pollution per unit of industrial output may be a more direct measure of the technique effect. Therefore, pollution emissions can be decomposed into three effects:

Panel data for 29 provinces in China during 1992–2004 are used in this study. Tibet is excluded from the sample due to data unavailability for certain indicators. Since Chongqing only became a municipality city in 1997, we integrate Chongqing's data into Sichuan province as a whole. The real value of GDP is calculated by adjusting the nominal GDP based on GDP indexes across different provinces, and the ex-factory price indexes of industrial products have also been used to calculate the real value of industrial output. For the pollution indicators, five kinds of pollutants are used: industrial sulphur dioxide, industrial dust, industrial polluted water, industrial solid wastes and chemical oxygen demand in industrial water pollution (see Appendix 3, available at http://journals.cambridge.org/EDE, for their definitions). All the original pollution data are taken from China's Environmental Yearbooks.
3.1 The scale effect
To measure the scale effect of FDI, we estimate how FDI affects economic scale in the following equation:

where subscripts i and t represent region i and year t, respectively. ai is the region-specific fixed effect, and ϵit is the error term with the usual attributes. The scale equation implies that regional output level (gdpit) depends essentially on the following variables: (1) Regional physical capital stock (kit). Based on Zhang et al. (Reference Zhang, Wu and Zhang2004), the commonly used perpetual inventory method is used to estimate the stock of physical capital among different regions. (2) Labour input (lit), which is measured by employment at the end of each year for each province. (3) Human capital accumulation (hit). Educational attainment is widely used to measure the level of human capital (Barro and Lee, Reference Barro and Lee2001), which is the ratio of the sum of all employees’ education years to the total population. Specifically, we set the education attainment of elementary schooling as six years, and that of junior middle school, senior middle school and university graduates as 9, 12 and 16 years, respectively. (4) Pollution emission (poluit). By introducing pollution emissions into the scale equation, the feedback effect of environmental pollution on economic growth can be captured. The coefficient a 4 is expected to be negative, i.e., higher levels of pollution may negatively affect economic growth because of the damages inflicted by environmental degradation and the associated costs involved in mending the damages. (5) Foreign investment (fdiit), which is measured by actual utilised FDI for each province. Taking the significant regional disparities in China into consideration, we add two regional dummies to our growth accounting model to capture the role of geographic location and regional income disparities. While dume denotes the dummy variable for the 12 eastern provinces, dumc is our second dummy variable for the nine provinces in central region. We also add another time variable year to control for the time trend in China's regional economic growth.
While the coefficient a 1 measures the direct effect of FDI on economic growth, FDI may also impact on economic growth by promoting the accumulation of physical capital kit in host countries, which can be considered as the indirect effect of FDI on economic growth. Thus, we also estimate how FDI affects physical capital accumulation through the following equation:

where μit is the error term and gdpi, t − 1 is the one period lagged value of gdp, so the coefficient d 2 measures how physical capital accumulation will be affected by the macroeconomic environment and economic fluctuations. We also have dummy variables di incorporated in the model to measure individual region-specific fixed effect. As FDI is also a part of physical capital formation in host countries, the coefficient d 1 depends on how the entry of foreign firms affects local firms’ investment decisions, namely whether there is a crowding-in or crowding-out effect of FDI on domestic investment.
3.2 The technique effect
The technique effect equation reads as follows:

where υit is the error term. It can be seen that the technique effect tech, measured by pollution emissions per unit of industrial output, is determined by the following variables: (1) R&D expenditures in pollution abatement (prdit), which captures the undertaking of host countries in reducing environmental pollution, so the coefficient of prdit is expected to be negative. (2) The number of employees in environmental protection-related agencies at different administrative levels (national, provincial and metropolitan levels), which is denoted as numit. The role of environmental protection-related employees is similar to prdit, which captures the pollution abatement efforts made in host countries, and so the coefficient of numit is also expected to be negative. The original data of prdit and numit are taken directly from the China Environment Yearbooks. (3) Government pollution abatement expenses. In the China Environment Yearbook, two types of government pollution abatement expense are listed. One is the state budget of governments’ pollution abatement, and the other is the special funds for pollution abatement. Both indicators of government pollution abatement expense are adopted here as they are mutually exclusive: budit stands for state pollution abatement budget, and govit for special pollution abatement expense funds. (4) Population density (densit) is the number of people per square kilometre. It is argued that the larger the population density is, the more damage pollution emissions are likely to cause prompting more efforts to be made in reducing the intensity of pollution emissions. So we expect b 2 to be negative. The original data on population densities are taken from China's Statistical Yearbook. (5) GDP per capita (agdpit), which measures the stage of regional economic development and affects pollution emission per unit of industrial output in two ways. First, a higher GDP per capita means that people have a higher demand for cleaner environment (assuming that the environment is a normal good), compelling the government to implement more stringent environment regulations. Second, a higher GDP per capita also implies a more advanced stage of regional economic development; hence more resources can be allocated into environment protection and pollution abatement activities. So the technique effect of GDP per capita is expected to be negative in the model estimation.
We also add two regional dummy variables to capture regional variations in pollution emission intensities. One is dume for the 12 provinces in eastern region. The other is the dummy variable dums for the two provinces in inland China, i.e., Shanxi and Neimenggu, as both of them are well endowed with coal.Footnote 3 A time variable year is also used to control for the time trend in pollution per unit of industrial output.
3.3 The composition effect
The composition effect equation is given as follows:

where νit is the error term. The equation demonstrates that industrial composition, denoted by the ratio of regional industrial output to its GDP, is affected by: (1) R&D expenditure (trdit), which plays an important role in the adjustment of regional industrial structure by promoting the advancement of technology and innovation. (2) Ratio of factor inputs, which is measured by the ratio of physical capital stock to labour. Generally, a higher ratio of capital–labour will lead to a larger share of industrial output in the economy and therefore tend to produce more pollution. (3) GDP per capita (agdpit), which will affect the composition effect in two ways. First, a higher GDP per capita reflects a rapid process of industrialisation, which tends to generate more pollution. Second, a higher GDP per capita also implies that people have a higher demand for a cleaner environment and environmentally friendly products. Hence, the combined composition effect of GDP per capita on pollution is ambiguous. (4) Two infrastructure variables railit and roadit, measured by the lengths of railway and road in kilometres, respectively, are also used to measure the role of infrastructure development in industrial activities. We also add two regional dummies: dume for the 12 eastern provinces and dums for the two inland provinces of Shanxi and Neimenggu, as well as a time-trend variable year.
3.4 The determinants of FDI inflows in China
One of the problems in estimating the econometric models applied in the study lies in the endogeneity of foreign investment, meaning that the location choice of foreign-invested firms may essentially depend on certain economic factors. To deal with the endogeneity problem of FDI, we follow other studies such as Cheng and Kwan (Reference Cheng and Kwan2000), Sun et al. (Reference Sun, Tong and Yu2002) and Gao (Reference Gao2005), to examine the determinants of FDI by establishing the following model:

where fdii, t − 1 is FDI lagged by one year, and the coefficient γ1 measures whether there is a self-accumulation effect of foreign investment. We also use other standard explanatory variables in the model: (1) wageit is the average wage for province i, which captures the role of labour costs in attracting foreign investment into China. (2) The two infrastructure variables railit and roadit, denote the lengths of the railway and road in kilometres, respectively. (3) We also have two regional dummy variables included to capture the regional disparity in attracting FDI: dume for the 12 provinces in eastern China and dumc for the nine provinces in central China, and year is used to control for the time trend in FDI inflows.
Finally, we attempt to investigate further whether the level of pollution emission also significantly affects foreign investors’ decision on investing in different provinces, as implied by the ‘pollution haven hypothesis’. To do so, we add another explanatory variable polui, t − 1, which is the lagged term of pollution emissions by one year, to measure the feedback effect of environmental pollution on foreign firms’ location choices.
3.5 The simultaneous equations model
In sum, we have established an econometric system consisting of six equations to simultaneously estimate the effect of FDI on pollution emissions in China as follows:


Equation (1) is an identity, which decomposes pollution emissions into the three effects. Equations (2)–(4) are the scale, technique and composition effect equations, respectively. Equation (5) estimates how FDI contributes to physical capital accumulation in China. Equation (6) investigates the determinants of FDI in China to deal with the endogeneity problem associated with the determinants of FDI inflows.
The above simultaneous equations system demonstrates the mechanisms through which the entry of foreign firms may affect pollution emissions in host countries (see Appendix 4, available at http://journals.cambridge.org/EDE, for a schematic description about how these mechanisms work). First, FDI affects pollution emission directly through the three effects, which can be measured by the coefficients a 1, b 3 and c 1, respectively. Second, as pollution intensity and industrial composition also change with economic development, FDI has an indirect impact on pollution emissions through its impact on GDP per capita, and this indirect effect is jointly determined by a 1 and b 5(c 4). Third, FDI has another indirect effect on pollution emissions through its impact on capital accumulation, since the latter also affects both the scale and composition effects. Finally, the feedback effect of pollution emissions on economic growth is also considered.
4. Estimation results
Since equation (1) is an identity, we only need to estimate the other five equations. The system consisting of equations (2)–(6) can be studied using the usual rank and order conditions, and it is obvious that all five equations are overidentified. Generally, system estimation methods such as two-stage least squares (2SLS) and three-stage least squares (3SLS) can be used to estimate the econometric models. It is well known that 3SLS is more efficient than 2SLS in that 3SLS permits correlations between the unobserved disturbances across different equations, as well as restrictions among coefficients of different equations, and hence improves upon the efficiency of equation-by-equation estimation by taking into account such correlations across equations (Wooldridge, Reference Wooldridge2002). Therefore, we adopt the 3SLS method to estimate the above econometric system consisting of the five equations.
4.1 Estimation results for the scale effect
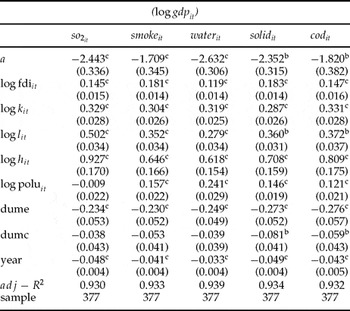
Table 1 shows the estimation results for the scale effect. First, physical capital, labour and human capital are all important sources of economic growth, and the role of human capital is more significant than the other two factors. This finding is consistent with the general belief that China's economic growth is mainly driven by factor accumulation. Second, table 1 also captures the feedback from pollution emissions to economic growth. The coefficient is estimated to be significantly positive for all four pollutants except so2it. Regarding pollution emissions as another factor input like capital and labour (Copeland and Taylor, Reference Copeland and Taylor2003), our results indicate that the elasticity of pollution emissions roughly ranges between 0.12–0.24.
Estimation results on the scale effect

Note: The numbers in parentheses are standard errors. c and b indicate the significance at 1 and 5 per cent level, respectively.
Source: Authors’ own estimation.
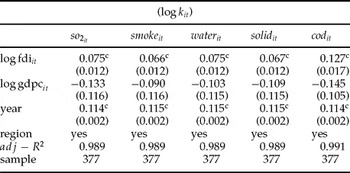
Third, table 1 implies that foreign investment is also an important driving force for economic growth apart from domestic factor inputs, since a 1 is estimated to be significantly positive in all five equations. The output elasticities of FDI are about 0.12–0.18, which are lower than that of physical capital, labour and human capital in contributing to growth as one would expect. However, the role of FDI in contributing to China's economic growth could be larger if one takes into account the role of FDI in China's domestic capital accumulation. The coefficients of FDI range between 0.06–0.07, meaning that physical capital stock will increase by 0.06–0.07 per cent with a 1 per cent increase of FDI (table 2). Finally, if we combine both the direct and indirect effects of FDI on economic growth, it is found that the total effect of FDI on China's economic growth will be a 1+d 1a 2. Taking SO2 as an example, the total scale effect of FDI is around 0.145 + 0.329 × 0.075 = 0.169.
Estimation results on the capital accumulation effect

Note: The numbers in parentheses are standard errors. c indicates the significance at 1 per cent level.
Source: Authors’ own estimation.
4.2 Estimation results for the technique effect
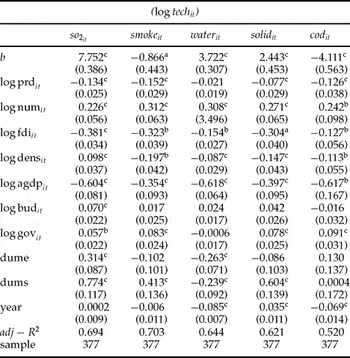
Table 3 shows the estimation results for the technique effect for the five pollutants. The coefficients of prdit are all significantly negative, indicating that R&D expenditures on pollution abatement activities, cleaner technology, updating of traditional production techniques and equipment all help reduce pollution emissions. However, the coefficient of num is estimated to be significantly positive. This finding is contrary to our prior expectation as a larger number of personnel employed in environmental agencies usually mean more efforts have been made regarding environmental regulation and its implementation. This may be due to the two-way causality between environmental agencies and pollution emissions. While more personnel in environmental agencies and organisations imply that more stringent environmental regulations are put in place and more abatement efforts are made, it is also possible that for those regions with higher levels of pollution emissions and poorer environmental quality, more personnel in environmental agencies are required to be employed to monitor and control firms’ pollution behaviour. This two-way causality between agcy and pollution emissions could make their relationship appear ambiguous.Footnote 4 We have also observed the similar estimation results in estimating the two government pollution abatement expenses. While the coefficient of the state pollution abatement budget is estimated to be statistically insignificant, that of special pollution abatement expense funds is significantly positive except for industrial polluted water, which may also indicate that more abatement expense is required to deal with pollution problems for those regions with a worsening environmental quality.
Estimation results on the technique effects

Note: The numbers in parentheses are standard errors. c, b and a indicate the significance at 1, 5 and 10 per cent level, respectively.
Source: Authors’ own estimation.
Second, the coefficient of population density is estimated to be negative and statistically significant for all five pollutants. This finding is consistent with the theoretical proposition as derived in Copeland and Taylor (Reference Copeland and Taylor2003). As population density rises, the marginal pollution damage inflicted also becomes larger, so more stringent environmental regulation is required by the local residents. Similarly, the coefficient of GDP per capita is significantly negative, suggesting that China is ‘over the hump’ of the environmental Kuznet's curve.
Third, as for the technique effect of FDI, the coefficients of fdi are all significantly negative ranging between −0.12 and −0.38, suggesting that the pollution emission intensity decreases by 0.12–0.38 per cent with a 1 per cent increase of FDI. This is mainly because it is more likely for foreign firms to have adopted more environmentally friendly techniques or those technologies which are more advanced in general than that of local firms in their production, contributing to the reduction of pollution emissions (confirming the findings by Wang and Jin, Reference Wang and Jin2002). This may also be due to the fact that technology spillover effects emanating from foreign firms to domestic firms help improve local firms’ efficiency of utilising energy and resources and thereby lower the pollution emission intensity of production in general.
4.3 Estimation results for the composition effect
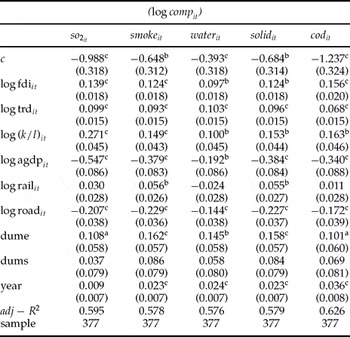
The estimation results for the composition effect for the five pollutants are reported in table 4. First, factor inputs, measured by the ratio of capital–labour, are an important determinant of the industrial composition. The positive coefficient of k/l indicates that a relatively high capital–labour ratio will lead to a larger share of industrial output in the economy, and because industrial sectors are in general typically capital intensive and pollution intensive (Antweiler et al., Reference Antweiler, Copeland and Taylor2001), this will consequently lead to a higher level of pollution. Second, R&D expenditures also have a positive impact on industrial development. Specifically, the share of industrial output will increase by 0.1 per cent with a 1 per cent increase in R&D. Since for a long time most R&D and innovation activities have taken place in industrial sectors in China, it is reasonable to expect a positive role of R&D in enhancing industrial growth. The effect of GDP per capita is estimated to be significantly negative, implying that as per capita income increases, the industrial composition tends to change towards developing those cleaner or more value added products and services.
Estimation results on the composition effects

Note: The numbers in parentheses are standard errors. c, b and a indicate the significance at 1, 5 and 10 per cent level, respectively.
Source: Authors’ own estimation.
Second, the composition effect of FDI is found to be significantly positive. According to the results reported in table 4, a 1 per cent increase of FDI will cause the share of industrial output in the total economy to increase by 0.1–0.15 per cent. Since the majority of foreign-invested firms have been concentrated in the industrial sector, the contribution of FDI to the increase in industrial output in China is understandable. However, to assess the role of FDI in influencing the industrial composition more accurately, we need to further consider that foreign investment has an indirect impact on industrial composition by affecting the capital–labour ratio and through which economic growth. To do so, we will calculate the combined environmental effects of FDI in the next section.
4.4 Estimation results for the determinants of FDI in China
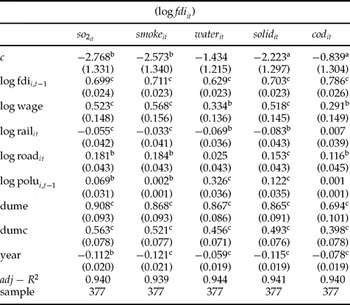
Table 5 reports the estimation results for the determinants of FDI in China. Generally, the estimation results are consistent with those findings from the studies by Cheng and Kwan (Reference Cheng and Kwan2000); Sun et al. (Reference Sun, Tong and Yu2002) and Gao (Reference Gao2005). A remarkable self-accumulation effect of FDI is found, as the coefficient of fdii, t − 1 is significantly positive, indicating that a higher value of FDI in previous years tends to attract more foreign capital flowing into China, possibly due to the geographic agglomeration effect. The positive coefficient of road reveals the importance of infrastructure in attracting FDI; however, this is not the case for rail. While the coefficients of the two regional dummy variables, dume and dumc are estimated to be significantly positive, the estimated coefficient of dume is much larger in terms of its magnitude than that of dumc. This finding is consistent with the regional distribution of FDI in China with a much higher concentration of FDI being invested in the eastern provinces. However, the effect of wages on FDI is estimated to be unexpectedly positive.Footnote 5
Estimation results on the determinants of FDI

Note: The numbers in parentheses are standard errors. c, b and a indicate the significance at 1, 5 and 10 per cent level, respectively.
Source: Authors’ own estimation.
The study continues to examine whether there is a feedback effect of pollution emissions on FDI. The pollution haven hypothesis supposes that developing countries have comparative advantages in those polluting sectors due to their relatively lower environmental standards. The Chinese experience provides an interesting case for examining whether environmental quality matters in attracting FDI. Our estimation results support, to a certain extent, the pollution haven hypothesis in that the coefficients of the lagged term of pollution emission are estimated to be positive, and statistically significant for the four pollutants except COD.
4.5 The combined environmental effects of FDI in China
Combining the estimation results in tables 1–5, we can calculate the combined effects of FDI on pollution emissions. Specifically, to simultaneously solve the system of six equations, we can obtain the measures of the scale effect, technique effect, composition effect as well as the total effect of FDI on pollution emissions as follows:

So the total environmental effect of FDI ∂log polu/∂log fdi can be decomposed in the following way. (1) The coefficients a 1, b 3 and c 1 measure the direct scale, technique and composition effect of FDI, respectively. According to the estimation results, while both the scale and composition effects are positive, the technique effect is negative. (2) Capital accumulation effect of FDI. Since domestic capital accumulation is one of the major determinants of both economic growth and industrial composition, foreign investment may indirectly affect environmental pollution through increasing investment formation in host countries. Such an indirect pollution effect of FDI depends on how FDI affects capital accumulation (d 1), and how capital accumulation in turn affects economic growth (a 2) and industrial composition (c 3). Hence, such an indirect pollution effect of FDI can be measured by d 1(a 2+c 3). It is estimated that physical capital stock will increase by 0.06–0.07 per cent with a 1 per cent increase of FDI. As the estimation results in tables 1 and 4 show that a higher capital stock will cause both a higher level of economic scale and a larger share of industrial output, this indirect pollution effect of FDI is generally positive, implying that foreign investment produces additional pollution emissions by increasing capital accumulation in China. (3) The effects of economic growth on the composition and technique effect. While rapid economic growth consequently causes more pollution emissions, it also raises people's demand for a cleaner environment and subsequently more resources can be spent on pollution abatement as the economy grows. Our estimation system shows that economic growth tends to reduce pollution intensity in industrial output (b 5) presumably with technological progress on the way, and the share of industrial output in the economy also tends to fall with an increase in economic scale via the increase in per capita income (c 4), reflecting progress in structural change along the path of industrialisation. These findings are consistent with the well-known environmental Kuznets inverted-U curve hypothesis between economic growth and pollution emissions, supporting the notion that foreign investment may affect host countries’ environmental quality by boosting their economic growth.Footnote 6 (4) The feedback effect of pollution on economic growth. In table 1, pollution emissions have a positive impact on production scale (a 4), and also the scale effect in turn affects both the composition and technique effects (b 5+c 4). Therefore, the feedback effect of pollution emissions on economic growth is measured by a 4(1+b 5+c 4). This measure shows that if we do not consider such a feedback effect of pollution, say a 4=0, then the total environmental impact of FDI is just the sum of the three effects, which may produce biased estimates.
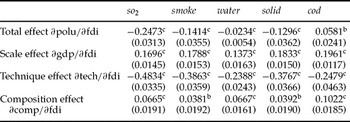
Using the estimated values of various parameters contained in the estimated system, we can calculate the environmental effects of FDI in China, which are reported in table 6. The standard errors for various combined environmental effects of FDI are calculated by using the usual Delta method (Wooldridge, Reference Wooldridge2002).
Various effects of FDI on pollution

Note: The numbers in parentheses are the estimated standard errors of various environmental effects, which are estimated applying the usual Delta method. c and b indicate the significance at 1 and 5 per cent level, respectively.
Source: Authors’ own calculation.
First, the scale effect of FDI is positive for the five pollutants and ranges between 0.137–0.196, implying that China's domestic output will increase by nearly 0.15 per cent with a 1 per cent increase of FDI. While this result is consistent with the conclusions reached in other studies, the scale effect of FDI in our study considers not only the direct effect of foreign investment on economic growth, but also takes into account the indirect scale effect of FDI, which is measured in two ways. The first is that FDI may indirectly affect economic growth by promoting physical capital accumulation, which is a 2d 1. The second is that FDI may also affect economic growth through the feedback effect of pollution emission on economic growth, which is (b 3+c 1+c 3d 1)a 4. Hence, the combined indirect scale effect of FDI can be measured as a 2d 1+(b 3+c 1+c 3d 1)a 4. This suggests that the role of foreign firms in China's regional economic development may be underestimated if we only consider the direct effect of FDI in the growth accounting analysis. However, as the entry of foreign firms speeds up China's economic growth, it consequently causes more pollution emissions with increasing production scale, implying that there might be a tradeoff between FDI's growth effect and its environmental effect, unless the negative effects of FDI on pollution through the scale and composition effects are offset by its technical effect.
Second, the technique effects of FDI are shown to be negative for all five pollutants, and they range between −0.239 and ~−0.483. Such negative technique effects can also be further decomposed into both direct and indirect effects. The direct technique effect of FDI is the estimated coefficient b 3 as reported in table 2. The indirect technique effect of FDI is jointly determined by ∂gdp/∂fdi and b 5. Take so2 as an example. The direct technique effect of FDI on so2 is estimated to be −0.381. To calculate the indirect technique effect of FDI, we need to know not only how economic development affects the pollution intensity (b 5), but also how FDI promotes economic development, which is measured as the scale effect of FDI. Therefore, the combined indirect technique effect of FDI can be identified as [a 1+a 2d 1+(b 3+c 1+c 3d 1)a 4]b 5, and a simple calculation shows that this indirect technique effect of FDI on so2 emission is −0.102. Hence, the combined technique effect of FDI on industrial sulphur dioxide emission can be calculated as the sum of the direct and indirect technique effects, namely −0.102+ (−0.381) = −0.483.
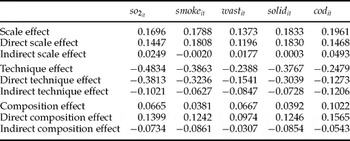
Third, similar to the approach for examining FDI's technique effect, the composition effect can also be divided into two: the direct composition effect measured by c 1 as reported in table 4, and the indirect composition effect of FDI captured by the extent to which foreign investment may affect the capital/labour ratio and GDP per capita. While the direct composition effect of FDI is estimated to be significantly positive (table 4), its indirect composition effect is generally negative (table 7).
The decomposition of the three environment effects

Source: Authors’ own calculation based on the estimation results from the study.
Finally, combining the three effects, we can get the total environmental effect of FDI in China, and its results are shown in table 6. It can be seen that as a whole the entry of foreign firms generally helps reduce pollution emissions except for COD (0.0581). Among all the pollutants, the pollution reduction effect of FDI is the largest for industrial sulphur dioxide (−0.247), which is followed by −0.141 for industrial smoke, −0.129 for industrial solid wastes and −0.023 for industrial polluted water.
A further calculation demonstrates that such a negative combined effect of FDI on pollution emissions in China can largely be attributed to its technique effect. For all five pollutants we have studied, both the scale effect and the composition effect are estimated to be positive, and the technique effect is calculated to be negative. Therefore, whether the entry of foreign firms in China helps reduce pollution emissions and hence improve the environmental quality depends essentially on the comparison or the relative strengths of the three effects, namely whether the technique effect dominates the combined environmental effect or vice versa. Take industrial polluted water as an example. Its scale, technique and composition effect are estimated to be 0.1373, −0.2388 and 0.0667, respectively (see Appendix 5, available at http://journals.cambridge.org/EDE). Comparing the three effects, we can find that the scale effect and technique effect capture most of the pollution effect of FDI. While the composition effect is estimated to be positive, it is much less important in terms of its magnitude. As the combined effect of FDI on polluted water emission is −0.0234, such a negative effect can mainly be attributed to its technique effect, i.e., the entry of foreign firms helps reduce the pollution emission intensity. Take COD as another example. As the combined effect of FDI on COD is positive, the only one among the five pollutants, this is mainly attributed to the fact that the technique effect of FDI on solid wastes is relatively small (−0.2479). On the other hand, the positive scale and composition effects of FDI on COD are both the largest among the five pollutants. Since the negative technique effect is not sufficient to offset the combined scale and composition effects, it is found that the entry of FDI causes COD to increase.
A further decomposition of the three environmental effects of FDI also enhances the understanding of the mechanisms through which FDI affects pollution emissions in a detailed fashion. The decomposition results in table 7 suggest that the estimated role of foreign investment in impacting on pollution would be largely biased if only the direct effect is considered. The importance of considering both the direct and indirect effects of FDI justifies the use of the simultaneous equations estimation technique applied in this study. Take the technique effect of FDI as an example. Table 7 shows that the positive role of FDI would be underestimated to a certain extent if we only consider the direct technique effect, since the indirect technique effect accounts for 21.12 per cent for so2it, 16.23 per cent for smokeit, 35.49 per cent for wastit, 19.32 per cent for solidit and 48.64 per cent for codit in the combined technique effect, respectively. As a matter of fact, while the combined environmental effect of FDI on industrial polluted water is −0.0234, the indirect technique effect has been as large as −0.0847. It means that once the indirect technique effect is excluded, the combined environmental effect of FDI would unexpectedly be positive. Take the composition effect as another example. The direct composition effect of FDI is estimated to be significantly positive for all five pollutants, implying that the entry of foreign investors helps improve the share of industrial output in the whole economy. However, since the indirect composition effect of FDI is calculated to be negative, the combined composition effect of FDI is actually much smaller than the direct one. In other words, the role of foreign firms in changing China's industrial composition would be largely exaggerated if such an indirect composition effect has been removed.
5. Conclusions
This study simultaneously estimates the environmental effect of foreign investment in China. The main findings of the study are as follows.
First, the estimated results demonstrate that the entry of foreign firms helps reduce pollution emissions in China in general. Second, the results reveal the channels through which FDI affects China's overall and regional environmental pollution. It is found that while there is a negative technique effect, the scale effect and composition effect of FDI are both positive. A further calculation demonstrates that the role of FDI in pollution reduction can be mainly attributed to its technique effect, while the importance of the composition effect is much less. That is to say, foreign investment helps reduce the pollution emission intensity per unit of industrial output. Third, we have divided the three environmental effects of FDI into both direct and indirect ones, and our estimation results show that both types of environmental effects are important. While the total environmental effect of FDI depends essentially on its technique effect, we demonstrate that the indirect technique effect of FDI also plays an important role in pollution control. In other words, if we overlook the indirect technique effect of FDI, which is generated by raising the capital/labour ratio and speeding up economic growth, the role of foreign investment in environment protection will be significantly underestimated.
Our study contributes to the understanding of the environmental consequences of foreign firms in a large developing economy, with some important policy implications. First, FDI has no doubt made important contributions to the general economic development of the recipient countries, but the recipient countries should at the same time be aware of both the negative (such as the scale and composition) and positive (such as the technique) effects on the environment associated with the inflows of FDI. As the popular pollution haven hypothesis states, multinational firms may seek lower production costs in developing host countries by relocating pollution-intensive industries from rich countries to poor countries, and hence cause the host countries’ environmental quality to deteriorate. For the host countries, the study reveals that it is important to encourage foreign investors to bring in more investments, which generate more technique effects. This understanding of the environmental consequences of FDI becomes even more important when developing countries are facing the environmental challenge in achieving the objectives of growth and development. Second, in our study of China's provincial data, it is found that the entry of foreign firms does not necessarily cause more pollution emissions and worsen the environmental quality. What we need to do is to look at the environmental effect of foreign firms across different regions within one country. While FDI generally helps reduce the local pollution emissions in China, the real contribution of foreign firms to local environmental protection may vary significantly due to the considerable regional variations in FDI inflows. Finally, a key issue identified in the study is how to comprehensively evaluate the environmental consequences of FDI in host countries. To do that, more attention should be paid to the interaction between foreign investment, environmental pollution and economic growth in a simultaneous system. This approach will enable the recipient countries to adopt some appropriate economic and environmental policies aimed at maintaining sustainable growth.