Implications
Many governments are committed to reducing greenhouse gas emissions (GHGE) to halt the negative effects of global warming. Dairy cows produce GHGE as a by-product of producing milk. Because farmers can choose how long a lactation can last in their cows, it might be possible to reduce GHGE by using lactations of a specific length. Our work found that shorter lactations produced less GHGE than longer ones, by a relatively small amount, when annual milk yield was kept constant and cow numbers allowed to vary. The best way to reduce GHGE and still produce the same amount of milk was to increase milk yield per animal and reduce animal numbers rather than change lactation length.
Introduction
Livestock systems play an important role in food production, as well as in the provision of public good objectives, including biodiversity and landscape value. However, agriculture also generates external costs or negative public goods, specifically diffuse pollution to air and water. Mitigating greenhouse gas emissions (GHGE) from livestock is increasingly recognised as a necessary part of national climate change obligations. For example, under its Climate Change Act of 2008, the UK Government is committed to ambitious targets for reducing national emissions by 80% of 1990 levels by 2050.
There are many possible technical GHGE mitigation options for livestock systems. These could be delivered through improved livestock and livestock system efficiency, converting a greater proportion of input energy into product output and thus reducing GHGE per unit product. The aim of this paper was to examine the impact of extended lactations on dairy system GHGE, as suggested by Hopkins and Lobley (Reference Hopkins and Lobley2009, p. 34).
There are a variety of models to calculate greenhouse gases for agriculture. These include simple animal emission factors (e.g. Tier I techniques in Intergovernmental Panel on Climate Change (IPCC) guidelines; IPCC, 1997), national inventory techniques (e.g. Choudrie et al., Reference Choudrie, Jackson, Watterson, Murrells, Passant, Thomson, Cardenas, Leech, Mobbs and Thistlewaite2010), carbon footprinting tools and lifecycle analysis (LCA; e.g. Williams et al., Reference Williams, Audsley and Sanders2006). However, most models differ in the way they calculate the emissions, what output data they provide and their level of detail and accuracy. Currently, the UK national inventory of GHGE uses a simplified Tier II (IPCC, 1997) to calculate methane (CH4) emissions from the dairy herd. This involves calculating CH4 emission factors, due to enteric fermentation and manure, for a milking animal based on UK dairy production parameters. This single value is then multiplied by the total number of animals in the dairy breeding herd. This method does not account for variation between animals and systems, including differences in the length of the lactation. To overcome this, a more detailed methodology was applied to the calculation of GHGE from the national average dairy herd, including considering the N2O emissions and CO2 equivalent (CE) emissions due to energy used to produce animal diets, for lactations of 305, 370 and 440 days in length.
Material and methods
The results presented in this paper were derived using an Excel-based depiction of the ‘national average dairy herd’. The IPCC (2006) formulae were used as the basis for developing the greenhouse gas models. UK-specific energy coefficients and production system parameters, where available, were put into the model, moving it from Tier I (the lowest) methodology towards the higher Tiers II and III. Only emissions that related directly to the stock were included. Emissions from capital, fuel, power, etc. were assumed to remain constant regardless of changes in lactation length and were not included in this investigation as they were assumed to be insignificant. The carbon equivalent ‘cost’ of the feed was based on data from the Cranfield LCA model (Williams et al., Reference Williams, Audsley and Sanders2006). In addition, the net annual carbon dioxide emissions from livestock were assumed to be zero in accordance with IPCC (2006).
The ‘national average’ herd
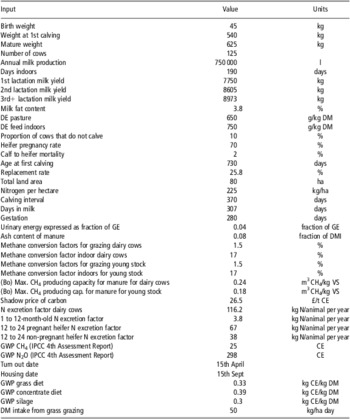
The basic biological and herd parameters used in this study are given in Appendix Tables A1 and A2, most of which were based on the study of Stott et al. (Reference Stott, Coffey and Brotherstone2005). These figures were chosen to provide a consistent set of figures representative of UK dairy farming practice.
The model parameters described by Stott et al. (Reference Stott, Coffey and Brotherstone2005) and IPCC Tier II/III methodologies (IPCC, 2006) were used to model the CH4 (enteric fermentation and manure management) and N2O (manure management) emissions from the whole farm system (young stock and milking herd). Under the IPCC framework, N2O emissions due to nitrogen excretion when cows are grazing should be reported in the agricultural soils of the inventory framework. This study, however, included these emissions as they account for a large proportion of the total nitrogen from the dairy system and therefore GHGE.
Three lactation length scenarios were compared with the ‘base’ data outlined above: 305, 370 and 440 days; equivalent to an annual, the UK national average and an 18-month calving interval, respectively, the latter being considered an ‘extended’ lactation in this paper. When examining the impact of alternative lactation lengths on overall system GHGE, the annual herd milk yield was set to remain constant and the numbers of cows (and replacements) allowed to increase, or decrease, in order to maintain this overall yield for each lactation-length scenario. The herd of replacements was described in terms of annual cohorts (i.e. 0 to 1-year-old, 1 to 2-year-old pregnant/non-pregnant). The results were then represented on an annualised scale (i.e. total lactation yield × (365/(lactation length + dry period length))) so that all lactation lengths could be compared on an equal basis. The model assumed that farmers wished to keep total annual herd output constant, rather than individual cow lactation output. Although total lactation output may be higher with longer lactations, it may not always hold that annualised outputs of alternative lactation lengths are similar.
It was assumed that dairy cattle spent half the year indoors (Appendix Table A1). It is important to note that the proportion of time spent indoors was fixed on an annual basis rather than as a function of lactation. It was assumed that the average UK herd would utilise grazed grass when it was available rather than moving to an indoor system. In practice, some herds may appropriate a longer or shorter grazing period, but the data used in this study could not separate differing grazing periods by lactation length to model such subcategories.
As cattle in the United Kingdom are usually within their thermoneutral zone, it was assumed that their maintenance energy requirements did not have to increase to account for the cold winter temperatures. Dairy cattle were assumed to be exposed to ‘cool’ annual average temperatures (10°C to 14°C) for the purposes of quantifying the methane conversion factors of different manure management systems (IPCC, 2006). This meant that the methane conversion factor of manure for dairy cows at grass was 1.5%. For cattle that had their slurry managed from indoor housing, this coefficient was set at 17% to represent the average values for the range of slurry management systems on dairy farms.
Management
Feed digestibility (a measure of feed quality) is an influential factor in determining the productivity and efficiency of farmed ruminants (Russell, Reference Russell1971). It can also have a significant bearing on methane emissions (IPCC, 2006). For example, a 10% error in estimating feed digestibility can cause a 12% to 20% error in methane emissions (IPCC, 2006). The gross energy (GE) digestibility values for dairy cattle on concentrates and on pasture were therefore set in the model as the upper limits of the IPCC (2006) recommendations. The annual average for pasture quality was fixed such that the feed energy value was ‘relatively constant’ (at 18.45 MJ GE/kg dry matter) across a wide range of forage and grain-based feeds commonly consumed by livestock (Table A2). Concentrate feed and lowland pasture digestibilities were set to 85% and 75%, respectively.
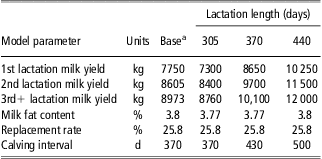
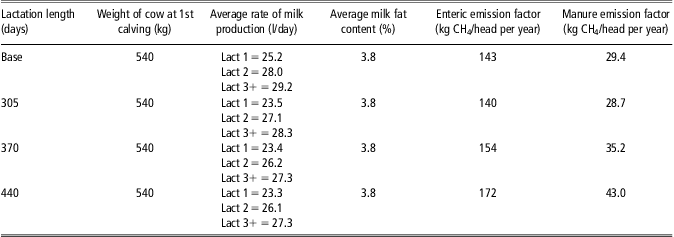
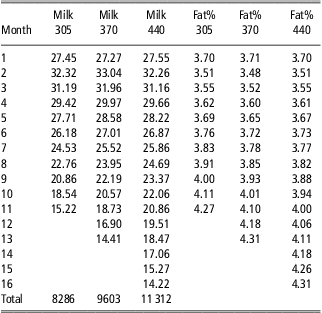
It was assumed that the dairy cows were grazed for approximately half the year on lowland pastures. Cows were maintained indoors on a mixed diet of grass silage and concentrates for the remainder of the year. The replacements were assumed to be kept on a similar management system in all scenarios, with age at first calving being 24 months. The average CP content of the annual diet was 180 g/kg. The impact of the different diets, in terms of GHGE, was taken from the Lifecycle Assessment study of Williams et al. (Reference Williams, Audsley and Sanders2006). Milk production data for the three lactation length scenarios were based on the results derived by Pollott (Reference Pollott2011) from an analysis of UK herd performance data and are shown in Table 1 and Appendix Table A3.
Parameter values used to model the alternative lactation length scenarios
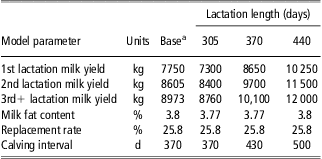
aBase scenario from data used to calculate the Profitable Lifetime Index in the United Kingdom with a lactation length of 370 days.
Emissions from manure storage and milk production at grass were estimated based on the days at grass and indoors and assumptions on manure output and storage from IPCC and Prevention of Environmental Pollution from Agricultural Activity (PEPFAA, 2005). Greenhouse gases from manure were calculated based on volume produced from each of the livestock categories kept on the farm (e.g. dairy cows and replacements) in line with the IPCC methodology.
Scenarios and sensitivity analyses
The biological and environmental inputs and outputs of the dairy herd were modelled in Excel. The parameters of the dairy herd were as described in Stott et al. (Reference Stott, Coffey and Brotherstone2005). This study modelled the impact of altering various parameters (e.g. replacement rate, lactation length, curve and yield) on the biological profile of the herd and their consequences on GHGE. Under the changed parameters, the herd was optimised to maintain total annual milk output. The model used deterministic optimisation with a linear programming approach to model the altered herd structure required to maintain herd milk output (Garnsworthy, Reference Garnsworthy2004). The model was run for four scenarios; the ‘base’ situation used in the United Kingdom to calculate economic weights (Stott et al., Reference Stott, Coffey and Brotherstone2005) for the Profitable Lifetime Index, a UK selection index, used as one option to select dairy cows. The other three scenarios were based on cows having lactations lengths of 305, 370 and 440 days using the data described by Pollott (Reference Pollott2011) and derived from the extensive database of Holstein test-day records obtained from National Milk Records Ltd (Harrogate, UK). Lactation records were selected on the basis of their final test-day record being in the ranges 295 to 315 days, 360 to 379 days and 430 to 449 days, respectively. All scenarios were derived to mimic the ‘average national UK dairy herd’, each having one of the three lactation length characteristics. Results were then multiplied up by the National Inventory data to give nation GHGE results for the dairy sector.
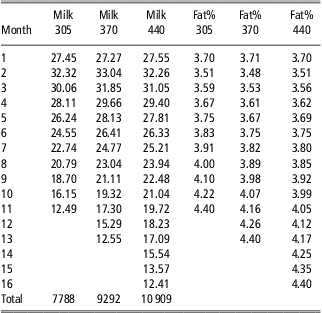
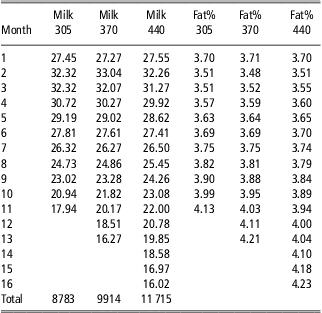
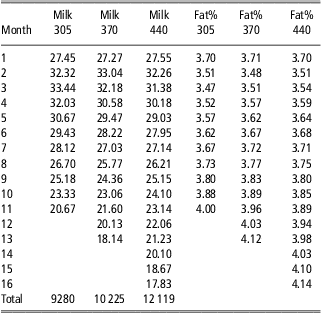
Sensitivity analyses were performed by rerunning the model under a range of different parameters. The factors tested in this way were herd replacement rate (20%, 22% and 25%), persistency (altered by −10%, +10% and +20%) and milk yield (bottom 10% and top 10% mean milk yield from nationally recorded data). Milk yields under the different persistency scenarios are shown in Appendix Tables A4 to A6.
National Inventory calculations
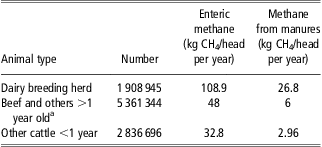
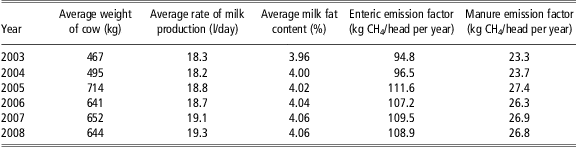
The national reporting of GHGE from dairy cattle is based on guidelines and equations set out by IPCC (1997) using what is termed the ‘National Inventory’ of cattle. Emissions were estimated from animal population data collected in the June Agricultural Census and published in Defra (2009) and the appropriate emission factors (Table 2). The dairy cattle emission factors were estimated following the IPCC Tier 2 procedure (IPCC, 1997) and vary from year to year. The base data and emission factors for cattle for 2003–2008 are given in Table 3. The reporting mechanism means that it is not possible to separate out the CH4 and N2O emissions and fully attribute them to dairy cattle production; for example, all young dairy cattle stock are grouped with beef cattle stock. For the purpose of clear comparisons, this section focussed on the methane produced by enteric fermentation and manure in milking dairy cows only. A more detailed inventory of dairy cows was constructed on the basis of 2008 national statistics, and the effect of varying this on overall dairy emissions was calculated.
Data used in UK National GHG Inventory reporting for livestock populations and methane emissions factors by animal type (2008)
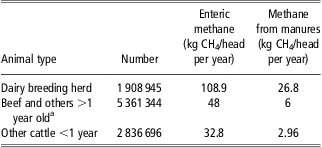
aBeef and others >1 year old include dairy heifers, beef heifers, others >2 and others 1 to 2 years old.
Dairy cattle enteric fermentation methane emission factors used in UK National greenhouse gas Inventory calculations
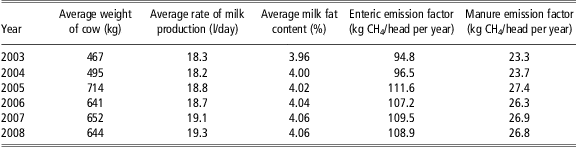
Notes: For 46% of the year animals graze on good-quality pasture; they are housed for the remainder of the year.
Gestation period, 281 days; digestible energy, 740 MJ/kg of dry matter; methane conversion factor as a percentage of gross energy intake, 6%.
Ash content of manure, 8%; methane-producing capacity of manure, 0.24 m3/kg of volatile solids.
The methane emission factors for the alternative lactation lengths derived from the first part of this study were applied to the national greenhouse gas reporting framework, assuming that the total number of cows in each class of lactation length was known. Variations in the proportion of cows in the lactation length categories were modelled by increasing or decreasing them by 10% to see the effect on national GHGE. This highlighted how inventory reporting mechanisms could be easily updated to consider a wider range of animals if more details were used, as opposed to total census numbers only.
Results
Lactation length scenarios
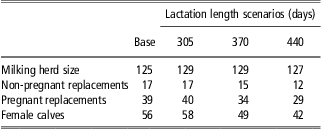
Results from the analysis of lactations of different lengths from national data were used to parameterise the model of dairy system GHGE. The main differences between the base scenario (as described in Appendix Table A1) and the alternative lactation lengths are given in Table 1. Running the model to produce the current level of national milk output resulted in different herd structures for the four scenarios studied (Table 4). As lactation length increased over the three lactation length scenarios, most categories of animals decreased in number; however, the relative decrease in milking cow numbers was much less than for the other categories of animal. In relation to the base scenario, all lactation length scenarios required more milking cows and the two longer lactation length scenarios required fewer replacements and calves.
Mean average UK national herd structure results from the model of four lactation length scenarios (number of animals)
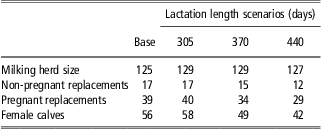
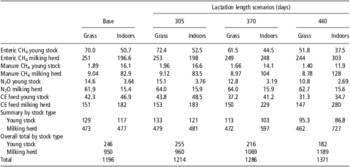
Results in Table 5 show that as lactation length increased the overall annual GHGE also increased. As lactation length increased, the proportion of the total herd emissions that came from the follower animals decreased. About 10% of total system emissions came from enteric fermentation from the replacements in the herd in the base scenario. This decreased to 6.5% when the average lactation length was 440 days. However, as lactation length increased, the proportion of GHGE from milking herd enteric fermentation increased from 37.4% in the base scenario to 39.9% when lactation length was 440 days.
Output from the model of the average UK National herd overall system emissions for alternative lactation lengths, assuming a replacement rate of 25.8%, quantifying the total amount of greenhouse gas emissions from alternative sources, expressed in tonnes of CE per year

CE = CO2 equivalents.
Sensitivity analysis
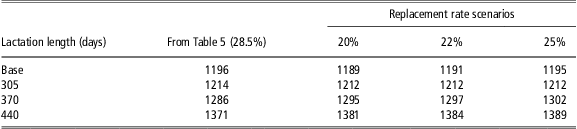
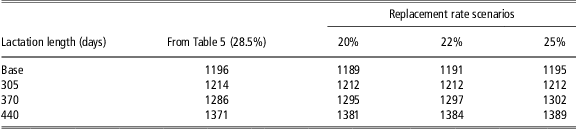
Table 6 shows the overall system GHGE for the differing lactation lengths with different replacement rates and indicated that as the replacement rate increased the overall system emissions also increased. This was a result of requiring more replacement animals to meet the requirements for new cows entering the milking herd. However, the overall increase in emissions with increasing replacement rates was relatively small, increasing approximately 0.5% when replacement rate changed from 20% to 25%. For a herd based on 305-day lactations, overall GHGE did not change for herd replacement rates of 20%, 22% and 25%. In each of these replacement-rate scenarios, a total of 129 cows were required to maintain milk yield, with 33 first lactation cows assumed to enter the herd. These 129 cows would need to produce 40 replacement heifers every year, and therefore the herd profile, and associated GHGE losses/gains, did not alter.
Overall system greenhouse gas emissions for the average UK National herd with different lactation lengths (base – 305, 370 and 440 days) and different replacement rates (20%, 22% and 25%) expressed in tonnes of CO2 equivalents
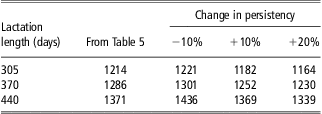
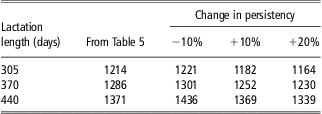
The impact of lactation persistency was investigated by altering the persistency level of the representative lactation curve for each lactation class, as detailed above and shown in Appendix Tables A3 to A6. The results show (Table 7) that altering the persistency of the lactation curve had a minor impact on the overall GHGE from a dairy system producing a fixed annual yield. Improving the persistency of lactation by 10% reduced the GHGE from the dairy system by a negligible amount for cows with lactation length of 440 days and by 3% for cows with lactation lengths of 305 and 370 days. Increasing persistency by 20% decreased the GHGE by ∼3.3% for cows with lactation length of 440 days and 4.5% for cows with lactation lengths of 305 and 370 days. Reducing the persistency of the lactation curve by 10% resulted in a small increase in overall system emissions of <1% for cows with lactation length of 305 and 370 days. However, decreasing the persistency of a cow lactating for 440 days increased system emissions by 3.8%.
Total average UK National herd greenhouse gas emissions from alternative lactation lengths with changes in persistency levels, expressed in tonnes of CO2 equivalents per year
There was also a variation in the total lactation yield within each of the lactation lengths. A further study examined the impact of this variation of total lactation yield on the predicted system emissions. This was done by modelling the overall system emissions, at fixed annual milk volume output, of the top and bottom 10% milk yield cows in each of the lactation length categories. Table 8 shows that the difference between the bottom 10% and top 10% for overall lactation yield, within lactation length, was wide. However, the fat% for higher yielding cows was always lower in the top-yielding lactations compared with the lower yielding lactations, averaging at 4.18% for lower yields and 3.71% for higher yields. This would suggest that, although herd milk volume could be maintained with far fewer cows at the higher yields, overall milk solid %, as represented by fat%, would be reduced.
Total average UK National herd greenhouse gas emissions (tonnes of CE/year) and number of cows in the milking herd from the top and bottom 10% milk yields for alternative lactation lengths

CE = CO2 equivalents.
The results show that for lower yields the annual GHGE from the system increased significantly (compared with Table 5). For the lower yields within lactation class, it was expected that overall emissions would increase by between 19% (440 days) and 29% (370 days) compared with 305 days. This was largely as a result of the increase in milking cow numbers, and the subsequent replacements, required to maintain overall herd output. For the higher yields within lactation length class, it was found that overall system emissions decreased by between 14% (440 days) and 25% (305 days). This was also due to the change, in this case decrease, in the size of the milking herd to maintain the total annual milk output. It should be noted that the percentiles examined here are the extremes of the yield distributions within lactation length class and that they were the exception rather than the norm. To achieve high yields such as these would take a number of generations of genetic selection. Other options to achieve such yield improvements, via nutritional or management interventions, would not only have financial implications, but also likely have an emission cost in their own right.
Impact in terms of national emissions
Table 9 shows that the methane emission factor (enteric fermentation and manure) varied when recalculated for cows with different lactation lengths. The emission factors in all scenarios studied were higher than those currently used in the UK inventory. This does not reflect a real difference in the emissions from these dairy cows but rather highlights how the different calculations and presentation methods could result in different messages about the overall GHGE from a dairy system.
Methane emission factors derived for cows of different lactation numbers in the three lactation-length and base scenarios
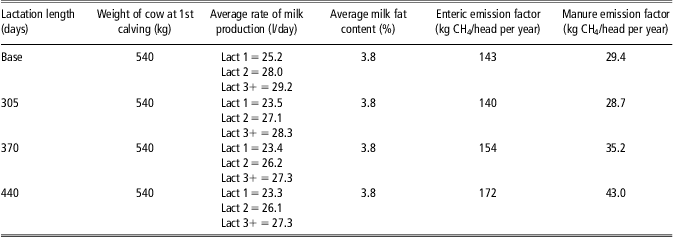
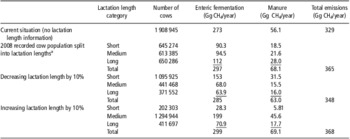
Table 10 describes the proportion of milk-recorded cows that could be assigned to the three different lactation lengths based on the number of milk-recorded cows. To allow for a fair comparison, the total amount of methane produced under a methodology akin to the current inventory was calculated on the basis of the emission factors estimated from the base scenario in this study, as opposed to values currently used in the national inventory reporting. Assuming the base scenario, when cows were not subdivided into different lactation lengths, the overall methane emission from the milking (breeding) dairy herd was 329 Gg CH4 per annum. The proportions of the cows in each lactation class were based on the number of milk-recorded cows in each lactation length class. Assuming that the proportion of milk-recorded cows in each lactation length is representative of the entire milking herd, the methane emissions attributable to the milking herd would be estimated to be 365 Gg CH4 per annum, 11% higher than the estimate when cows are not subdivided by lactation length. The impact of increasing the proportion of cows in shorter/longer lactations was also shown to affect the estimation of GHGE. Such an approach could help to highlight how inventory methodologies could be adapted to present estimates of emissions on a finer, and more accurate, level.
Derived UK National Inventory dairy cattle methane emission results for cows with different lactation lengths

aShort <345 days; medium 346–405 days; long >406 days.
Discussion
The objective of this research was to determine whether the use of extended lactations in dairy herds would lead to a reduction in GHGE, as suggested by Hopkins and Lobley (Reference Hopkins and Lobley2009, p. 34). This work was based on recorded data, and thus the individual farmer's motivation for having lactations of different lengths was unknown. Therefore, the analysis was based on what has been observed without any way of dividing lactations into those that were longer because of (a) the difficulty of rebreeding or (b) a conscious decision by the farmer to delay mating. This would only be an issue if it were possible to demonstrate that cows in these two categories had different lactation characteristics. It should be noted that the extended lactations that currently occur on UK dairy farms could be different from a theoretical extended lactation, which may have an equal (or lower) peak milk yield in early lactation but a flatter curve as the lactation extends. In the UK data, it appears that the early and peak milk yield is slightly higher in the extended lactation group of herds, thus confounding milk yield with longer total days of lactation. The data were used to model the ‘average’ UK dairy farm and to investigate the GHGE changes likely under a range of extended lactation scenarios, with the inputs to the model being based on a review of the literature and an analysis of records from UK dairy farms (Pollott, Reference Pollott2011). This is the first time that modelling extended lactations has been reported as a possible means of changing GHGE.
Lactation length and GHGE
The starting point to discuss the results is Tables 4 and 5, which compared the GHGE from the herds having 305-, 370- and 440-day lactations, all having lactation characteristics based on results from analysing milk-recorded herds. This comparison suggested that a herd based on extended lactations (440-day lactation length) would have increased GHGE compared with the other two scenarios, ∼13% more than the base scenario. These comparisons were made on the basis that the current annual milk yield, fertility and longevity within the herd were maintained. The extended lactation scenario resulted in a smaller dairy herd and fewer replacements, but the reduced emissions from the replacements were far outweighed by the increase in emissions from the milking herd. As milk yield in the last 6 months of the extended lactation was relatively low, compared with the first 12 months, the milk produced during the last 6 months of an extended lactation was the least efficiently produced, in terms of GHGE. Another way of looking at this would be to consider the amount of milk produced per kg of cow liveweight. The GHGE were related to both milk output and the maintenance requirements of the cow. As the energy requirements for maintenance and body reserves increase slightly in late lactation and milk yield dropped, the amount of GHGE per kg milk produced increased; as overall milk yield was set to remain the same in all scenarios, more GHGEs were produced from longer lactations.
A further factor adding to the increase in GHGE with longer lactations was due to the fat% of milk. Fat% rose as lactations progressed and longer lactations had higher fat% than shorter ones. Fat% was also related to GHGE such that higher-fat% milk generated higher levels of GHGE. Thus, milk produced in late lactation contributed more to GHGE than early-lactation milk.
As energy from the feed was a critical factor in both the maintenance and fat% calculations, it is not surprising that the greatest increase in GHGE can be seen in the milking herd data from both enteric fermentation and feed sources.
Given the discussion above, the results from the two shorter lactation lengths modelled were similar; shorter lactations resulted in a larger herd size but reduced overall emissions. In comparison with the 440-day lactation length results, the 370-day lactation length scenario produced 6% less GHGE and the 305-day scenario 11% less.
The results in Tables 4 and 5 also show how the three lactation length scenarios modelled compared with the ‘base’ situation, currently used to model the selection index calculations in the United Kingdom. All three new scenarios resulted in a larger milking herd and produced greater GHGE.
Sensitivity of replacement rate
Several authors suggest that the use of extended lactations may lead to greater longevity in dairy cows (Allore and Erb, Reference Allore and Erb2000; Knight, Reference Knight2008). Greater longevity would be reflected in lower replacement rates, and thus alternative scenarios were modelled looking at a range of replacement rates (Table 6). Reduced replacement rates resulted in lower levels of GHGE, but the change was relatively small. For example, in the 440-day lactation length scenario a reduction in replacement rate from 25% to 20% only reduced GHGE by 0.05%.
Sensitivity of persistency
Alternative scenarios were investigated to see how GHGE varied with a change in lactation persistency. Improving persistency by 10% or 20% resulted in reduced GHGE, but this reduction was once again small. An increase of 10% and 20% in persistency for the 440-day lactation length scenario resulted in a 0.02% and 2.4% reduction in GHGE, respectively. At shorter lactation lengths, this reduction in GHGE was greater but still <5% compared with the current situation.
Effect of milk yield on GHGE
The most dramatic changes in GHGE were seen when comparing herds performing at the various mean milk yield levels (Table 8); emissions were about 50% higher from the bottom 10% herds compared with the top 10% herds. This difference remained constant over all lactation lengths. If herds using extended lactations reached the level of performance in the top 10% of herds, then their GHGE would be the same as the current base herd scenario. The level of milk yield in such herds was 14 867 kg per lactation and cow numbers were reduced from 127 to 97 in this scenario. Our results reflect those of Garnsworthy (Reference Garnsworthy2004) who showed a drop in GHGE as annual milk yield increased and fertility improved.
National Inventory reporting methods
The IPCC guidelines for National Inventory reporting (IPCC, 2006) use a single emission factor for all dairy cows and include young stock as part of the beef herd. They also include N2O emissions as part of the soil contributions rather than the dairy herd. This study has investigated the effect on GHGE figures when a more detailed set of scenarios are examined.
The contribution of young stock to GHGE decreased as lactation length increased from about 21% in the 305-day scenario to 13% at 440 days. This was due to both a reduction in the number of young stock and an increase in the GHGE of the milking herd as lactation length increased. As young stock emissions in the National Inventory are based on numbers, these changes would be reflected in the final national figures.
The amount of CE derived from N2O emissions from the manure produced by the dairy herd for the three scenarios was 98 t (305-day), 96 t (370-day) and 92 t (440-day). It is important to note that the carbon equivalent costs of producing grass is contained in the CE value for the type of diet rather than separated out into N2O and methane emissions for on-farm pasture management. Clearly, lactation length did affect emissions from this source, but the scale of the differences was small and thus could probably be ignored in National Inventory calculations.
Methane emission factors for dairy cows being managed in different lactations were derived from the results generated in the first part of this study. Data from the 2008 recorded cow population were used to calculate National Inventory emission values for dairy cows. The current method for National Inventory calculations underestimated GHGE by about 10%. As there is no complete data set of lactation length information for all UK dairy cows, two further scenarios were modelled assuming that there was a 10% increase or decrease cows' lactation length. Both new scenarios still produced more GHGE than the current model, and the scenario with longer lactations produced more GHGE. National Inventory methodology could be improved to reflect a more realistic estimate of GHGE by accounting for lactation length in the models.
Conclusions
The current research has found that a change from the current lactation length to an extended lactation of ∼440 days is unlikely to lead to a reduction in GHGE. Both improved persistency and longevity do have an effect to reduce GHGE in longer lactations, but their ability to make substantial inroads into GHGE reduction is small. The modelling work carried out in this study indicates that increased milk yield is the most likely method by which GHGE can be reduced for any given level of output from the UK dairy herd. Substantial increases in yield have been achieved over recent years and this has been linked to reduced fertility and longer lactations. Recent studies have shown that continuing reduced fertility as milk yield increases is not inevitable, and that the United Kingdom (DairyCo, 2010), Ireland (Kearney, Reference Kearney2007) and United States of America have all demonstrated a halt to declining fertility in recent years, by positive selection for increased fertility. Selection for higher yields will result in reduced persistency unless a positive move to select for increased persistency is incorporated in selection programmes. This may be achieved using the parameters already calculated as part of the national genetic evaluation process or by using parameters such as the relative rate of cell death, which arise from applying a biological model to lactation analysis. Increased yields could also be achieved by moving to three-times-per-day milking. Although the prime objective of this project was to estimate the effect of moving to extended lactations on GHGE from the UK dairy herd, there may be a number of other interesting side effects from extended lactations. These include the possibility of using a more welfare-friendly system having improved animal health, less culling from health- and fertility-related problems and hence greater longevity, and the possibility of no loss in economic returns. Of course all these aspects require more research but they may prove to be useful incentives for future research on extended lactations.
Acknowledgements
This work was carried out as part of a Defra-funded project ACO223 ‘Extended lactations to reduce greenhouse gas emissions from dairy cows’. National Milk Records Ltd are acknowledged for supplying the data used in this study.
UK dairy herd performance data used for modelling the base scenario

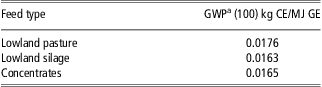
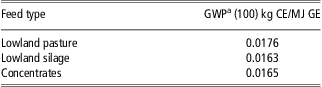
Greenhouse gas emissions associated from dairy feed types
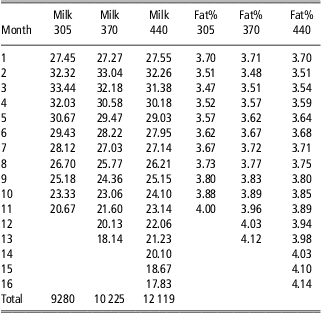
Original data derived from recorded herds showing milk yield in kg/day and milk fat content (fat%) for lactations with three different lactation lengths (305, 370 and 440 days)
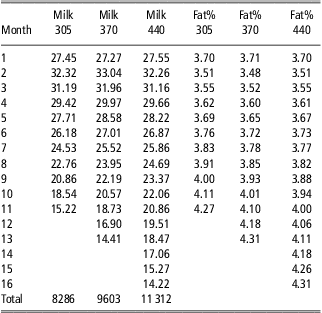
Milk yield (kg) and milk fat content (fat%) data with a 10% reduction in persistency for three lactation length scenarios (305, 370 and 440 days)
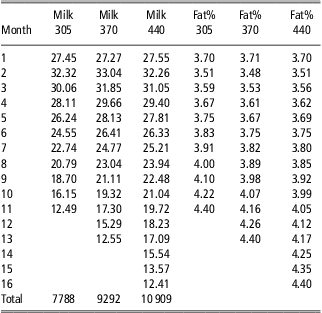
Milk yield (kg) and milk fat content (fat%) data with 10% improvement in persistency for three lactation length scenarios (305, 370 and 440 days)
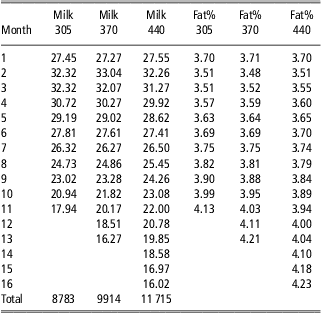
Milk yield (kg) and milk fat content (fat%) data with 20% improvement in persistency for three lactation length scenarios (305, 370 and 440 days)