Introduction
Human neurocysticercosis is an infection of the central nervous system (CNS) caused by oral ingestion of Taenia solium eggs (oncospheral stage). In theory, after ingestion, the eggs lose their shells due to the effect of the low pH of gastric juices and are activated in the duodenum by bile and pancreatic juices. Activated oncospheres may break and shed their envelopes, as described in an in vitro study (Molinari et al., Reference Molinari, Tato, Lara-Aguilera and White1993). They may then invade the intestine, as occurs with Hymenolepis nana oncospheres (Miyazato et al., Reference Miyazato, Furukawa, Inouem, Niwa, Inoue and Shimoda1977); from there, they travel through the bloodstream to several other tissues, including the central nervous system (CNS). Once in the CNS, oncospheres develop progressively into the metacestode stage.
Among the most frequently reported symptoms in human neurocysticercosis are seizures, headaches and neurological deficits. However, the neurological deficits caused by T. solium in humans have not been fully examined, particularly depression syndromes; moreover, cognitive impairments may be much more prevalent than previously thought in patients with neurocysticercosis. Signs of psychiatric disease and cognitive decline have been reported in 65.8% and 87% of patients, respectively (Forlenza et al., Reference Forlenza, Filho, Nobrega, dos Ramos Machado, de Barros, de Camargo and da Silva1997). These authors also detected attention deficits in all of the patients and altered memory in 25% of the patients in a pathologically heterogeneous sample of 38 patients with neurocysticercosis. Additionally, they found that the active disease and intracranial hypertension were associated with higher rates of psychiatric morbidity and mood disorders, which were strongly related to existing depression. However, this previous study was limited because it did not include control populations. An ideal control group would include patients with a parasitic infection that does not directly involve the CNS.
Recently, Morales-Montor et al. (Reference Morales-Montor, Picazo, Besedovsky, Hernández-Bello, López-Griego, Becerril-Villanueva, Moreno, Pavón, Nava-Castro and Camacho-Arrollo2014) identified correlations among T. crassiceps infection, altered short-term memory and altered levels of neurotransmitters and cytokines in the mouse hippocampus. Using T. solium metacestode in vitro secretions obtained from cysticercotic pigs, a ‘fraction’ of low molecular weight has been isolated, which significantly induced down-modulation of human and mouse T-cell proliferation and cytokine production when stimulated with lectins (Molinari et al., Reference Molinari, Tato, Reynoso and Cázares1990; Arechavaleta et al., Reference Arechavaleta, Molinari and Tato1998; Hernández-Mendoza et al., Reference Hernández-Mendoza, Molinari, Garrido, Cortés, Solano, Miranda and Tato2005).
These findings suggest that the psychopathology observed in human neurocysticercosis must have an organic basis, which might be induced by a low molecular weight fraction secreted by the parasite in its vesicular stage during the infection; thereafter, this fraction may migrate and damage cells in several tissues. Previously it has been reported that both T. crassiceps infection and a low molecular weight fraction (metacestode factor (MF)) isolated from secretions of T. crassiceps metacestodes induced severe histopathological damage, mainly extensive apoptosis, in mouse testis, ovary and spleen cells (Zepeda et al., Reference Zepeda, Copitin, Solano, González, Fernández, Tato and Molinari2011a, Reference Zepeda, Tirado, Copitin, Fernández, Tato and Molinarib, Reference Zepeda, Tirado, Copitin, Fernández, Tato and Molinari2015; Solano et al., Reference Solano, Zepeda, Copitin, Fernández, Tato and Molinari2015). However, given that human neurocysticercosis appears to be associated with cognitive deficits, including memory impairments, studies that investigate the involvement of memory-related areas in neurocysticercosis are needed. Thus, the purpose of the present research was to study the effects of intraperitoneal infection of mice with T. crassiceps metacestodes and of the subcutaneous inoculation of mice with T. crassiceps MF on hippocampal cells, as a model of human cysticercosis. We hypothesized that the cellular death (apoptosis) induced by the T. crassiceps MF would occur in regions involved in some forms of learning and memory, and other hippocampal functions, which would provide new insight into the neurological deficits observed in human neurocysticercosis.
Materials and methods
Treatment of mice
Balb/c female mice (28 days old; 20–22 g) were maintained under standard animal housing conditions with access to Purina chow and water ad libitum. Taenia crassiceps metacestodes (WFU strain) were maintained in our laboratory via peritoneal passage in female mice, as described previously (Everhart et al., Reference Everhart, Kuhn and Zelmer2004). Peritoneal fluids from healthy female control and T. crassiceps metacestode-infected mice were obtained following a previously described method with slight modifications (Zepeda et al., Reference Zepeda, Tirado, Copitin, Fernández, Tato and Molinari2011b). Briefly, after 9 days of infection with up to 40 T. crassiceps metacestodes, all mice were anaesthetized with pentobarbital. The peritoneal cavity of each mouse was washed with 8 ml of 50 mm sterile phosphate-buffered saline (PBS) through a small laparotomy. Peritoneal fluids were centrifuged at 4000 rpm at 4°C for 10 min, and the supernatants from each group were pooled, filtered through Millipore membranes (0.22-μm pore), lyophilized, and stored at 4°C until use.
Batches of 45 mg (dry weight) of each peritoneal fluid pool were diluted in PBS buffer (15 ml, adjusted to 2.0 optical density units at a wavelength of 280 nm) and loaded on to a Sephadex G-50 G column (1.5/90 cm; Pharmacia, Uppsala, Sweden). The material was eluted with PBS buffer and collected in 4.0-ml fractions. Fractions containing MF were pooled, as were the corresponding fractions from the control peritoneal fluids (CPFs). The pooled fractions were lyophilized and stored at 4°C until use. The carbohydrate and protein concentrations of both the CPF and MF fractions were determined following the anthrone and Bradford methods, respectively (Ashwell, Reference Ashwell, Colowick and Kaplan1957; Bradford, Reference Bradford1976). To determine the effects of infection with T. crassiceps metacestodes and MF treatment on the hippocampal cells in vivo, 15 female mice were divided into three groups. Each animal was inoculated with its respective treatment every 4 days for 45 days. The control group (n = 5) and MF group (n = 5) were inoculated subcutaneously with 0.1 ml CPF or MF (containing 50 μg of carbohydrates), respectively (the CPF and MF had previously been filtered through a 0.22-μm Millipore membrane). The infection group (n = 5) was infected intraperitoneally with up to 40 T. crassiceps metacestodes, measuring 2–3 mm in diameter, suspended in 0.2 ml PBS.
Histology and cellular apoptosis
At 45 days post-treatment and infection, all mice were anaesthetized with pentobarbital and perfused transcardially with saline followed by phosphate-buffered 10% formalin. Then the brains were carefully removed. Two coronal cuts were made in each brain: an anterior cut was made at Bregma −1.43 mm and the other cut was made at Bregma −5.19 mm (Paxinos & Franklin, Reference Paxinos and Franklin2013). The central sections located between the cuts made in each brain were fixed with 2.5% paraformaldehyde in PBS for 12 h at room temperature. Next, each central section was embedded in paraffin. Coronal sections of thickness 5 μm were prepared on a rotary microtome, placed on poly-l-lysine-coated microscopic slides, and subjected to haematoxylin/eosin staining in order to localize the dentate and CA1–CA3 regions.
The presence of DNA strand breaks in the 5-μm thick paraffin-embedded mouse-brain cross-sections were evaluated using terminal deoxynucleotidyl transferase-mediated dUTP nick-end labelling (TUNEL) assays. The incorporated fluorescence was detected by anti-fluorescein antibody Fab fragments from sheep and conjugated horseradish peroxidase (POD) using an in situ cell death detection kit, POD according to the principles described by Gavrieli et al. (Reference Gavrieli, Sherman and Ben-Sasson1992) and the manufacturer (Roche, Salt Lake City, Utah, USA). New sections were evaluated for TUNEL assays using an in situ cell death detection kit (Roche). TUNEL assays were analysed with a confocal microscope Leica TCS-SP5 (Carl Zeiss de México-División Microscopía, México, DF).
Data analysis
The number of TUNELPOD-stained nuclei was measured by manual counting (cells/mm2) with the aid of ImageJ software (National Institutes of Health, Bethesda, MD, USA; http://imagej.nih.gov/ij/, 1997–2012). Cells of the three groups of mice were counted in selected areas of 1 or 3 mm2 of every hippocampal section. For statistical analysis, one-way analyses of variance were performed to compare the mean number of apoptotic cells from mice infected with T. crassiceps metacestodes or MF-treated mice with the mean number of apoptotic cells from control mice. The statistical analysis was performed using Graphpad software (GraphPad Instat, San Diego, California, USA), and P < 0.05 was considered significant.
Results
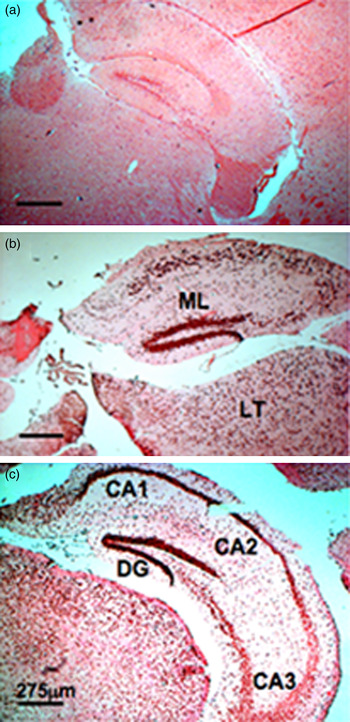
To provide histological information on the location of the apoptosis, DNA strand breaks were labelled using fluorescein-dUTP to evaluate DNA fragmentation (TUNEL), with the addition of a secondary anti-fluorescein POD-conjugated antibody (TUNELPOD). Results of the latter assay showed a high number of apoptotic cells in the three layers of the dentate gyrus (molecular layer, granular layer and polymorphic layer or hilus) and in cells from the CA1, CA2 and CA3 regions, and other neighbouring areas (likely in laterodorsal thalamic nuclei among others; Paxinos & Franklin, Reference Paxinos and Franklin2013, Fig. 43), in mice infected with T. crassiceps metacestodes and in mice inoculated with T. crassiceps MF compared to the apparently intact hippocampal cells of control mice (fig. 1).
TUNELPOD-stained brain sections that contain the dentate gyrus (DT), CA1, CA2, CA3, and hippocampal molecular layer (ML) from control mice (a), mice infected with Taenia crassiceps metacestodes (b), and mice inoculated with T. crassiceps metacestode factor (c). LT, Laterodorsal thalamic nuclei. Scale bar = 275 μm.

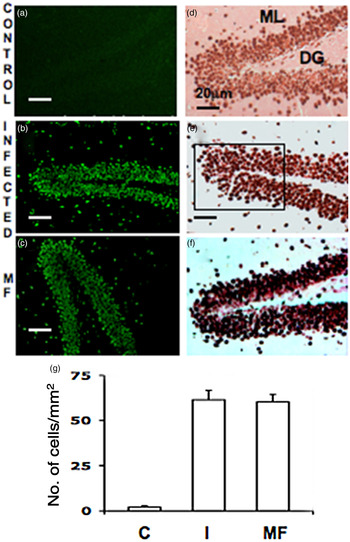
In a second analysis, apoptotic cells were initially identified by a TUNEL-positive assay and then by TUNELPOD-positive assay (fig. 2). In the sections stained with the TUNELPOD assay, only strongly stained apoptotic cells were counted in 3-mm2 areas of the principal cell layer or granule cell layer of a dentate gyrus. In these selected areas, significant numbers of apoptotic cells/mm2 were found in mice infected with T. crassiceps metacestodes and in MF-treated mice compared to the number of apoptotic hippocampal cells in control mice (P < 0.01 for both) (fig. 2).
TUNEL- (a–c) and TUNELPOD-stained (d–f) brain sections that contain a portion of the granular cell layer of dentate gyri (DG) from control mice (a and d), mice infected with T. crassiceps metacestodes (b and e) and mice inoculated with T. crassiceps metacestode factor (c and f). Area of rectangle in E = 3 mm2. ML, Hippocampal molecular layer. Scale bars = 20 μm. (g) The bars represent mean ± SD of apoptotic cells/mm2 of control mice (C), mice infected with T. crassiceps metacestodes (I) and mice inoculated with T. crassiceps MF (MF). P < 0.01, I and MF versus C.

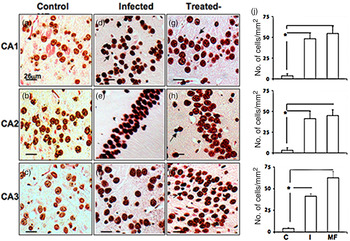
In the CA1, CA2 and CA3 regions, apoptotic cells were counted in 1-mm2 areas. The results showed that there were significantly more apoptotic cells (P < 0.01) in these three regions in experimental mice compared to the limited number of apoptotic cells in these regions in control mice (fig. 3). It should be noted that although extensive apoptosis was observed bilaterally in the hippocampus of each experimental mouse, the statistical data were calculated from only one hippocampus per mouse per group.
TUNELPOD-stained brain sections that contain part of the CA1, CA2 and CA3 regions from control mice (a–c), mice infected with T. crassiceps metacestodes (d–f) and mice inoculated with metacestode factor (g–i). Each micrograph has an area of 1 mm2. Arrows indicate apoptotic bodies. Scale bars = 26 μm. (j) The bars represent mean ± SD of apoptotic cells/mm2 in CA1, CA2 and CA3 regions from control mice (C), mice infected with T. crassiceps metacestodes (I) and mice inoculated with T. crassiceps MF (MF). * P < 0.01.

Discussion
In the present study, intraperitoneal infection of mice with T. crassiceps metacestodes led to generalized apoptosis of hippocampal cells and the surrounding neurons. This same pathological picture was also induced in mice that were subcutaneously inoculated with T. crassiceps MF. These results suggest that the intraperitoneally injected metacestodes may have secreted MF into the peritoneal cavity, then MF migrated via the bloodstream and induced the observed unspecific, generalized apoptosis of hippocampal cells and cells in other neighbouring areas. Almost all of the cells in the three layers of the dentate gyrus appeared to be affected, as were many of the cells in the CA1, CA2 and CA3 regions of the hippocampus from both experimental groups.
Neurogenesis in the brains of adult mammals occurs throughout life, and has been demonstrated at two locations under normal conditions: the subventricular zone of the lateral ventricles and the subgranular zone of the dentate gyrus in the hippocampus. Neurons born in the adult subgranular zone migrate into the granule cell layer of the dentate gyrus and become dentate granule cells. These cells may be required for certain forms of learning and memory (Shors et al., Reference Shors, Miesegaes, Beylin, Zhao, Rydel and Gould2001; Zhao et al., Reference Zhao, Deng and Gage2008). Granular cells are the principal cell type in the dentate gyrus, and since granular cells project only to CA3, all theories concerning the functions of the dentate gyrus must ultimately describe how granular cell activity affects CA3 information processing. Adult neurogenesis continuously adds new cells to the dentate gyrus and induces structural plasticity in mature neurons, including mature granule cells, hilar mossy cells and interneurons, as well as the presynaptic terminals of entorhinal inputs and postsynaptic sites on CA3 neurons (Christian et al., Reference Christian, Song and Ming2014). The results of the present study indicate that significant generalized apoptosis of hippocampal cells might affect neurogenesis, which may lead to impairments in learning and memory, and to depressive states.
Moreover, cytokines that are present in the dentate gyrus have been linked to memory impairments. Interleukin-1 (IL-1) receptors are localized in the granule neurons of the hippocampal dentate gyrus (Ban et al., Reference Ban, Milon, Prudhomme, Fillion and Haour1991). Morales-Montor et al. (Reference Morales-Montor, Picazo, Besedovsky, Hernández-Bello, López-Griego, Becerril-Villanueva, Moreno, Pavón, Nava-Castro and Camacho-Arrollo2014), using the forced swimming test, found that intraperitoneal T. crassiceps infection altered the mood and short-term memory of mice, and affected the neurotransmitter and cytokine levels in the mouse hippocampus; serotonin levels decreased by 30% in the hippocampus of infected females whereas noradrenaline levels increased significantly in infected males. The hippocampal expression of Il-4 increased in infected females and decreased in infected males. Moreover, the authors suggested that the changes in cytokine expression in mice chronically infected with T. crassiceps are likely to be caused by modulations of steroid levels, and that the region-specific changes in cytokine expression may explain the behavioural disruptions. The results of the present study using the T. crassiceps-infected mouse cysticercosis model suggest that, in human neurocysticercosis, the T. solium MF may induce structural damage in hippocampal cells, as such damage was observed in the hippocampal cells of mice infected with T. crassiceps metacestodes and in mice inoculated with T. crassiceps MF, which may explain, in part, the diverse neuropsychiatric symptoms observed in patients with neurocysticercosis (Forlenza et al., Reference Forlenza, Filho, Nobrega, dos Ramos Machado, de Barros, de Camargo and da Silva1997).
Taenia crassiceps MF is a fraction of low molecular weight (<1250 Da) that is obtained from the inflammatory peritoneal fluid of female mice infected with T. crassiceps metacestodes (Zepeda et al., Reference Zepeda, Copitin, Solano, Fernández, Tato and Molinari2011b). This fraction has an absorbance of approximately 260 nm. It is protein-free but contains an oligosaccharide containing glucose among other carbohydrates, and it is able to induce a specific antibody response in rabbits and in mice, which suggests that this factor is produced by the parasite (data not published); its entire structure is currently under study. When T. crassiceps MF is inoculated subcutaneously in male mice, it induces apoptosis of seminiferous tubule cells (Zepeda et al., 2Reference Zepeda, Copitin, Solano, Fernández, Tato and Molinari0011b), while in female mice, it significantly increases ovarian follicle atresia (Solano et al., Reference Solano, Zepeda, Copitin, Fernández, Tato and Molinari2015). Additionally, it induces apoptosis of lymphocytes of white and red pulps from the mouse spleen and significantly decreases splenic CD4+ T cells (Zepeda et al., Reference Zepeda, Tirado, Copitin, Fernández, Tato and Molinari2015). Molinari et al. (Reference Molinari, Tato and Valles1987) reported that T lymphocytes were decreased in naturally cysticercotic pigs and that this decrease was proportional to the parasite load. The present results suggest that in patients with T. solium neurocysticercosis, the neurological deficits in learning and memory, as well the depression syndromes, may be induced by the MF released during the vesicular stage of the parasite. The number of parasites implanted into the host likely influences the degree of severity of the neurological signs and symptoms. Therefore, it is important to develop a diagnostic method to confirm whether patients with neurocysticercosis, who are parasitized with living T. solium metacestodes, develop neurological deficits as a result of hippocampal cell apoptosis.
More studies are needed to establish fully the molecular structure of the T. crassiceps MF and to determine how it induces apoptosis of several cellular lineages. Future studies should also confirm whether the apoptosis of hippocampal cells that was observed here leads to neurological deficits in learning, memory and behaviour, among others. Additional regions to those observed here (thalamic nuclei) must be studied to determine whether other neurological functions are altered. Also, it will be necessary to carry out studies in male mice to determine whether T. crassiceps MF is produced in them and whether this fraction induces the same pathology as that observed in female mice.
Acknowledgements
The authors thank Ruth Rincón Heredia for technical assistance with the confocal microscopy.
Financial support
This research was financed by the Universidad Nacional Autónoma de México.
Conflict of interest
None.
Ethical standards
The authors assert that all procedures contributing to this work comply with the ethical standards of the laws of Mexico on the care and use of laboratory animals. Animal studies were performed under an institutional protocol similar to that of the US Public Health Service: Guide for the care and use of laboratory animals from the Secretariat of Agriculture (SAGARPA NOM-062-ZOO-1999).