


Introduction
Dissolved organic matter (DOM) is a complex mixture of uncharacterized organic molecules including high molecular humic or fulvic acids (Reference Benner, Pakulski, McCarthy, Hedges and HatcherBenner and others, 1992). DOM is generated by biological activity and it contributes to the global carbon cycle, because it serves as a substrate for the microbial food web and will be mineralized to CO2 (Reference Benner, Pakulski, McCarthy, Hedges and HatcherBenner and others, 1992; Reference Amon and BennerAmon and Benner, 1996; Reference Giannelli, Thomas, Haas, Kennedy and DieckmannGiannelli and others, 2001; Reference Vähätalo and LikensVähätalo, 2009). the main DOM-degrading processes are microbial and photochemical decomposition, which supply nutrients for autotrophic organisms (Reference Vähätalo and WetzelVähätalo and Wetzel, 2004; Reference Vähätalo and LikensVähätalo, 2009).
In sea ice, DOM is an important factor controlling the biological processes and the optical properties within and underneath the ice (Reference Thomas, Lara, Eicken, Kattner and SkoogThomas and others, 1995, Reference Thomas2008). Sea-ice DOM can originate from parent water (Reference Giannelli, Thomas, Haas, Kennedy and DieckmannGiannelli and others, 2001; Reference Stedmon, Thomas, Granskog, Papadimitriou and KuosaStedmon and others, 2007a), but it can also be autochthonously produced within brine channels or released by mechanical stress on cells (Reference ThomasThomas and others, 2001). In the Baltic Sea, the humic substances from sea water dominate the fluorescence of sea-ice DOM, but a prominent protein-like fluorescence indicates also the autochthonous production of DOM in ice (Reference Stedmon, Thomas, Granskog, Papadimitriou and KuosaStedmon and others, 2007a). Because DOM absorbs radiation in the visible, UV-A and UV-B wavelength ranges, the composition and concentration of optically active chromophoric DOM (CDOM) affects the quality and quantity of light in sea ice and under-ice water (Reference Uusikivi, Granskog and SommarugaUusikivi and others, 2010). the optical characteristics of DOM entrapped in sea ice affect the productivity of autotrophic organisms (Reference Belzile, Johannessen, Gosselin, Demers and MillerBelzile and others, 2000).
Reference Giannelli, Thomas, Haas, Kennedy and DieckmannGiannelli and others (2001) observed an enrichment of dissolved organic carbon (DOC) relative to salts in sea ice grown from artificial sea water. A similar enrichment of DOC relative to salts has been observed in the brackish Baltic Sea ice, where the major inorganic ions also are excluded differently during freezing (Reference Granskog, Leppäranta, Kawamura, Ehn and ShirasawaGranskog and others, 2004). DOMis enriched relative to salts also in the ice of saline lakes (Reference Belzile, Gibson and VincentBelzile and others, 2002). In freshwater ice, the exclusion of DOM is more extensive than in ice formed from saline water, and DOM can be depleted more than salts (Reference Belzile, Gibson and VincentBelzile and others, 2002). It is also known that the magnitude of DOM exclusion depends on the growth velocity of ice (Reference Belzile, Gibson and VincentBelzile and others, 2002). However, little is known about the parameters controlling DOM fluxes between ice and under-ice water during the initial freezing of sea water. It is still unknown, whether the freezing process itself, the fractionation during the ice formation or the condition within the sea ice during ageing affects the quantity or quality of DOM.
This study examined the changes in the quality and quantity of DOM during ice formation in brackish waters under natural and controlled (laboratory) conditions. We related the behaviour of CDOM and fluorophoric DOM (FDOM) to that of inorganic salts quantified as salinity. This salinity-normalized approach allowed us to take into account the difference in physical conditions such as temperature during the ice formation. A variation in temperature causes a large change in brine expulsion and gravity drainage (Reference Niedrauer and MartinNiedrauer and Martin, 1979). By selecting the salinity-normalized approach in this study, we were able to compare the behaviour of DOM to the conservative salinity exclusion used as a tracer for purely physical brine exclusion (Reference Granskog, Kaartokallio, Thomas and KuosaGranskog and others, 2005). We also assessed changes in the molecular size distribution of DOM by liquid chromatography–size exclusion chromatography (LC-SEC) and the spectral slope coefficient of CDOM to specify the alteration of DOM during the formation and the ageing of sea ice.
Material and Methods
Study area
The brackish Baltic Sea with its low salinities of 1–9 has a large catchment area. Unlike the open oceans, the Baltic Sea derives a large proportion of the DOM from terrestrial sources and is therefore characterized by high concentrations of CDOM (Reference Stedmon, Markager and KaasStedmon and others, 2000). Seasonal sea ice forms regularly every winter in the Baltic Sea (Reference Vihma and HaapalaVihma and Haapala, 2009). At salinities higher than 1, Baltic Sea ice includes brine pockets and channels like its polar counterpart (Reference KawamuraKawamura and others, 2001). the porosity of the Baltic Sea is low compared to that of polar sea ice (Reference Meiners, Fehling, Granskog and SpindlerMeiners and others, 2002). the Baltic Sea ice is rich in CDOM, so its optical properties differ from those of polar sea ice (Reference Ehn, Granskog, Reinart and ErmEhn and others, 2004; Reference Uusikivi, Granskog and SommarugaUusikivi and others, 2010).
Experimental design
In this study, we carried out two freezing experiments in a laboratory in 2007 and 2008 (referred to as exp07 and exp08, respectively). Additionally, we examined natural Baltic Sea ice in 2007 and 2008 (referred to as nat07 and nat08, respectively).
Freezing experiment 2007 (exp07)
Sea water was collected from 2 m depth with a Limnos water sampler at the archipelago near Tvärminne Zoological Station (University of Helsinki), located in the northwestern part of the Gulf of Finland. Polyethylene (PE) buckets (washed with deionized water) were filled with 1.5 L of sea water and kept at –17 to –20˚C. After 2 hours, a thin layer of ice formed on the top of the water and on the walls of the buckets. the liquid water was collected into an Erlenmeyer flask by drilling a hole through the formed ice with a battery-operated drill and pre-cleaned drill-bit. the ice was allowed to melt at 5˚C overnight and then filtered along with the water samples through GF/F (glass-fiber F grade; Whatman, nominal pore size 0.7 μm) into a precombusted all-glass filtration device applying low vacuum. Absorption spectra of CDOM and salinity from these samples were analyzed within 2 days.
Tank experiment 2008 (exp08)
The behaviour of DOM during ice growth was studied during a 144 hour long freezing experiment at the Finnish Institute of Marine Research. Surface water from ~5m depth from the central Gulf of Finland (24˚50' N, 59˚51' E) was collected in the last week of January 2008 from R/V Aranda using a flow-through system, and stored at 4˚C in the dark for ~2 weeks. Four tanks were filled with 360 L of unfiltered sea water and circulated by a pump system (150 L h–1). For the purposes of other experiments reported elsewhere, a defined amount of organic carbon was added to each tank as follows: tank A: no addition; tank B: the lysate of cold-water diatom Achnantes taeniata to a final concentration of 16 μgCL–1; tank C: the lysate of cold-water dinoflagellate Scrippsiella hangoei to a final concentration of 100 μgCL–1; and tank D: sucrose to a final concentration of 400 μgCL–1. NO3 concentration was adjusted to the ambient level of tank C (13 μmol L–1) by addition of nitrate to tanks A, B and D. Despite the additions of carbon, there was no significant difference in CDOM, FDOM or the molecular mass of DOM among the tanks (data not shown). Therefore the tanks are treated as replicates in this study.
Sea ice was grown at –5˚C in tanks with isolated heated walls, which allowed ice formation only at the surface of the tanks. the tanks were irradiated with fluorescent tubes emitting 80–100 μmol photonsm–2 s–1 at a spectral range of 400–700nm to the surface of tanks for 6 hours d–1, simulating a day length in February in the northern Baltic Sea. Ice samples were collected after 1 week of ice growth (10–17.5cm ice thickness) with a custom-made miniature stainless-steel ice corer (7cm internal diameter (id), Nordic Ice Drill, Sweden). the ice was allowed to melt at +4˚C in acid-washed PE containers for 24 hours in the dark. Water samples were taken with a 1 L PE bin and stored in the dark in 1 L acid-washed glass bottles at +4˚C until subsampling into 100 mL pre-combusted glass bottles within 2 hours. All samples were filtered with 0.45 μm syringe filters (cellulose acetate, Whatman GD/X) into pre-combusted (450˚C for 3 hours) glass vials. the samples were stored in the dark at +4˚C for 1–3 weeks until further analysis. For LC-SEC analysis, samples were fixed with mercury(II)-chloride (50mgL–1) and measured 18 months after sampling.
Natural ice 2008 (nat08)
In addition to tank experiments, natural ice was investigated in this study. New ice was collected near Tvärminne Zoological Station on 13 February 2008. the ice had formed overnight during <12 hours to a layer ~2 cm thick. Under-ice water was sampled directly into acid-washed glass bottles rinsed several times with the sampled water. Pieces of ice were collected into cooling boxes cleaned with ultrapure water (Milli-Q) and melted at 4˚C in the dark. Ice and water samples were filtered (0.45 μm syringe filters; Pall Acrodisc, Supor membrane) into pre-combusted (450˚C for 3 hours) glass vials and stored in the dark at +4˚C for 1–3 weeks before CDOM and FDOM were measured. Samples for LC-SEC analysis were fixed with mercury(II)-chloride with a final concentration of 50 mgL–1 and measured 18 months after sampling.
Natural ice 2007 (nat07)
Naturally grown ice was sampled on 12 March 2007, from the same location as the young natural ice. the ice was approximately 5 weeks old and 22 cm thick. Ice coring was done using an ice auger (9cm id; Kovacs Enterprises, Lebanon NH, USA). the ice core was cut into three layers and each was kept in pre-cleaned PE buckets in the dark at room temperature to melt overnight. Under-ice water was sampled from the same location, but on 14 March 2007 from 2m depth using a Limnos water sampler (Limnos, Finland). Ice and water samples were filtered after melting through GF/F (Whatman, nominal pore size 0.7 μm) and collected in a pre-combusted all-glass filtration device applying low vacuum. CDOM and salinity measurements were carried out within 2 days.
Analytical methods
Field measurements
Salinities of water and melted ice samples of the tank experiment (exp08) and natural samples (nat08) were measured using a YSI 63 hand-held S/T meter (Yellow Springs Instruments, Yellow Springs, OH, USA) whereas nat07 and exp07 were measured with a Radiometer CDM 83 and reported as practical salinity units. Salinities prior to LC-SEC analysis of the samples from exp08 and nat08 were adjusted with ultrapure water (Milli-Q) to a salinity of 1 and measured with a VWR EC300 conductivity meter.
CDOM absorption
CDOM absorption spectra for all samples were measured using a Shimadzu UV-2101 spectrophotometer in a 10 cm quartz cell over the 200–800nm range in 1 nm increments and with 2 nm slit width. the samples were allowed to warm up to room temperature in the dark before measurement. Three replicates of each sample were measured and corrected with an ultrapure water (Milli-Q) blank at room temperature.
The absorption coefficient, a, at wavelength λ was calculated using

where Aλ is the mean absorbance at wavelength λ.
Spectral slope
Spectral slope coefficient of the CDOM absorption between 300 and 400 nm (Slope300–400) was calculated by a nonlinear regression (Reference Stedmon, Markager and BroStedmon and Markager, 2003) using the ‘Curve Fitting Tool’ of MATLAB (version R2007b, Math-works, US) and the following equation:

The range of the spectral slope was chosen to ensure reliable quantitative CDOM signals with an absorbance of <1 and more than three times the standard deviation between replicates (Reference Twardowski, Boss, Sullivan and DonaghayTwardowski and others, 2004). the spectral slope coefficient of exp08 represents the median value of all four tanks.
Fluorescence of DOM
Fluorescence intensities of samples from 2008 were measured in a 1cm quartz cell with a Varian Cary Eclipse spectrofluorometer over an excitation range of 240–450nm in 2 nm increments while scanning the emission from 300 to 600 nm in 5 nm increments. the slit widths for excitation and emission scans were 5 nm. Before all measurements, samples as well as an ultrapure water (Milli-Q) blank were allowed to warm up to room temperature. Instrumental excitation and emission corrections were derived from excitation spectra of concentrated Rhodamine B solution (3 g L–1 Rhodamine B in ethylene glycol) and an emission spectrum resulting from a ground quartz diffuser (Reference Stedmon, Markager, Kronberg, Slätis and MartinsenStedmon and others, 2007b). an inner filter correction was done as suggested by Reference Mobed, Hemmingsen, Autry and McGownMobed and others (1996), Reference LakowiczLakowicz (1999) and Reference OhnoOhno (2002), and the fluorescence intensity was normalized to the area under the Raman scatter peak of ultrapure water at the excitation wavelength of 350 nm. the excitation emission matrices (EEMs) were also corrected for the Rayleigh scatter by setting the area under the Rayleigh peak to zero (see Reference Stedmon, Markager, Kronberg, Slätis and MartinsenStedmon and others, 2007b; Reference Stedmon and BroStedmon and Bro, 2008).
DOM fluorophores were identified and quantified by parallel factor analysis (PARAFAC) using the N-way toolbox of MATLAB (Reference Stedmon and MarkagerStedmon and others, 2003; Reference Stedmon and BroStedmon and Bro, 2008). From the 14 samples measured, the number of fluorophores was determined by a split-half validation and a residual analysis (Reference Stedmon and BroStedmon and Bro, 2008). the mean maximal fluorescence signals (Fmax) were used for the quantification of fluorophores.
Enrichment factor Dc
For each sample, the CDOM absorption coefficient at 350 nm and the maximal fluorescence intensities of each fluorophore (Fmax), both described here by c, were normalized to the corresponding salinity (c/S). Then the enrichment factor, Dc , for DOM was calculated as
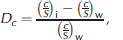
where subscripts i and w refer to ice and water, respectively (modified after Weeks and Ackley, 1982). In Equation (3), the identical behaviour of DOM and salinity results in an enrichment factor of 0.
For Dc of natural samples of nat08, ice samples were related to the under-ice water samples on the sampling day. No Dc value is calculated for nat07, because of missing salinity values in the under-ice water. For the calculation of Dc of experimentally grown ice, the (c/S)w ratio refers to the ‘initial water’.
Molecular-weight distribution
LC-SEC was performed using a silica-based TSK G3000SWxl column (7.8mm×30 cm, pore size = 250Å, 5 μm particle size) and a TSK guard column (7.5mm×7.5 mm) with a Hewlett Packard 1100 series high-performance liquid chromatography (HPLC) instrumentation using ultraviolet (UV) detection at 254 nm. A phosphate buffer (3.58 g L–1 Na2HPO4 and 1.36 g L–1 KH2PO4, ionic strength 20 mM) at pH 6.85 was used as eluent at a flow rate of 0.8 mLmin–1, and a sample (100 μL) was injected to the column at 20˚C (Reference Allpike, Heitz, Joll and KagiAllpike and others, 2005). the retention times of samples were compared to other DOM mixtures or compounds with a known molecular weight. the Nordic fulvic acid reference with the mean molecular weight M w = 2138 g mol –1 was used as a reference at a concentration of 9 mg L–1 (International Humic Substances Society; Reference Hongve, Baann and BecherHongve and others, 1996). Blue Dextran 2000 (Sigma; 100 mg L–1; 2×10⁶ g mol–1) was used as a marker for the high molecular mass fraction, whereas tyrosine (200mg L–1; 181.2 g mol–1) and phenylalanine (100mgL–1; 165.2 g mol–1) indicated the low molecular mass range. A baseline correction was done for all samples by normalizing the chromatogram to the value at 12 min. In this study, the retention time, R t (min), between 12 and 20 min was used directly to describe the molecular size distribution of DOM. the mean retention time (corresponding to the weight-averaged molecular mass of DOM) was calculated as

where hi is the absorbance at 254 nm at the retention time R t,i . In LC-SEC, molecules with large molecular mass have short retention times, and the retention time increases for molecules with decreasing molecular mass.
Prior to LC-SEC analysis, the salinities of under-ice water samples of exp08 and nat08 were adjusted with Milli-Q water to 1, equivalent to the salinity found in the ice samples of exp08.
Results
Quantity of DOM
CDOM absorption
In order to quantify the behaviour of DOM in Baltic Sea ice during initial freezing, a short-term experiment was carried out (exp07). the absorption coefficient of CDOM at 350 nm (a CDOM,350) after 2 hours of freezing was 4.3 m–1 and 1.9 m–1 in the under-ice water and in the melted ice, respectively, and 3.7 m–1 in the initial water sample (Fig. 1a; Table 1). the decrease of a CDOM,350 by 51% in newly formed ice relative to the initial water sample shows that CDOM was partially rejected during ice formation. In the under-ice water, the concentration of a CDOM,350 was elevated by 16% in relation to the initial water. the enrichment factor Dc (Equation (3)) was calculated to compare the fractionation of a CDOM,350 against the behaviour of salinity. the Dc value was 0.34 for ice, but 0 for under-ice water (Fig. 1b). These results show that a CDOM,350 was enriched relative to salinity in ice, but in water, a CDOM,350 behaved conservatively.
Absorption coefficients at 350 nm of natural and experimentally grown sea ice (dark grey bars) and under-ice water (black bars) after 2–840 hours of ice growth. Error bars indicate the standard deviation between replicates (a). the enrichment factor Dc (b) relates the salinity-normalized a CDOM,350 to the pre-freezing conditions in the initial water (grey bars).

Characterization of samples in respect of sample type (experimental or natural ice or under-ice and initial water), sampling site and salinities. Properties of DOM are described by absorption coefficient at 350 nm, a CDOM,350, spectral slope coefficient for the range 300– 400 nm, enrichment factor for maximal fluorescent intensities and average molecular weight. SD: standard deviation; s.i.: significance interval

The behaviour of a CDOM,350 during initial freezing was also measured under natural conditions (nat08). After 12 hours of ice formation, the a CDOM,350 of ice was again lower than in the under-ice water (Fig. 1a; Table 1). the Dc value of ice relative to the under-ice water was even slightly higher than during the freezing experiment, again indicating enrichment relative to salinity (Fig. 1b; Table 1).
We also studied the behaviour of DOM during a longer period of ice growth (exp08). After 1 week of ice growth, the a CDOM,350 of artificial sea ice was 30% of the value in the initial water sample, whereas a 13% increase was found in the under-ice water (Fig. 1a). Again, Dc values showed that CDOM was enriched relative to salinity in ice, but not in under-ice water (Fig. 1b; Table 1). In a 5 week old naturally grown ice (nat07), a CDOM,350 was 37% of that in the under-ice water (Fig. 1a; Table 1).
Fluorescence of DOM
The quantitative enrichment of DOM was additionally assessed by examining the fluorophoric DOM in natural (nat08) and experimentally grown ice (exp08). For these samples, the PARAFAC analysis identified three fluorophores. Fluorophore 1 (C1) had excitation maxima at 240 and 340 nm, with the emission maximum at 484 nm (Fig. 2). Fluorophore 2 (C2) had excitation maxima at 240 and 305 nm, with the emission maximum at 404 nm. Fluorophore C3 had excitation maxima at 240 and 280 nm, with the emission maximum at 340 nm. the fluorescence intensities were more than two times higher in water samples than in the corresponding melted ice samples (data not shown).
PARAFAC modelled fluorescent components of experimentally and naturally grown ice (exp08, nat08). For both datasets, three fluorescent components were identified by PARAFAC modelling. Fluorescence is given in Raman units; note the different scales between the panels.

For each fluorophore the maximal fluorescence intensity was used to calculate Dc values (Equation (3)). In both naturally (nat08) and experimentally grown ice (exp08), fluorophores C1 and C2 were significantly enriched in ice, but not in water samples (Fig. 3; Table 1). Fluorophore C3 is not significantly different in ice and water, reasoned from the 95% significance interval.
The enrichment factor Dc for the salinity-normalized fluorescent maxima of the three fluorophores (Fig. 2) in relation to the pre-freezing conditions in the initial water. A significant difference between Dc of under-ice (ui) water and ice for components 1 and 2 was inferred from the determination of the 95% significance interval. For component 3, no significant difference was found. Error bars indicate the standard deviation between replicates.

Quality of DOM in ice
LC-SEC
We also examined whether freeze fractionation alters DOM in terms of the spectral slope coefficient of CDOM, the composition of fluorophores or the molecular size distribution. the retention times of Baltic Sea DOM were generally larger than those of freshwater fulvic acid (Nordic fulvic acid reference NOFA), but smaller than those of amino acids (tyrosine and phenylalanine) (Fig. 4). the determination of retention time, R t, for DOM by LC-SEC was sensitive to salinity (Fig. 4b). After the dilution of under-ice water to the salinity of 1, the absorbance at 15–16 min decreased and shifted towards shorter retention times.
(a–d) LC-SEC chromatograms of (a) standards; (b) ice and water samples of tank D before and after dilution to salinity of 1; (c, d) water and melted sea ice at a similar ionic strength, directly compared for (c) natural sea ice and (d) experimentally grown ice. Note the different scales. (e) the mean retention time, representing the number average molar mass of DOM in the 12 hour old natural ice (from (c)) and the 144 hour old experimentally grown ice (from (d)).

To overcome the effect of salinity on the R t of DOM, we adjusted the salinity of samples to 1 before examining potential shifts in the molecular size of DOM caused by freezing (Fig. 4c and d). In new natural ice (nat08), the mean R t of DOM was similar in ice and under-ice water (Fig. 4e). the mean R t of DOM was longer in ice than in under-ice water at a salinity of 1 after 1 week of ice growth (Fig. 4e). This result indicates that the molecular size of DOM was smaller in ice than in under-ice water.
Spectral slope
Because the investigation of the molecular size of DOM indicated that the ageing of ice may change the quality of DOM, we examined the spectral slope coefficient of DOM reported in Table 1 in ice relative to that in water along the age of ice (Fig. 5). Over time, this ratio of slopes decreased from 1.04 in 2 hour old ice to 0.85 in 840 hour old ice.
The ratio between the spectral slope (300–400 nm) of ice and the under-ice water plotted over the time of ice growth at a logarithmic scale (linear regression, R 2 = 0.85). the median value of all replicates of exp08 is used. Error bars are calculated from the mean sum of the coefficient of variation of the spectral slope of ice and water of each tank of exp08. the resulting mean error of the ratio (2.5%) was applied to the other datasets.

DOM fluorescence (EEMs)
In order to investigate changes in the quality of fluorescent DOM during freezing, the fluorophores in young natural ice (nat08) and older artificial ice (exp08) were compared to the corresponding water samples. the composition of fluorophores was similar in ice and water (data not shown). Thus, the freeze fractionation of DOM did not change the composition of fluorophores in our sample set.
Discussion
Enrichment of DOM relative to salts
Our study shows that the freezing of Baltic Sea water enriches chromophoric and fluorophoric DOM in ice relative to salts. In our study, the enrichment of CDOM and FDOM in sea ice is similar. This similarity indicates that the observed enrichment of C/FDOM relative to salinity holds also for the bulk DOM as has been found previously for DOC in marine water and brackish waters (Reference Giannelli, Thomas, Haas, Kennedy and DieckmannGiannelli and others, 2001; Reference Granskog, Leppäranta, Kawamura, Ehn and ShirasawaGranskog and others, 2004). When we calculated enrichment factors for CDOM and FDOM according to Equation (3) from the original data presented by Reference Belzile, Gibson and VincentBelzile and others (2002) and Reference Stedmon, Thomas, Granskog, Papadimitriou and KuosaStedmon and others (2007a), the Dc values were also positive, indicating enrichment in the ice of the Baltic Sea and the saline inland waters examined. For freshwater samples studied by Reference Belzile, Gibson and VincentBelzile and others (2002), however, Dc values are negative, i.e. CDOM is depleted relative to salinity in freshwater lakes.
The salinity-dependent enrichment of DOM into ice can be explained by the structural differences between fresh and saline water ice. Reference Malo, Baker and GouldMalo and Baker (1968) and Reference Granskog, Leppäranta, Kawamura, Ehn and ShirasawaGranskog and others (2004) define the minimal salinity of 0.6 for sea-ice-like features such as the formation of liquid inclusions. At salinities more than 0.6, the lamellar (instead of freshwater-planar) ice–water interface allows impurities to be retained in the ice (Reference Eicken, Thomas and DieckmannEicken, 2003). Despite the lower porosity in the brackish water ice, the enrichment of DOM into the Baltic Sea ice proceeds as in the oceanic waters with salinities of 33 (Reference Giannelli, Thomas, Haas, Kennedy and DieckmannGiannelli and others, 2001; Reference KawamuraKawamura and others, 2001).
Our study shows that enrichment of DOM takes place already during the first hours of ice growth. This is too short a time for sea-ice biota to cause any detectable degradation or production of CDOM, at least under the conditions of our study (Reference Vähätalo and WetzelVähätalo and Wetzel, 2004). the instant nature of DOM enrichment indicates that physicochemical processes selectively drain out relatively more salts than DOM, which is retained in the brine channels and inclusions to a larger extent than major inorganic ions. the extent of brine rejection depends on the growth rate of ice being highest at the lowest growth of ice in high freezing temperatures (Reference Weeks, Ackley and UntersteinerWeeks and Ackley, 1986). the ice growth rate controls the extent of brine rejection (Reference Weeks, Ackley and UntersteinerWeeks and Ackley, 1986), being lower at higher growth rates, i.e. lower air temperatures. In this study, the air temperatures range from –5˚C to –20˚C without any apparent effect on the enrichment of DOM. Altogether our study suggests that an enrichment of DOM is a robust abiotic process taking place immediately during initial ice formation.
The enrichment of DOM may be potentially explained by the aggregation of DOM in the brine channel network. When ice forms from natural sea water containing organic matter and planktonic organisms, a brine channel network forms as salts are excluded from the ice crystals. During this process, highly saline brine is also enriched in organic matter, which can form aggregates. Within the brine channels, increased concentrations of DOM and salts, as well as laminar and turbulent shear forces, can promote the aggregation of DOM as described earlier for transparent exopolymer particles, extracellular polymeric substances or marine biopolymer networks in sea water (Reference PassowPassow, 2002; Reference Meiners, Gradinger, Civitarese and SpindlerMeiners and others, 2003; Reference Verdugo, Alldredge, Azam, Kirchman, Passow and SantschiVerdugo and others, 2004; Reference VerdugoVerdugo, 2007; Reference Ding, Chin, Rodriguez, Hung, Santschi and VerdugoDing and others, 2008). If these aggregates of DOM form during the first hours on the surface of brine channels and air inclusions, they can selectively bind more DOM by hydrogen and ionic bonds, the latter found, for example, in cationic complexes (Reference Zhou, Mopper and PassowZhou and others, 1998). the selective binding of DOM into aggregates might explain the faster exclusion of salts compared to DOM and the observed enrichment of DOM already in new sea ice.
Qualitative changes in DOM during freezing
FDOM and spectral slope
Our study indicates that the excitation and emission maxima of DOM fluorophores remain the same in sea ice as in the original sea water. Similarly to our findings, any effects of freezing on DOM fluorescence were not observed by Reference Patsayeva, Reuter and ThomasPatsayeva and others (2004).
Our spectral slopes are in the range (16–21.9 μm–1) reported earlier for CDOM in the Baltic Sea (Reference Ferrari and DowellFerrari and Dowell, 1998; Reference Kowalczuk, Stedmon and MarkagerKowalczuk and others, 2006; Reference Stedmon, Thomas, Granskog, Papadimitriou and KuosaStedmon and others, 2007a; Reference Uusikivi, Granskog and SommarugaUusikivi and others, 2010). In our study, the spectral slopes of CDOM in newly formed ice are similar to that of water. This observation suggests that the freezing process does not change the spectral slope of CDOM. the spectral slope is lower in our 5 week old natural ice than in sea water, in agreement with several earlier observations in natural sea ice (Reference Belzile, Johannessen, Gosselin, Demers and MillerBelzile and others, 2000; Reference Ehn, Granskog, Reinart and ErmEhn and others, 2004; Reference Stedmon, Thomas, Granskog, Papadimitriou and KuosaStedmon and others, 2007a; Reference Uusikivi, Granskog and SommarugaUusikivi and others, 2010). Therefore, our results together with the earlier studies suggest that the freezing process does not change the spectral slope, but the processes taking place in the natural ice after freezing tend to decrease the spectral slope of CDOM.
The autochthonous production of DOM in sea ice can potentially decrease the spectral slope in older natural ice. For example, sea-ice algae produce mycosporine-like UV-protecting pigments, which contribute to the absorption of UV radiation by ice (Reference Uusikivi, Granskog and SommarugaUusikivi and others, 2010). These pigments are water-soluble, can potentially leach into the dissolved phase and cause decrease in the spectral slope of CDOM(Reference Belzile, Johannessen, Gosselin, Demers and MillerBelzile and others, 2000; Reference Uusikivi, Granskog and SommarugaUusikivi and others, 2010).
LC-SEC
When interpreting the molecular size distribution of DOM in this study, it should be kept in mind that our LC-SEC used a UV detection, which fails to detect weakly absorbing DOM such as carbohydrates (e.g. Reference Dittmar and KattnerDittmar and Kattner, 2003). Thus, our results for the molecular size distribution of DOM concern the chromophoric fraction of DOM rather than bulk DOC. Our finding that an increasing ionic strength apparently decreases the molecular size distribution of DOM assessed by LC-SEC agrees with a number of previous studies (Her and others, 2002; Reference Dittmar and KattnerDittmar and Kattner, 2003; Reference Amy and HerAmy and Her, 2004). Our LC-SEC analyses at the constant salinity of 1 indicate that the freezing as such does not change the molecular size distribution of DOM immediately, but the processes in ice can later decrease it.
One potential factor for the decrease in the molecular size distribution of DOM is the freezing damage of cells followed by leaching and microbial processes. Freezing can damage cells, plasma membranes and certain molecular structures (Reference Roos, Leslie and LillfordRoos and others, 1999). In particular, slow freezing is harmful to organic material, and repeated freezing and thawing cycles can hasten the degradation process. the natural circumstances in sea ice are characterized by exactly those slow freezing conditions, rapidly changing temperatures and extreme ionic strength which additionally affect the impact of freezing on organic matter (Reference Giesy and BrieseGiesy and Briese, 1978; Reference Roos, Leslie and LillfordRoos and others, 1999). Freezing can also break down proteins of large molecular size to peptides of low molecular weight and release carotenoids, vitamins, sterols and phospholipids into dissolved forms (Reference Uemura and YoshidaUemura and Yoshida, 1986; Reference Puupponen-PimiäPuupponen-Pimiä and others, 2003). In fish meat, freezing in combination with inorganic salts hydrolyzes and auto-oxidizes lipids (Reference Sikorski, Kolakowska and SikorskiSikorski and Kolakowska, 1990). Thus, there is a possibility that the physical freezing process itself breaks down the polymers of organic matter to low-molecular-weight molecules and contributes to the observed change in molecular size distribution of DOM in ice in this study. As we observed the production of DOM of low molecular size only after 6 days, microbial processing of freeze-fractionation products needs to be considered: transparent products of cell breakage were potentially transformed by microorganisms into chromophoric DOM within 1 week to be detected by UV absorption applied in this study.
The formation of DOM aggregates, which can explain the instant enrichment of DOM relative to salts, should also change the molecular size distribution of DOM. However, our LC-SEC results show that molecular size distribution of DOM is similar in water and in ice that is a few hours old. If the high concentrations of DOM and salts are the primary forces causing the aggregation of DOM within brine channels, the aggregates of DOM can be expected to break apart at the low concentration of DOM and salts in the melted ice. It is, however, possible that along with the ageing of ice, the aggregates of humic DOM became sufficiently large and stable to be removed by 0.2 μm filtration carried out immediately after melting of ice and prior LC-SEC measurements (Reference Giesy and BrieseGiesy and Briese, 1978). Small molecules might instead be bound by cationic complex formation and hydrogen bonding, which will break easily during melting of the sample. the difference in binding stability between small and large molecular sizes can therefore increase the fraction of small molecules in the filtered sample.
Our study shows clearly that the initial freezing results in the enrichment of DOM relative to salts in sea ice. After being trapped in sea ice, DOM is altered by numerous processes such as melting and refreezing, photodegradation, biological degradation and changes in the brine channel network (Reference Niedrauer and MartinNiedrauer and Martin, 1979). Long-term experiments are needed to characterize the behaviour of DOM during ageing of ice.
Acknowledgements
We thank the Sea Ice Ecology group for carrying out the experiments with us. C.A. Stedmon introduced us to the PARAFAC modeling. the LC-SEC instruments were provided by the Faculty of Pharmacy of the University of Helsinki. This study was funded by the Walter and Andrée de Nottbeck Foundation and the Academy of Finland. We also thank two anonymous referees for their constructive comments and suggestions



