Implications
Major gaps in knowledge remain regarding the metabolic, endocrine and hepatic molecular adaptations of rangeland beef cows throughout their gestation–lactation cycle. Our goal was to gain insights into the molecular aspects of the interaction between nutrition (herbage allowances) and genetics (pure and crossbred cows), and their association with production parameters and postpartum commencement of luteal activity in grazing beef cows. Crossbred cows grazing on high herbage allowances displayed increased milk production and were more likely to reinitiate earlier luteal activity postpartum, probably because of their greater energy intake and body reserves, the effect of the heterosis, and/or a combination of these two factors.
Introduction
During periods of negative energy balance (NEB), as it typically occurs during the last few months of pregnancy and early lactation in spring-calved beef cows on native rangelands (Quintans et al., Reference Quintans, Banchero, Carriquiry, López and Baldi2010), the liver plays a key role in the metabolic adaptation. Through the coordination and interconversion of nutrients, the liver works to re-establish metabolic homeostasis to ultimately support pregnancy and/or milk production (Bell, Reference Bell1995; Bauman, Reference Bauman2000). In this context, the uncoupling of the growth hormone (GH)-IGF axis mediates the endocrine regulation of nutrient partitioning (Bauman, Reference Bauman2000). This uncoupling is characterized by a decrease in hepatic GH receptor-1A (GHR1A) mRNA that leads to a refractory GH state in the liver and a subsequent decrease in hepatic synthesis and circulating concentrations of IGF-I, which work to elevate blood GH (Lucy, Reference Lucy2008). Elevated GH and decreased insulin concentrations during NEB stimulate hepatic gluconeogenesis to supply glucose for the fetus or for lactose synthesis, and the use of non-esterified fatty acids (NEFA) mobilized from the adipose tissue to supply energy for peripheral needs (Bauman, Reference Bauman2000; McCarthy et al., Reference McCarthy, Waters, Kenny, Diskin, Fitzpatrick, Patton, Wathes and Morris2010). Several authors have shown an increased activity and/or hepatic mRNA expression of rate-limiting enzymes involved in gluconeogenesis and/or fatty-acid oxidation during the NEB associated with the transition period in dairy cows (Drackley et al., Reference Drackley, Overton and Douglas2001; Loor et al., Reference Loor, Dann, Everts, Oliveira, Green, Janovick Guretzky, Rodriguez-Zas, Lewin and Drackley2005; McCarthy et al., Reference McCarthy, Waters, Kenny, Diskin, Fitzpatrick, Patton, Wathes and Morris2010).
Grazing intensity of native pastures, controlled through herbage allowances (HAs), determines changes in herbage mass and height (Soares et al., Reference Soares, Carvalho, Nabinger, Frizzo, Pinto, Junior, Semmelmann and da Trindade2003) that can affect energy intake (Chapman et al., Reference Chapman, Parsons, Cosgrove, Barker, Marotti, Venning, Rutter, Hill and Thompson2007) and energy requirements, through modifying animal BW and production (Soares et al., Reference Soares, Carvalho, Nabinger, Frizzo, Pinto, Junior, Semmelmann and da Trindade2003) and grazing activity (Brosh, Reference Brosh2007), impacting cows’ energy balance. It has been shown that the complex system of adaptation to changes in energy balance can differ considerably between cows (Jorritsma et al., Reference Jorritsma, Wensinga, Kruipb, Vosa and Noordhuizena2003), and that this variation in the cow’s ability to successfully adapt to periods of NEB may have a genetic basis (Ingvartsen et al., Reference Ingvartsen, Dewhurst and Friggens2003). In addition, previous studies (Morris et al., Reference Morris, Baker, Johnson, Carter and Hunter1987; Espasandin et al., Reference Espasandin, Ciria, Franco, Pereyra and Gimeno2010) evaluating reciprocal crossbreeding between Angus (A) and Hereford (H) cattle in rangelands conditions have estimated a crossbred (CR, F1) superiority (heterosis) for cow–calf system productivity between 15% and 30% over the purebred (PU) mean.
We hypothesize that differences in productive performance because of HA of native rangelands (high v. low) and/or cow heterosis (CR v. PU cows) are explained by their ability to adapt to periods of NEB through a differential endocrine and molecular control of their metabolism. Thus, our objective was to evaluate the metabolic, endocrine and hepatic mRNA profiles of genes associated with the somatotropic axis, gluconeogenesis and fatty-acid oxidation, through the gestation–lactation cycle in PU (A, H) and CR (F1) beef cows, grazing on two HAs of native pastures, and their associations with cows’ productive performance (calf birth weight, milk production and commencement of luteal activity).
Material and methods
Location, animals and experimental design
The experiment was carried out on 90 ha of native grasslands (Campo biome) at the Experimental Station Bernardo Rosengurtt (Facultad de Agronomía, Universidad de la República, Uruguay, 32°S 54°W) from May 2009 to March 2010. Animal procedures were performed according to protocols approved by the Animal Experimentation Committee of Universidad de la República (CHEA, Uruguay). Thirty-two multiparous pregnant cows (5- to 6-year-old) were used in a complete randomized block design with two replications (block 1: sandy loam soil, 60 ha and block 2: clay loam soil, 30 ha) and four plots in each block to which a 2×2 factorial arrangement of HA and cow genotype (G) was allocated.
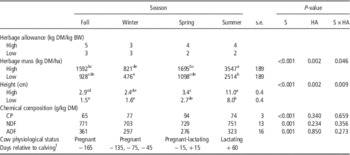
HA, the ratio between forage mass and stocking rate (kg of dry matter (DM)/kg of BW; Sollenberger et al., Reference Sollenberger, Moore, Allen and Pedreira2005), represented 4 and 2.5 kg DM/kg BW of annual mean (HI and LO, respectively) and varied with season of year (Table 1). Herbage mass (kg DM/ha) was estimated monthly by the comparative yield method (Haydock and Shaw, Reference Haydock and Shaw1975). A continuous stocking method was applied throughout the year, and thus HA in each plot was adjusted monthly by the ‘put-and-take method’ (Mott, Reference Mott1960). Experimental cows were maintained in the same plot throughout the experiment, and ‘put-and-take’ cows, of similar genotype and physiological status of experimental ones, were added or removed on the basis of herbage mass available to adjust forage allowance and thus stocking rate. Herbage samples were collected monthly and composited by season for chemical analysis. HA treatments determined differences in forage mass and height throughout the year but did not differ in chemical composition (Table 1).
Herbage allowances, forage mass and height and cow physiological status throughout the year

HA=herbage allowance; DM=dry matter.
a–eMeans with different literals differed with P<0.05.
1 Days of sample collection.
PU (A and H) and CR (F1, H×A and A×H) cows belonged to a group of experimental animals generated as part of a diallel crossbreeding experiment carried out for 10 years at the Experimental Station (Espasandin et al., Reference Espasandin, Ciria, Franco, Pereyra and Gimeno2010). Cows were maintained in the same plot (same HA treatment) since May 2007 and gestated and lactated 1 calf every year from 2007 to 2009. Cows did not receive any additional feed throughout this study. Eight cows were evaluated per treatment (HI-CR, HI-PU, LO-CR and LO-PU; n=4 for each individual genotype: H and A for PU or H×A and A×H for CR).
Data and sample collection
BW (after 12 h off pasture) and body condition score (BCS, scale 1 to 8, determined by the same observer throughout the experiment; Quintans et al., Reference Quintans, Banchero, Carriquiry, López and Baldi2010) were recorded, and blood samples were collected from May 2009 to January 2010, at −165, −135, −105, −75, −45, −15±10 and +15, +30, +45 and +60±3 (mean±s.d.) days relative to calving (days; average calving date: November 13). Blood samples were obtained early in the morning via venipuncture of the coccygeal vein in BD Vacutainer® tubes (Becton Dickinson, Franklin Lakes, NJ, USA) with (sodium fluoride and potassium oxalate) and without anticoagulant, and centrifuged at 2500×g for 20 min, either immediately or after 4 h of coagulation, for the collection of plasma and serum, respectively. In addition, blood samples for serum progesterone (P4) analysis were obtained in 10-day intervals, from +60 to +180±10 days of lactation. Plasma and serum samples were stored at −20°C until analysis. Liver biopsies (0.5 g of tissue approximately) were collected at −165, −75, −45, and −15±10, +15 and +60±3 days using a biopsy needle (Tru-Core®-II Automatic Biopsy Instrument; Angiotech, Lausanne, Switzerland) according to Carriquiry et al. (Reference Carriquiry, Weber, Fahrenkrug and Crooker2009). Liver samples were immediately frozen in liquid nitrogen and stored at −80°C until total RNA was isolated.
Calf weight was determined at birth, and average milk production during the first +60 days of lactation was estimated by two measurements at +31 and +55±6 days using a milking machine according to Quintans et al. (Reference Quintans, Banchero, Carriquiry, López and Baldi2010). Commencement of luteal activity was defined as the day from calving to the presence of corpus luteum. The presence of corpus luteum was determined by transrectal ultrasonography (Ambivision Digital AV-3018V Notebook; AMBISEA Technology Corp. Ltd, China; bimodal probe of 5.0 and 7.5 MHz) in 10-day intervals, from +60 to +180±10 days, and confirmed with increased P4 concentrations in serum above 1 ng/ml.
Metabolite and hormone analyses
Concentrations of serum NEFA and plasma glucose were determined by spectrophotometry using commercial kits (NEFA: NEFA-HR (2); Wako Chemicals, Richmond, VA, USA; glucose: oxidase/peroxidase; BioSystems SA, Barcelona, Spain) as described by Astessiano et al. (Reference Astessiano, Pérez-Clariget, Quintans, Soca and Carriquiry2012). The intra- and inter-assay CV for low, medium and high controls did not exceed 13% for the metabolites analyzed. Concentrations of P4 were determined by radioimmunoassay (Coat-and-Count, Siemens Healthcare Diagnostics, Inc., Los Angeles, CA, USA), and the assay detection limit was 0.2 ng/ml. Serum insulin concentrations were determined by an immunoradiometric (IRMA) assay (INS-IRMA; Diasource, Brussels, Belgium), with an assay detection limit of 3.2 µIU/ml. Serum concentrations of IGF-I were determined by an IRMA assay (IGF1-RIACT; Cis Bio, Gif sur Yvette, France), and the assay detection limit was 0.6 ng/ml. All samples were determined in a single assay. Intra-assay CV for low and high controls was less than 9.2% and 8.0%, respectively, for all hormones evaluated.
Quantitative real-time PCR
Isolation of total RNA from the hepatic tissue and synthesis of cDNA by reverse transcription was performed according to Carriquiry et al. (Reference Carriquiry, Weber, Fahrenkrug and Crooker2009) (Supplementary Material S1). Primers (Supplementary Table S1) to specifically amplify cDNA of target genes: GHR, GHR-1A, IGF1, IGF-binding proteins-2 and -3 (IGFBP2, IGFBP3), acyl-CoA oxidase-1 (ACOX1), acyl-CoA dehydrogenase very long chain (ACADVL), pyruvate carboxylase (PC), phosphoenolpyruvate carboxykinase-1 (PCK1), fibroblast growth factor-21 (FGF21) and peroxisome proliferator-activated receptor-α (PPARA), and from endogenous controls: β-actin (ACTB) and hypoxanthine phosphoribosyltransferase (HPRT) were obtained from the literature (Loor et al., Reference Loor, Dann, Everts, Oliveira, Green, Janovick Guretzky, Rodriguez-Zas, Lewin and Drackley2005; Carriquiry et al., Reference Carriquiry, Weber, Fahrenkrug and Crooker2009; Astessiano et al., Reference Astessiano, Pérez-Clariget, Quintans, Soca and Carriquiry2012) or specifically designed using Primer3 (http://frodo.wi.mit.edu/) and bovine nucleotide sequences available from NCBI (http://www.ncbi.nlm.nih.gov/). Before use, primer product size (1% agarose gel separation) and sequence (Macrogen, Inc., Seoul, Korea) were determined to ensure that primers produced the desired amplicons (Supplementary Tables S2 and S3).
Real-time PCR reactions were performed in a total volume of 15 µl using KAPA SYBR® FAST Universal 2X qPCR Master Mix (Kapa Biosystems, Inc., Woburn, MA, USA) according to Astessiano et al. (Reference Astessiano, Pérez-Clariget, Quintans, Soca and Carriquiry2012) (Supplementary Material S1). The presence of a single PCR product was verified by the dissociation curves generated after the last cycle. The absolute mRNA expression was determined based on a standard curve constructed from a cloned plasmid cDNA containing the amplified fragment for each target and control gene (n=6 dilutions, from 106 to 101). Inter- and intra-assay CV varied between 4% and 6.5% and 8% and 21%, respectively. The absolute expression of each target gene was normalized to the geometric mean of the expression of control genes (ACTB and HPRT; gene-stability measure M⩽0.609 and pairwise variation V=0.175; geNorm software; qbasePLUS, Biogazelle, Belgium).
Calculations and statistical analyses
Individual energy intake was estimated using cow energy requirements from National Research Council (NRC) (2000) from maintenance, and gestation or lactation (Smit et al., Reference Smit, Taweel, Tas, Tamminga and Elgersma2005). Data were analyzed using the SAS Systems program (SAS 9.0 V, SAS Institute, Inc., Cary, NC, USA). The Univariate procedure was used to identify outliers and verify normality of residuals. BW, BCS, hormone and gene expression data were analyzed as repeated measures, using the Mixed procedure. The model included HA, G, days (time effect, repeated measure) and their interactions as fixed effects, block as random effect and cow calving period (periods 1, 2 or 3 of calving, interval of 15 days for each period) as a covariate. Cows of all treatments were represented in each calving period. The block was used as the experimental unit to evaluate HA effect and cow as the experimental unit to evaluate G and the HA by G interaction. The interaction between HA and block was included in the model as a random effect, but as covariance parameter estimates were 0 or close to 0, it was removed from the model. The covariance structure SP(POW) (spatial power), and the Kenward–Rogers procedure to adjust the degrees of freedom of denominator were specified. Gene expression data of FGF21 with non-normal distribution were log transformed for analysis and re-transformed for presentation. Calf birth weight and cow average milk production were analyzed with the same model without the effect of days. Commencement of luteal activity (days) was analyzed with the same model using the GENMOD procedure with the Poisson distribution and log transformation specified. For all variables, mean separation was performed using Tukey test (α=0.05). Pearson correlation coefficients to describe relationships between variables were estimated using the CORR procedure. Results are presented as least square means±pooled s.e.
Results
Productive performance
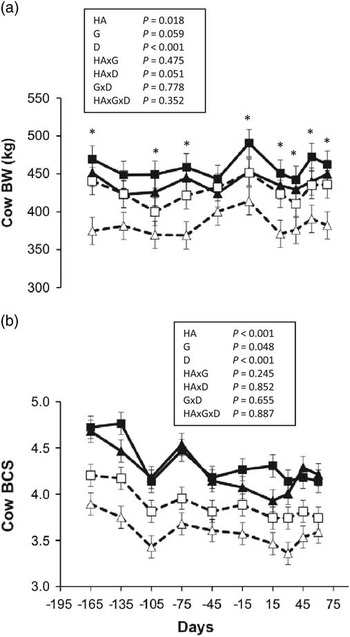
Estimated energy intake during gestation (−165 days to calving) and lactation (calving to +60 days) was greater for HI than for LO cows (40.8 v. 36.6 MJ ENm/day and 62.0 v. 53.0 MJ ENm/day for gestation and lactation, respectively; P<0.003) and greater for CR than for PU cows (39.9 v. 37.4 MJ ENm/day and 61.0 v. 54.0 MJ ENm/day for gestation and lactation, respectively; P<0.044). Cow BW and BCS were greater in HI than in LO cows (448 v. 405±11 kg and 4.3 v. 3.7±0.1 units; P<0.018) and greater in CR than in PU cows (443 v. 410±11 kg and 4.1 v. 3.9±0.1 units; P<0.059) throughout the period evaluated, and both variables were affected by days (P<0.001; Figure 1a and b). The nadir of BCS was at calving for all groups, but BCS at nadir was greater (P<0.050) for HI than for LO (4.2 v. 3.6±0.1) and for CR than for PU (4.0 v. 3.8±0.1) cows as well. Calf birth weight did not differ because of HA, G or their interaction, and averaged 35±2 kg. Milk production during the first +60 days was greater for HI than for LO (4.9 v. 4.0±0.3 kg) and for CR than for PU (5.0 v. 3.9±0.3 kg; P<0.031) cows. All cows were in anestrous at +60 days but commencement of luteal activity was earlier (P<0.031) for HI than for LO (103 v. 162±13 days) and for CR than for PU (116 v. 150±13 days) cows.
Least square means and s.e.m. for cow BW (a) and body condition score (BCS; 8-point scoring system, 1=thin to 8=obese; (b) throughout the gestation–lactation cycle (−165 to 60 days relative to calving) in purebred (Hereford and Aberdeen Angus; triangles) and crossbred (F1; squares) beef cows grazing high (solid symbols and lines) and low (open symbols and dashed lines) herbage allowances (2 and 4 kg dry matter (DM)/kg BW of annual mean, respectively) of native grasslands (n=32, eight cows per treatment). Asterisks denote days in which cow BW differed (P<0.05) between high and low herbage allowances.

Metabolite and hormone concentrations
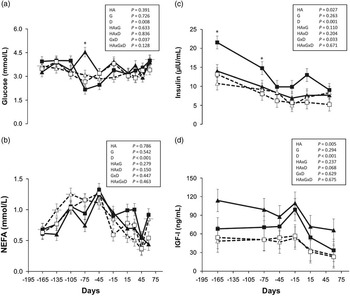
Plasma glucose concentrations were affected by days (P=0.008) and by the interaction between G and days (P=0.037), as plasma glucose was greater in CR than in PU cows at −75 days (Figure 2a). Serum NEFA concentrations varied (P<0.001) throughout the year, reaching the higher concentration at −45 days, but did not differ among groups (Figure 2b). Serum insulin concentrations were greater (P=0.027) for HI than for LO cows (11 v. 7.7±1 µIU/ml), and were affected both by days (P<0.001; Figure 2c) and by the interaction between G and days (P=0.033), as serum insulin was greater in CR than in PU cows at −165 days. Serum IGF-I concentrations were greater (P=0.005) for HI than for LO cows (78.7 v. 44±8 ng/ml), were affected by days (P<0.001), and tended to be affected by the interaction between HA and days (P=0.068), as serum IGF decreased at −45 days and increased at −15 days only in HI cows (Figure 2d).
Least square means and s.e.m. for glucose (a), serum non-esterified fatty acids (NEFA; b), insulin (c) and IGF-I (d) concentrations throughout the gestation–lactation cycle (−165 to +60 days relative to calving) in purebred (Hereford and Aberdeen Angus; triangles) and crossbred (F1; squares) beef cows grazing high (solid symbols and lines) and low (open symbols and dashed lines) herbage allowances (4 and 2.5 kg dry matter (DM)/kg BW of annual mean, respectively) of native grasslands (n=32, eight cows per treatment). Asterisks denote days in which glucose or insulin concentrations differed (P<0.05) between purebred and crossbred cows.

Hepatic gene expression
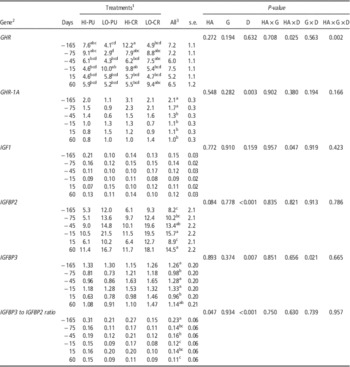
The hepatic expression of GHR mRNA was affected by the interaction between HA and days (P=0.025) and among HA, G and days (P=0.002; Table 2). The expression of this transcript at −165 days was greater in HI-CR than in LO-CR and LO-PU cows, and decreased from −165 to −45 days only in HI cows. Hepatic GHR-1A mRNA was only affected by days (P=0.003; Table 2). The expression of IGF-I mRNA was affected by the interaction between HA and days (P=0.047) as its expression declined between −165 and −45 days in HI cows, whereas in LO cows it tended to decrease (P=0.075) only at −15 days (Table 2). The expression of IGFBP2 mRNA tended to be less (P=0.084) for HI than for LO cows (15.02 v. 8.57±3.4) and was affected by days (P<0.001; Table 2). The hepatic IGFBP3 mRNA varied along the entire period evaluated (P=0.007; Table 2) and was affected by the interaction between G and days (P=0.021) as its expression was greater at −75, −45 and +15 days in CR than in PU cows. The IGFBP3 to IGFBP2 mRNA ratio was affected by days (P<0.001) and was greater (P=0.047) for HI than for LO cows (Table 2).
Effects of herbage, different herbage allowances and cow genotypes on hepatic expression of somatotropic axis genes from −165 to +60 days relative to calving of beef cows on grazing conditions

DM=dry matter; PU= purebred; CR=crossbred.
a–dDenote least square means differences for the interaction between HA, G and days for GHR mRNA and for day effect for GHR-1A, IGFPB2 and IGFBP3 mRNA.
1 HA: herbage allowance treatments (HA, high and low: 4 and 2.5 kg DM/kg BW in average, respectively; HI v. LO); G: cow genotype (purebred: Hereford and Angus v. F1-crossbred; PU v. CR).
2 Genes were growth hormone receptor (GHR) and GHR variant-1A (GHR-1A), insulin-like growth factor-I (IGF1) and IGF-binding proteins -2 and -3 (IGFBP2 and IGFBP3).
3 Least square means for day effect, including all treatments.
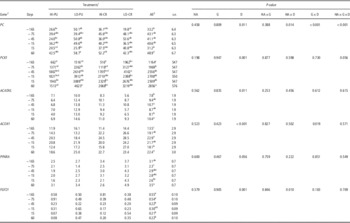
The expression of PC mRNA in the liver was affected by days (P=0.011), and by the interactions between HA and days (P=0.014), G and days (P<0.001) and between HA, G and days (P<0.011). The expression of this transcript was less in LO-CR than in LO-PU at −165 days and increased from −165 to −45 days only in LO-CR cows and from +15 to +60 days only in LO-PU cows (Table 3). The expression of PCK1 mRNA was also affected by days (P<0.001) and tended to be affected (P=0.056) by the interaction between HA, G and days as its expression increased at −45 days for LO-CR, at −15 days in LO-PU and HI-CR and at +15 days in HI-PU cows (Table 3).
Effects of different herbage allowances and cow genotypes on the hepatic expression of genes associated with gluconeogeneis and fatty-acids oxidation from −165 to 60 days relative to calving (days) of beef cows on grazing conditions

DM=dry matter; PU=purebred; CR=crossbred.
a–dDenote least square means differences for the interaction between herbage allowance, cow genotype and days, and for day effect.
1 HA: herbage allowance treatments (HA, high and low: 4 and 2.5 kg DM/kg BW in average, respectively; HI v. LO). G: cow genotype (purebred: Hereford and Angus v. F1-crossbred; PU v. CR).
2 Genes were pyruvate carboxylase (PC) and phosphoenolpyruvate carboxykinase-1 (PCK1), acyl-CoA dehydrogenase very long chain (ACADVL) and acyl-CoA oxidase-1 (ACOX1), peroxisome proliferator-activated receptor-α (PPARA) and fibroblast growth factor-21 (FGF21).
3 Least square means for day effect, including all treatments.
Hepatic mRNA abundance of genes involved in fatty-acid oxidation (ACOX1 and ACADVL) was affected by days (P<0.011; Table 3). There was an interaction between the G and days (P=0.019) for ACOX1, as the expression of this transcript was greater (P<0.05) in CR than in PU cows at −75 and −45 days. The hepatic mRNA expression of PPARA tended to be affected by days (P=0.056; Table 3). Hepatic mRNA abundance of FGF21 was affected by days (P<0.001) and by the interaction between HA and days (P=0.010) as it expression was less during the transition and lactation period (−15, +15 and +60 days) in HI than in LO cows.
Independent of HA, G or days, serum insulin and IGF-I concentrations were positively correlated (P<0.001, r=0.39), and both were correlated with BCS (P<0.001, r>0.47), IGFBP2 mRNA (P⩽0.010, r=−0.35 and r=−0.21, respectively), and with the IGFBP3 to IGFBP2 ratio mRNA (P<0.001, r=0.73 and r=0.56, respectively). The hepatic expression mRNA of GHR-1A was correlated with IGF1 and IGFB3 mRNA (P<0.001, r=0.29 and r=0.37). The PC and PCK1 mRNA expressions were correlated (P<0.001; r=0.33), and both were positively correlated (P<0.001; r>0.45) with the expression of transcripts involved in fatty-acid metabolism (ACADVL and ACOX1). The PPARA and FGF21 mRNA were positively correlated (P<0.001, r=0.43) and both were correlated with ACOX1 mRNA (P<0.001, r>0.33). In addition, FGF21 and GHR1A mRNA were highly correlated (P<0.001, r>0.69). Milk production was positively correlated with BCS (P=0.028, r=0.17) and insulin (P=0.036, r=0.17) and negatively correlated with IGFBP2 mRNA (P=0.017, r=−0.19). Commencement of luteal activity was positively correlated with IGFBP2 mRNA abundance throughout the gestation–lactation cycle (P=0.003, r=0.29).
Discussion
The most pronounced changes with regard to the metabolic, endocrine and hepatic gene expression profiles occurred during the last half of winter gestation with the onset of an NEB. These changes were modulated by forage allowance, mass and height of native pastures, as well as by cow heterosis. Both milk production and commencement of luteal activity were also affected additively by HA and cow heterosis, and were associated with differential endocrine and hepatic gene expression profiles through the gestation–lactation cycle.
BCS and metabolic and endocrine profiles
During winter gestation, all cows mobilized body reserves, as is evidenced by the decrease in BW and BCS and the increase in serum NEFA concentrations. In parallel, during this period, insulin and glucose concentrations decreased. These results would reflect a period of NEB, probably as a consequence of decreased forage intake (75% to 90% of NRC energy requirements for gestation in the present study) because of reduced forage mass and height in winter (Chapman et al., Reference Chapman, Parsons, Cosgrove, Barker, Marotti, Venning, Rutter, Hill and Thompson2007), along with the cows’ increased energy requirements for grazing (Brosh, Reference Brosh2007) and gestation (Bell, Reference Bell1995).
In contrast with the dairy cow model, only moderate BCS changes were observed during the peripartum period. This would probably indicate a partial recovery of the energy balance in response to increased energy intake (90% to 110% of NRC requirements for lactation), as forage mass and height of native grassland increase as temperatures rise in spring. However, serum insulin and IGF-I concentrations continued to decrease with the onset of lactation, as has been previously observed in dairy and beef cows (Lucy, Reference Lucy2008; Quintans et al., Reference Quintans, Banchero, Carriquiry, López and Baldi2010), suggesting that nutrients might be partitioning toward the mammary gland for milk production (Bauman, Reference Bauman2000).
In agreement with previous results on beef cows (Quintans et al., Reference Quintans, Banchero, Carriquiry, López and Baldi2010), although the magnitude of BCS losses during winter did not differ markedly among groups, the greater estimated energy intake and BCS for HI cows were correlated with greater serum insulin and IGF-I concentrations during the whole period evaluated. However, even though insulin decreased during winter for all cows, serum IGF-I concentrations decreased only for HI cows. One strategy developed for the ruminant to cope with feed restriction and NEB is the uncoupling of the GH–IGF-I axis, reflected in decreased concentrations of IGF-I in blood (Bauman, Reference Bauman2000). Decreased serum concentrations of IGF-I during the winter only in HI cows in our study may reflect a differential ability to adapt to changes in environmental conditions (i.e. nutrition) compared with LO cows.
Hepatic expression of somatotropic axis genes
In the present study, hepatic GHR and IGF1 mRNA decreased during winter gestation only for HI cows (in accordance with the circulating IGF-I concentrations), whereas their expressions remained unchanged for LO cows. The decrease during winter was associated with greater expression of these transcripts in HI cows at −165 days, that together with their greater BCS and greater serum insulin and IGF-I, would reflect a greater energy intake and/or mobilization of body reserves of these cows in late fall when compared with LO cows. The decrease in GHR and IGF1 mRNA during the NEB of early lactation in dairy cows has been explained by a reduction of the liver-specific GHR-1A mRNA variant (Lucy, Reference Lucy2008). However, in this study, GHR-1A mRNA decreased not only for HI but also for LO cows, whereas GHR and IGF1 mRNA as well as serum IGF-I remained unchanged during winter in the later group. These results suggest a possible involvement of other transcripts variants of GHR mRNA (i.e. GHR-1B or 1C) as a compensatory mechanism or mechanisms independent of GHR-1A mRNA transcription for LO cows (Wang et al., Reference Wang, Eleswarapu, Beal, Swecker, Akers and Jiang2003).
The expression of IGFBP3 or the IGFBP3 to IGFBP2 ratio could represent possible mechanisms, whereby insulin regulates plasma IGF-I concentrations (Mashek et al., Reference Mashek, Ingvartsen, Andersen, Vestergaard and Larsen2001; Loor et al., Reference Loor, Dann, Everts, Oliveira, Green, Janovick Guretzky, Rodriguez-Zas, Lewin and Drackley2005; Carriquiry et al., Reference Carriquiry, Weber, Fahrenkrug and Crooker2009). Circulating IGF-I forms a ternary complex (IGFBP3/IGF-I) that increases IGF-I half-life and potentiates its role, whereas IGFBP2 inhibits IGF-I action by preventing the binding to its receptors (Rajaram et al., Reference Rajaram, Baylink and Mohan1997). This was reflected in the high correlations determined in this study between plasma insulin and IGF-I and the IGFBP3 to IGFBP2 mRNA ratio. Reduced IGFBP3 and increased IGFBP2 have been associated with NEB (Rajaram et al., Reference Rajaram, Baylink and Mohan1997; Loor et al., Reference Loor, Dann, Everts, Oliveira, Green, Janovick Guretzky, Rodriguez-Zas, Lewin and Drackley2005; Carriquiry et al., Reference Carriquiry, Weber, Fahrenkrug and Crooker2009). The greater IGFBP2 mRNA and reduced IGFBP3 to IGFBP2 mRNA ratio observed in LO than in HI cows, indicated a more severe nutrient restriction in the former ones (Rajaram et al., Reference Rajaram, Baylink and Mohan1997) and could explain, at least partly, their reduced circulating IGF-I concentrations (Mashek et al., Reference Mashek, Ingvartsen, Andersen, Vestergaard and Larsen2001).
In agreement with our results, the expression of GHR, GHR-1A and IGF1 mRNA did not change during the peripartum or early lactation period in beef cows (Jiang et al., Reference Jiang, Lucy, Crooker and Beal2005; Schneider et al., Reference Schneider, Machado Pfeifer, Teixeira Hax, Paludo, Burkert Del Pino, Laurino Dionello and Corrêa2010) or during the transition period of low milk-producing (20 kg/day) dairy cows (Lucy et al., Reference Lucy, Verkerk, Whyte, MacDonald, Burton, Cursons, Roche and Holmes2009). In the present study, milk yield level (4 to 5 kg/day) was in agreement with previous reports of milk production in a similar environment (Quintans et al., Reference Quintans, Banchero, Carriquiry, López and Baldi2010) and with CR daughters of low milk-expected progeny difference A and H bulls (Minick et al., Reference Minick, Buchanan and Rupert2001). Thus, these results taken together suggest that the onset of lactation, in this study milk production, is not as much of an energetic challenge to the beef cow, and that the molecular mechanism that explains the uncoupling of the GH–IGF axis in early lactation of high-producing dairy cows is probably related to genetic selection for milk production. Similar to our results, Schneider et al. (Reference Schneider, Machado Pfeifer, Teixeira Hax, Paludo, Burkert Del Pino, Laurino Dionello and Corrêa2010) did demonstrate decreased circulating IGF-I concentrations after calving in beef cows. As previously reported by this latter author, but in contrast with reports on dairy cows (Lucy, Reference Lucy2008; Carriquiry et al., Reference Carriquiry, Weber, Fahrenkrug and Crooker2009), serum IGF-I concentrations were not correlated with hepatic expression of GHR, GHR-1A or IGF1 mRNA, whereas in the present study they were correlated with the IGFBP3 to IGFBP2 mRNA ratio.
Hepatic mRNA expression of gluconeogenic and fatty-acid oxidation enzymes
The twofold to fivefold increase in PCK1 mRNA hepatic expression during winter gestation (from −165 to −45, −15 or +15 days depending on cow groups) coincided with decreased glucose and insulin concentrations and with the establishment of the NEB (Drackley et al., Reference Drackley, Overton and Douglas2001). During the postpartum period, there appeared to be a recovery of the cow’s energy balance, reflected in the maintenance of BCS, reduced serum NEFA and increased plasma glucose. However, PCK1 mRNA remained elevated in all cow groups. Greater PCK1 mRNA, if translated to more protein, would increase the use of oxalacetate for the gluconeogenesis pathway to supply glucose for fetal metabolism (Bell, Reference Bell1995) or milk production (Bauman, Reference Bauman2000).
Pyruvate carboxylase catalyzes the synthesis of oxaloacetate from pyruvate replenishing the tricarboxylic acid cycle (anaplerotic role) when the oxaloacetate is removed for gluconegenesis during NEB. Both, PC mRNA and/or enzyme activity, increased rapidly in dairy cows with the onset of lactation (Drackley et al., Reference Drackley, Overton and Douglas2001) or in cows under feed restriction (Baird et al., Reference Baird, Lomax, Symonds and Shaw1980). In the present study, hepatic expression of PC mRNA was greater in LO-PU than in LO-CR cows at −165 days and increased during winter only in the latter group. This would indicate a differential glucose homeostasis mechanism depending on G probably associated with DM and energy intake, despite the fact that both groups were grazing low HA. Greater PC mRNA at the end of the fall (−165 days) would suggest that LO-PU cows were using more lactate and amino acids (and less propionate) as gluconeogenic precursors (Drackley et al., Reference Drackley, Overton and Douglas2001), whereas CR cows increased their use during early winter (−165 to −45 days) when forage mass and height and thus dry matter intake (Chapman et al., Reference Chapman, Parsons, Cosgrove, Barker, Marotti, Venning, Rutter, Hill and Thompson2007) decrease.
The rate of mobilization of reserves, mainly from the adipose tissue, depends on factors such as the severity of the NEB and the cow’s physiological status. Once NEFAs are released from the adipose tissue into circulation, they are taken up mainly by the liver (where they can be re-esterified or become substrates for mitochondrial or peroxisomal β-oxidation), or by the mammary gland for the synthesis of milk fat (Drackley et al., Reference Drackley, Overton and Douglas2001). Hepatic ACADVL mRNA was increased during the NEB of winter gestation (from −45 to −15 days) and at +60 days during the lactation period. This may reflect the energetic demands of the maternal metabolism during gestation or milk production as forage mass and height (winter gestation) or quality (less CP, more ADF at +60 days) limited their DM and energy intake (Chapman et al., Reference Chapman, Parsons, Cosgrove, Barker, Marotti, Venning, Rutter, Hill and Thompson2007). Increased hepatic ACADVL would allow hepatocytes to deal with the overflow of NEFA mobilized from the adipose tissue, increasing mitochondrial β-oxidation (Loor, Reference Loor2010).
In addition, hepatic ACOX1 mRNA also increased during winter gestation and early lactation. It has been observed that peroxisomal β-oxidation plays a role in relation to the metabolism of fatty acids during periods of sustained high hepatic influx of NEFA (50% of the total capacity of β-oxidation in the liver dairy cows during NEB; Grum et al., Reference Grum, Hansen and Drackley1994). In agreement with the similar BCS losses and serum NEFA concentrations among cow groups, we did not observe differences in ACADVL mRNA expression because of HA or GG. However, mRNA expression of ACOX1 was greater in CR than in PU cows during winter, which could indicate the liver’s increased capacity to adapt to the high influx of NEFA in CR cows.
The hepatic expression of the transcripts involved in gluconeogenesis and fatty-acid oxidation were highly correlated, reflecting a coordinated regulation of these two metabolic pathways. The transcription factor PPAR-α has a central role in the molecular adaptations necessary to cope with feed restriction, regulating the expression of genes involved in fatty-acid metabolism, gluconeogenesis and amino-acid metabolism (Kersten, Reference Kersten2002; Loor, Reference Loor2010). However, in the present study, hepatic PPARA mRNA showed a different pattern of expression than fatty-acid oxidation genes. Loor (Reference Loor2010) reported that activation of this nuclear receptor via known pharmaceutical ligands or long-chain fatty acids did not alter PPARA mRNA, but caused marked upregulation of its target genes in the liver of dairy cows during the peripartum period. These authors suggested that PPAR-α activity is not only regulated at a transcriptional level, but also through post-transcriptional changes or mediated by the action of co-activators (i.e. PPAR-γ coactivator protein-1α; PGC-1α).
The PPARA mRNA expression was positively correlated with FGF21 mRNA. FGF21 is a hormone induced during fasting and starvation, in a PPAR-α-dependent manner, which plays important endocrine roles in the regulation of lipid and glucose metabolism. Specifically it stimulates lipolysis from the adipose tissue during feeding but inhibits it during fasting, favoring glucose uptake in the peripheral tissues and stimulating hepatic ketogenesis (Kliewer and Mangelsdorf, Reference Kliewer and Mangelsdorf2010). Hepatic FGF21 mRNA and plasma concentrations have been reported to increase in mice in NEB (Kliewer and Mangelsdorf, Reference Kliewer and Mangelsdorf2010) as well as in early lactation dairy cows (Carriquiry et al., Reference Carriquiry, Weber, Fahrenkrug and Crooker2009; Schoenberg et al., Reference Schoenberg, Giesy, Harvatine, Waldron, Cheng, Kharitonenkov and Boisclair2011). However, in this study, FGF21 mRNA decreased at the end of the winter (from −75 to −45 days) for all cow groups, indicating a different mechanism of adaptation to NEB of gestating beef cows.
It has been reported that FGF21 mRNA expression and circulating concentrations increased only after long-term fasting in mice (>16 h) when it is important for the regulation of adipose tissue catabolism and torpor, a state of decreased activity and metabolism (Estall et al., Reference Estall, Ruasa, Choib, Laznika, Badmanc, Maratos-Flierc, Shulmanb and Spiegelmana2009). Similarly, Kliewer and Mangelsdorf (Reference Kliewer and Mangelsdorf2010) indicated that FGF21 stimulates gluconeogenesis and ketogenesis in the context of prolonged fasting and starvation (>7 days fasting in humans) but not in the early stages of fasting. Therefore, the decrease in hepatic FGF21 mRNA during winter gestation in this study could reflect an adaptation of the rangeland beef cows to moderate to chronic NEB (75% to 90% of NRC energy requirements for gestation in the present study for −165 to −15 days), very different than the acute NEB of dairy cows in early lactation and the prolonged fasting in experimental mice, which might be in a more profound starvation/energy-sparing state. In addition, FGF21 mRNA was greater during the transition period and early lactation (−15 to +65 days) for LO than for HI cows, which could suggest that although producing less milk, the metabolic stress of lactation was more severe for these cows.
Postpartum commencement of luteal activity
Blood concentrations of insulin, and IGF-I, are indicative of the availability of energy and provide short- or long-term signals that mediate the effects of nutrition on reproduction (Lucy, Reference Lucy2008). In agreement with previous reports, commencement of luteal activity was negatively correlated with BCS, circulating IGF-I and insulin concentrations and positively correlated with the hepatic expression of IGFBP2 mRNA (Roberts et al., Reference Roberts, Nugent, Klindt and Jenkins1997; Quintans et al., Reference Quintans, Banchero, Carriquiry, López and Baldi2010). Indeed, the shorter commencement of luteal activity determined for HI cows was associated with the greater BCS and serum insulin and IGF-I concentrations, and with less IGFBP2 mRNA, in these cows during the gestation–lactation cycle. Cows grazing HI had more body reserves and estimated energy intake, which would indicate that they were able to adapt better to changes in environment (i.e. nutrient and energy supply) through the gestation–lactation cycle without diminishing calf weight, milk yield or commencement of luteal activity. The shorter commencement of luteal activity as well as milk yield reported here for CR over the PU cows were in agreement with Cundiff et al. (Reference Cundiff, Gregory and Koch1974) and Morris et al. (Reference Morris, Baker, Johnson, Carter and Hunter1987), who worked on reciprocal crossbreeding experiments between H and A and found a shorter interval to first estrus, higher pregnancy rate, weaning rate and kg of calf weaned/cow exposed for CR (F1), compared with PU cows. The present study indicates that the superiority of CR over PU cows was associated with a better metabolic status (greater BCS, serum insulin and hepatic GHR mRNA abundance) particularly in late fall (−165 days) and with greater hepatic IGFBP3 mRNA expression in late winter (−75 and −45 days) and in early lactation (+15 days). These results would support the concept of a ‘metabolic memory’ impacting reproduction, allowing nutritional information to be carried forward beyond the life of the original metabolic stimulus (Blanc et al., Reference Blanc, Broquier, Agabriel, D’Hour and Chiliard2006)
Conclusions
The metabolic, endocrine and molecular profiles evaluated in this study varied in a coordinated manner, with the interaction between changes in forage mass and height of native grasslands and the cows’ physiological status through the year. The more significant differences across time points in endocrine and hepatic mRNA expression were observed in HI and CR cows, suggesting a more efficient adaptive performance. The greater milk yield and shorter commencement of luteal activity in the postpartum period is probably because of the effect of a better metabolic status (energy intake and body reserves), heterosis and/or a combination of these two factors.
Acknowledgments
The authors thank Bernardo Rosengurtt Experimental Unit staff (O. Caceres, M. Caceres, J. Caceres and V. Cal), for animal care and assistance throughout the field study, and Dr V. Gutierrez and Bach F. Pereyra and P. Machado for their help during the experiment. This study was supported by research project INIA-FPTA2007 #262 awarded to M. Carriquiry and J. Laporta was awarded a graduate scholarship by the Agencia Nacional de Investigación e Innovación (Uruguay, ANII; BE_POS_2009_851).