Introduction
Clinical depression is a markedly complex and debilitating mental disorder characterised by sad, irritable or empty mood, diminished pleasure, and cognitive and somatic impairment (Christian et al., Reference Christian, Stefan, Brenda, Carmine, Amit, Maurizio, David and Alan2016). The heritability of major depression is estimated to be ~37% from twin studies (Sullivan et al., Reference Sullivan, Neale and Kendler2000) with common single nucleotide polymorphisms (SNPs) explaining around 9% of the variation in liability (Wray et al., Reference Wray, Ripke, Mattheisen, Trzaskowski, Byrne, Abdellaoui, Adams, Agerbo, Air, Andlauer, Bacanu, Bækvad-Hansen, Beekman, Bigdeli, Binder, Blackwood, Bryois, Buttenschøn, Bybjerg-Grauholm, Cai, Castelao, Christensen, Clarke, Coleman, Colodro-Conde, Couvy-Duchesne, Craddock, Crawford, Crowley, Dashti, Davies, Deary, Degenhardt, Derks, Direk, Dolan, Dunn, Eley, Eriksson, Escott-Price, Kiadeh, Finucane, Forstner, Frank, Gaspar, Gill, Giusti-Rodríguez, Goes, Gordon, Grove, Hall, Hannon, Hansen, Hansen, Herms, Hickie, Hoffmann, Homuth, Horn, Hottenga, Hougaard, Hu, Hyde, Ising, Jansen, Jin, Jorgenson, Knowles, Kohane, Kraft, Kretzschmar, Krogh, Kutalik, Lane, Li, Li, Lind, Liu, Lu, Macintyre, Mackinnon, Maier, Maier, Marchini, Mbarek, Mcgrath, Mcguffin, Medland, Mehta, Middeldorp, Mihailov, Milaneschi, Milani, Mill, Mondimore, Montgomery, Mostafavi, Mullins, Nauck, Ng, Nivard, Nyholt, O'reilly, Oskarsson, Owen, Painter, Pedersen, Pedersen, Peterson, Pettersson, Peyrot, Pistis, Posthuma, Purcell, Quiroz, Qvist, Rice, Riley, Rivera, Saeed Mirza, Saxena, Schoevers, Schulte, Shen, Shi, Shyn, Sigurdsson, Sinnamon, Smit, Smith, Stefansson, Steinberg, Stockmeier, Streit, Strohmaier, Tansey, Teismann, Teumer, Thompson, Thomson, Thorgeirsson, Tian, Traylor, Treutlein, Trubetskoy, Uitterlinden, Umbricht, Van Der Auwera, Van Hemert, Viktorin, Visscher, Wang, Webb, Weinsheimer, Wellmann, Willemsen, Witt, Wu, Xi, Yang, Zhang, Arolt, Baune, Berger, Boomsma, Cichon, Dannlowski, De Geus, Depaulo, Domenici, Domschke, Esko, Grabe, Hamilton, Hayward, Heath, Hinds, Kendler, Kloiber, Lewis, Li, Lucae, Madden, Magnusson, Martin, Mcintosh, Metspalu, Mors, Mortensen, Müller-Myhsok, Nordentoft, Nöthen, O'donovan, Paciga, Pedersen, Penninx, Perlis, Porteous, Potash, Preisig, Rietschel, Schaefer, Schulze, Smoller, Stefansson, Tiemeier, Uher, Völzke, Weissman, Werge, Winslow, Lewis, Levinson, Breen, Børglum and Sullivan2018; Howard et al., Reference Howard, Adams, Clarke, Hafferty, Gibson, Shirali, Coleman, Hagenaars, Ward, Wigmore, Alloza, Shen, Barbu, Xu, Whalley, Marioni, Porteous, Davies, Deary, Hemani, Berger, Teismann, Rawal, Arolt, Baune, Dannlowski, Domschke, Tian, Hinds, Trzaskowski, Byrne, Ripke, Smith, Sullivan, Wray, Breen, Lewis and Mcintosh2019). Depression has substantial comorbidity with other psychiatric and substance use disorders and is related to a wide range of personality, socioeconomic and human traits (Lee et al., Reference Lee, Ripke, Neale, Faraone, Purcell, Perlis, Mowry, Thapar, Goddard and Witte2013). There is substantial overlap in the genetic risk factors of major depression and other psychiatric disorders (Wray et al., Reference Wray, Ripke, Mattheisen, Trzaskowski, Byrne, Abdellaoui, Adams, Agerbo, Air, Andlauer, Bacanu, Bækvad-Hansen, Beekman, Bigdeli, Binder, Blackwood, Bryois, Buttenschøn, Bybjerg-Grauholm, Cai, Castelao, Christensen, Clarke, Coleman, Colodro-Conde, Couvy-Duchesne, Craddock, Crawford, Crowley, Dashti, Davies, Deary, Degenhardt, Derks, Direk, Dolan, Dunn, Eley, Eriksson, Escott-Price, Kiadeh, Finucane, Forstner, Frank, Gaspar, Gill, Giusti-Rodríguez, Goes, Gordon, Grove, Hall, Hannon, Hansen, Hansen, Herms, Hickie, Hoffmann, Homuth, Horn, Hottenga, Hougaard, Hu, Hyde, Ising, Jansen, Jin, Jorgenson, Knowles, Kohane, Kraft, Kretzschmar, Krogh, Kutalik, Lane, Li, Li, Lind, Liu, Lu, Macintyre, Mackinnon, Maier, Maier, Marchini, Mbarek, Mcgrath, Mcguffin, Medland, Mehta, Middeldorp, Mihailov, Milaneschi, Milani, Mill, Mondimore, Montgomery, Mostafavi, Mullins, Nauck, Ng, Nivard, Nyholt, O'reilly, Oskarsson, Owen, Painter, Pedersen, Pedersen, Peterson, Pettersson, Peyrot, Pistis, Posthuma, Purcell, Quiroz, Qvist, Rice, Riley, Rivera, Saeed Mirza, Saxena, Schoevers, Schulte, Shen, Shi, Shyn, Sigurdsson, Sinnamon, Smit, Smith, Stefansson, Steinberg, Stockmeier, Streit, Strohmaier, Tansey, Teismann, Teumer, Thompson, Thomson, Thorgeirsson, Tian, Traylor, Treutlein, Trubetskoy, Uitterlinden, Umbricht, Van Der Auwera, Van Hemert, Viktorin, Visscher, Wang, Webb, Weinsheimer, Wellmann, Willemsen, Witt, Wu, Xi, Yang, Zhang, Arolt, Baune, Berger, Boomsma, Cichon, Dannlowski, De Geus, Depaulo, Domenici, Domschke, Esko, Grabe, Hamilton, Hayward, Heath, Hinds, Kendler, Kloiber, Lewis, Li, Lucae, Madden, Magnusson, Martin, Mcintosh, Metspalu, Mors, Mortensen, Müller-Myhsok, Nordentoft, Nöthen, O'donovan, Paciga, Pedersen, Penninx, Perlis, Porteous, Potash, Preisig, Rietschel, Schaefer, Schulze, Smoller, Stefansson, Tiemeier, Uher, Völzke, Weissman, Werge, Winslow, Lewis, Levinson, Breen, Børglum and Sullivan2018), including significant genetic correlations (r g) with anxiety disorders (r g = 0.80), schizophrenia (r g = 0.34), bipolar disorder (r g = 0.32), autism spectrum disorders (r g = 0.44) and attention-deficit/hyperactivity disorder (ADHD) (r g = 0.42).
Initial efforts to identify genetic variants associated with major depression were unsuccessful, despite successes with other psychiatric diseases and traits. While a Genome-Wide Association Study (GWAS) of schizophrenia (9394 cases), for example, detected seven genome-wide significant associations (Ripke et al., Reference Ripke, Sanders, Kendler, Levinson, Sklar, Holmans, Lin, Duan, Ophoff and Andreassen2011), a mega-analysis of major depression (9240 cases) (Ripke et al., Reference Ripke, Wray, Lewis, Hamilton, Weissman, Breen, Byrne, Blackwood, Boomsma, Cichon, Heath, Holsboer, Lucae, Madden, Martin, Mcguffin, Muglia, Noethen, Penninx, Pergadia, Potash, Rietschel, Lin, Muller-Myhsok, Shi, Steinberg, Grabe, Lichtenstein, Magnusson, Perlis, Preisig, Smoller, Stefansson, Uher, Kutalik, Tansey, Teumer, Viktorin, Barnes, Bettecken, Binder, Breuer, Castro, Churchill, Coryell, Craddock, Craig, Czamara, De Geus, Degenhardt, Farmer, Fava, Frank, Gainer, Gallagher, Gordon, Goryachev, Gross, Guipponi, Henders, Herms, Hickie, Hoefels, Hoogendijk, Hottenga, Iosifescu, Ising, Jones, Jones, Jung-Ying, Knowles, Kohane, Kohli, Korszun, Landen, Lawson, Lewis, Macintyre, Maier, Mattheisen, Mcgrath, Mcintosh, Mclean, Middeldorp, Middleton, Montgomery, Murphy, Nauck, Nolen, Nyholt, O'donovan, Oskarsson, Pedersen, Scheftner, Schulz, Schulze, Shyn, Sigurdsson, Slager, Smit, Stefansson, Steffens, Thorgeirsson, Tozzi, Treutlein, Uhr, Van Den Oord, Van Grootheest, Volzke, Weilburg, Willemsen, Zitman, Neale, Daly, Levinson and Sullivan2013) and a meta-analysis of depressive symptoms (N = 34 549) (Hek et al., Reference Hek, Demirkan, Lahti, Terracciano, Teumer, Cornelis, Amin, Bakshis, Baumert, Ding, Liu, Marciante, Meirelles, Nalls, Sun, Vogelzangs, Yu, Bandinelli, Benjamin, Bennett, Boomsma, Cannas, Coker, De Geus, De Jager, Diez-Roux, Purcell, Hu, Rimma, Hunter, Jensen, Curhan, Rice, Penman, Rotter, Sotoodehnia, Emeny, Eriksson, Evans, Ferrucci, Fornage, Gudnason, Hofman, Illig, Kardia, Kelly-Hayes, Koenen, Kraft, Kuningas, Massaro, Melzer, Mulas, Mulder, Murray, Oostra, Palotie, Penninx, Petersmann, Pilling, Psaty, Rawal, Reiman, Schulz, Shulman, Singleton, Smith, Sutin, Uitterlinden, Volzke, Widen, Yaffe, Zonderman, Cucca, Harris, Ladwig, Llewellyn, Raikkonen, Tanaka, Van Duijn, Grabe, Launer, Lunetta, Mosley, Newman, Tiemeier and Murabito2013) found no significant associations. By 2014, 108 independent genetic loci for schizophrenia had been identified (Ripke et al., Reference Ripke, Neale, Corvin, Walters, Farh, Holmans, Lee, Bulik-Sullivan, Collier and Huang2014), and not a single one for depression. The struggle to identify significant genetic variants was likely related to low statistical power due to the clinical heterogeneity of major depression, although other factors are also involved (e.g. high polygenicity, high disease prevalence and low heritability of depression) (Levinson et al., Reference Levinson, Mostafavi, Milaneschi, Rivera, Ripke, Wray and Sullivan2014).
The Diagnostic and Statistical Manual of Mental Disorders 5th edition (DSM-5) defines major depressive disorder (MDD) based on nine symptoms (American Psychiatric Association, 2013). For a diagnosis of MDD, five or more of these symptoms need to be present during a 2-week period, with at least one symptom being depressed mood or anhedonia. Østergaard et al. (Reference Østergaard, Jensen and Bech2011) highlighted that there are 227 possible combinations of symptoms meeting DSM-5 criteria, indicating MDD is an extremely heterogeneous disorder. Further, individual symptoms have been found to differ substantially in their association with psychosocial impairment, influence from environmental and personality risk factors, and biological correlates (Fried and Nesse, Reference Fried and Nesse2015).
Two broad GWAS approaches have been utilised to discover risk loci for depression: (1) maximising sample size by combining different and often broad measures such as questionnaire data, with the view that the increase in sample size overcomes phenotypic heterogeneity; and (2) reducing clinical heterogeneity by analysing homogenous MDD phenotypes (e.g. recurrent, clinically-diagnosed MDD). In the last few years, increasing sample size has proved to be effective with the number of genome-wide significant variants increasing steadily with sample size. Hyde et al. (Reference Hyde, Nagle, Tian, Chen, Paciga, Wendland, Tung, Hinds, Perlis and Winslow2016) identified 15 genome-wide significant loci associated with self-reported depression (N = 307 354). In 2018, another 17 loci were identified across three broad depression phenotypes (N = 322 580) (Howard et al., Reference Howard, Adams, Shirali, Clarke, Marioni, Davies, Coleman, Alloza, Shen, Barbu, Wigmore, Gibson, Hagenaars, Lewis, Ward, Smith, Sullivan, Haley, Breen, Deary and Mcintosh2018), and 44 loci in a GWA meta-analysis of major depression (N = 480 359) (Wray et al., Reference Wray, Ripke, Mattheisen, Trzaskowski, Byrne, Abdellaoui, Adams, Agerbo, Air, Andlauer, Bacanu, Bækvad-Hansen, Beekman, Bigdeli, Binder, Blackwood, Bryois, Buttenschøn, Bybjerg-Grauholm, Cai, Castelao, Christensen, Clarke, Coleman, Colodro-Conde, Couvy-Duchesne, Craddock, Crawford, Crowley, Dashti, Davies, Deary, Degenhardt, Derks, Direk, Dolan, Dunn, Eley, Eriksson, Escott-Price, Kiadeh, Finucane, Forstner, Frank, Gaspar, Gill, Giusti-Rodríguez, Goes, Gordon, Grove, Hall, Hannon, Hansen, Hansen, Herms, Hickie, Hoffmann, Homuth, Horn, Hottenga, Hougaard, Hu, Hyde, Ising, Jansen, Jin, Jorgenson, Knowles, Kohane, Kraft, Kretzschmar, Krogh, Kutalik, Lane, Li, Li, Lind, Liu, Lu, Macintyre, Mackinnon, Maier, Maier, Marchini, Mbarek, Mcgrath, Mcguffin, Medland, Mehta, Middeldorp, Mihailov, Milaneschi, Milani, Mill, Mondimore, Montgomery, Mostafavi, Mullins, Nauck, Ng, Nivard, Nyholt, O'reilly, Oskarsson, Owen, Painter, Pedersen, Pedersen, Peterson, Pettersson, Peyrot, Pistis, Posthuma, Purcell, Quiroz, Qvist, Rice, Riley, Rivera, Saeed Mirza, Saxena, Schoevers, Schulte, Shen, Shi, Shyn, Sigurdsson, Sinnamon, Smit, Smith, Stefansson, Steinberg, Stockmeier, Streit, Strohmaier, Tansey, Teismann, Teumer, Thompson, Thomson, Thorgeirsson, Tian, Traylor, Treutlein, Trubetskoy, Uitterlinden, Umbricht, Van Der Auwera, Van Hemert, Viktorin, Visscher, Wang, Webb, Weinsheimer, Wellmann, Willemsen, Witt, Wu, Xi, Yang, Zhang, Arolt, Baune, Berger, Boomsma, Cichon, Dannlowski, De Geus, Depaulo, Domenici, Domschke, Esko, Grabe, Hamilton, Hayward, Heath, Hinds, Kendler, Kloiber, Lewis, Li, Lucae, Madden, Magnusson, Martin, Mcintosh, Metspalu, Mors, Mortensen, Müller-Myhsok, Nordentoft, Nöthen, O'donovan, Paciga, Pedersen, Penninx, Perlis, Porteous, Potash, Preisig, Rietschel, Schaefer, Schulze, Smoller, Stefansson, Tiemeier, Uher, Völzke, Weissman, Werge, Winslow, Lewis, Levinson, Breen, Børglum and Sullivan2018). The largest GWAS of depression to date (N = 807 553) identified 101 significant loci (Howard et al., Reference Howard, Adams, Clarke, Hafferty, Gibson, Shirali, Coleman, Hagenaars, Ward, Wigmore, Alloza, Shen, Barbu, Xu, Whalley, Marioni, Porteous, Davies, Deary, Hemani, Berger, Teismann, Rawal, Arolt, Baune, Dannlowski, Domschke, Tian, Hinds, Trzaskowski, Byrne, Ripke, Smith, Sullivan, Wray, Breen, Lewis and Mcintosh2019).
In the present study, we combine these two approaches by conducting genetic analyses on individual depressive symptoms using large-scale population questionnaire data. Previous GWASs of depression have typically focused on MDD case–control status or aggregated sums of depressive symptoms. By combining different symptoms into a single clinical measure, it is implicitly assumed that individual symptoms of depression are genetically similar. However, the extreme heterogeneity of depression and numerous clinical presentations of the disorder suggest that different biological mechanisms could underlie the diverse subtypes of depression. Supporting this notion, symptoms of depression have been found to differ substantially in heritability (twin-based h 2 range, 0–35%); with somatic and cognitive symptoms being most heritable (Jang et al., Reference Jang, Livesley, Taylor, Stein and Moon2004). Further, the diagnostic criteria of MDD were found to reflect three underlying genetic factors (cognitive/psychomotor symptoms, mood symptoms and neurovegetative symptoms) rather than a single factor of genetic risk in a twin study (Kendler et al., Reference Kendler, Aggen and Neale2013). Nagel et al. (Reference Nagel, Watanabe, Stringer, Posthuma and Van Der Sluis2018b) found substantial genetic heterogeneity in neuroticism, a personality trait with extensive phenotypic and genetic overlap with major depression (Hettema et al., Reference Hettema, Neale, Myers, Prescott and Kendler2006), by conducting genetic analyses on the individual items used to measure neuroticism.
To date, the extent to which common genetic risk factors overlap in individual symptoms of depression is not known. The aim of the present study is to examine and assess the extent of genetic heterogeneity in self-rated depressive symptoms as measured by the nine items of the Patient Health Questionnaire (PHQ-9) (Kroenke et al., Reference Kroenke, Spitzer and Williams2001a), a depression measure which directly maps onto the DSM-5 criteria. Although endorsement of these symptoms may not necessarily be occurring within an episode of major depression, they may possess a similar underlying genetic basis and therefore provide insight into the genetic architecture of major depression. We conduct genetic analyses in 148 752 participants within the UK Biobank (UKBB). In order to examine genetic heterogeneity, we (a) conduct symptom-level GWA analyses and then compare genetic associations and SNP-based heritability across symptoms; (b) calculate phenotypic and genetic correlations across symptoms and determine their underlying genetic factor structure; and (c) calculate genetic correlations between individual symptoms and a range of psychiatric disorders and human complex traits.
Methods
UKBB cohort
UKBB is a major health data resource containing phenotypic information on a wide range of health-related measures and characteristics in over 500 000 participants from the UK general population (Bycroft et al., Reference Bycroft, Freeman, Petkova, Band, Elliott, Sharp, Motyer, Vukcevic, Delaneau, O'connell, Cortes, Welsh, Young, Effingham, Mcvean, Leslie, Allen, Donnelly and Marchini2018). Participants were recruited between 2006 and 2010 and provided written informed consent. A total of 157 365 participants completed the PHQ-9, as part of a UKBB mental health follow-up questionnaire administered online in 2016.
Sample selection
First, participants were included in the present study if they were of white British ancestry, identified through self-reported ethnicity and genetic principal components. Participants who self-reported as not white British, but for whom the first two genetic principal components indicated them to be genetically similar to those of white British ancestry were also included in order to maximise sample size (these commonly were participants who reported to be of Irish ancestry). Second, participants were excluded if they were identified with schizophrenia and/or other psychotic disorders, bipolar disorder, cyclothymic disorder or dissociative identity disorder, based on self-reported symptoms or diagnosis, reported prescription of an antipsychotic medication and/or ICD-10 codes from linked hospital admission records. Third, only participants who provided a response for all nine items of the PHQ-9 were included (list-wise deletion represented a <2% reduction in sample size). This resulted in a final sample size of 148 752 (see online Supplementary Fig. S1 for a flow diagram of sample selection).
PHQ-9
The PHQ-9 is a commonly used self-administered measure of depression containing nine items that map directly onto the nine DSM diagnostic criteria for major depression (Kroenke et al., Reference Kroenke, Spitzer and Williams2001a). Each PHQ-9 item assesses the frequency of that symptom over the past 2 weeks, rated on a four-point ordinal scale: (0) Not at all, (1) Several days, (2) More than half the days, (3) Nearly every day (see online Supplementary Table S1 for the nine symptoms of major depression, PHQ-9 items and DSM-5 diagnostic criteria).
The PHQ-9 is a psychometrically valid and reliable measure of depression (Kroenke et al., Reference Kroenke, Spitzer and Williams2001b). Test-retest reliability was high (r = 0.84, over a span of 48 h) and internal consistency was excellent with Cronbach's α of 0.89 and 0.86 in primary care and obstetrics–gynaecology samples, respectively. The authors also reported good criterion and construct validity. The PHQ-9 was validated against professional diagnoses of MDD, resulting in 88% sensitivity and 88% specificity (at a PHQ-9 sum-score of ⩾10); and scores correlated highly with similar constructs, such as the 20-item Short-Form General Health Survey (SF-20) (Stewart et al., Reference Stewart, Hays and Ware1988) mental health scale (r = 0.73). Internal consistency of the PHQ-9 in the UKBB sample in the current study was high (Cronbach's α = 0.83).
Depression item phenotypes
Each of the nine PHQ-9 items is considered a separate phenotype in the genetic analyses. The ordinal scale of measurement of these items complicates interpretation of the SNP-based heritability (h 2 SNP) estimates. In order to interpret h 2 SNP of each of the PHQ-9 items, each ordinal phenotype was transformed into a binary phenotype. The nine items were dichotomised such that an item was considered to be endorsed if the item score was one or greater (several days, more than half the days or nearly every day), and not endorsed if the score was zero (not at all). A cut-off score of one was used in order to maximise the number of subjects who endorsed an item and hence statistical power, a strategy that has provided greater benefit in GWASs of depression over ensuring a seamless phenotype (Wray et al., Reference Wray, Pergadia, Blackwood, Penninx, Gordon, Nyholt, Ripke, Macintyre, Mcghee, Maclean, Smit, Hottenga, Willemsen, Middeldorp, De Geus, Lewis, Mcguffin, Hickie, Van Den Oord, Liu, Macgregor, Mcevoy, Byrne, Medland, Statham, Henders, Heath, Montgomery, Martin, Boomsma, Madden and Sullivan2012; Hall et al., Reference Hall, Adams, Arnau-Soler, Clarke, Howard, Zeng, Davies, Hagenaars, Maria Fernandez-Pujals, Gibson, Wigmore, Boutin, Hayward, Scotland, Porteous, Deary, Thomson, Haley and Mcintosh2018; Howard et al., Reference Howard, Adams, Shirali, Clarke, Marioni, Davies, Coleman, Alloza, Shen, Barbu, Wigmore, Gibson, Hagenaars, Lewis, Ward, Smith, Sullivan, Haley, Breen, Deary and Mcintosh2018; Wray et al., Reference Wray, Ripke, Mattheisen, Trzaskowski, Byrne, Abdellaoui, Adams, Agerbo, Air, Andlauer, Bacanu, Bækvad-Hansen, Beekman, Bigdeli, Binder, Blackwood, Bryois, Buttenschøn, Bybjerg-Grauholm, Cai, Castelao, Christensen, Clarke, Coleman, Colodro-Conde, Couvy-Duchesne, Craddock, Crawford, Crowley, Dashti, Davies, Deary, Degenhardt, Derks, Direk, Dolan, Dunn, Eley, Eriksson, Escott-Price, Kiadeh, Finucane, Forstner, Frank, Gaspar, Gill, Giusti-Rodríguez, Goes, Gordon, Grove, Hall, Hannon, Hansen, Hansen, Herms, Hickie, Hoffmann, Homuth, Horn, Hottenga, Hougaard, Hu, Hyde, Ising, Jansen, Jin, Jorgenson, Knowles, Kohane, Kraft, Kretzschmar, Krogh, Kutalik, Lane, Li, Li, Lind, Liu, Lu, Macintyre, Mackinnon, Maier, Maier, Marchini, Mbarek, Mcgrath, Mcguffin, Medland, Mehta, Middeldorp, Mihailov, Milaneschi, Milani, Mill, Mondimore, Montgomery, Mostafavi, Mullins, Nauck, Ng, Nivard, Nyholt, O'reilly, Oskarsson, Owen, Painter, Pedersen, Pedersen, Peterson, Pettersson, Peyrot, Pistis, Posthuma, Purcell, Quiroz, Qvist, Rice, Riley, Rivera, Saeed Mirza, Saxena, Schoevers, Schulte, Shen, Shi, Shyn, Sigurdsson, Sinnamon, Smit, Smith, Stefansson, Steinberg, Stockmeier, Streit, Strohmaier, Tansey, Teismann, Teumer, Thompson, Thomson, Thorgeirsson, Tian, Traylor, Treutlein, Trubetskoy, Uitterlinden, Umbricht, Van Der Auwera, Van Hemert, Viktorin, Visscher, Wang, Webb, Weinsheimer, Wellmann, Willemsen, Witt, Wu, Xi, Yang, Zhang, Arolt, Baune, Berger, Boomsma, Cichon, Dannlowski, De Geus, Depaulo, Domenici, Domschke, Esko, Grabe, Hamilton, Hayward, Heath, Hinds, Kendler, Kloiber, Lewis, Li, Lucae, Madden, Magnusson, Martin, Mcintosh, Metspalu, Mors, Mortensen, Müller-Myhsok, Nordentoft, Nöthen, O'donovan, Paciga, Pedersen, Penninx, Perlis, Porteous, Potash, Preisig, Rietschel, Schaefer, Schulze, Smoller, Stefansson, Tiemeier, Uher, Völzke, Weissman, Werge, Winslow, Lewis, Levinson, Breen, Børglum and Sullivan2018; Howard et al., Reference Howard, Adams, Clarke, Hafferty, Gibson, Shirali, Coleman, Hagenaars, Ward, Wigmore, Alloza, Shen, Barbu, Xu, Whalley, Marioni, Porteous, Davies, Deary, Hemani, Berger, Teismann, Rawal, Arolt, Baune, Dannlowski, Domschke, Tian, Hinds, Trzaskowski, Byrne, Ripke, Smith, Sullivan, Wray, Breen, Lewis and Mcintosh2019). In addition to the nine ordinal items and nine binary items, a sum-score (sum of all ordinal item scores; ranging from 0 to 27) and binary sum-score (number of binary items endorsed; ranging from 0 to 9) were included as phenotypes. We will present the results from the binary items and the two sum-scores while results for ordinal items are provided in online Supplementary material.
GWA analyses
A total of 20 GWA analyses were conducted (nine ordinal scale depression items, nine binary items, plus the sum-score and binary sum-score phenotypes) using BOLT-LMM (Loh et al., Reference Loh, Tucker, Bulik-Sullivan, Vilhjálmsson, Finucane, Salem, Chasman, Ridker, Neale, Berger, Patterson and Price2015). Associations between SNPs and a phenotype are tested using a linear mixed model in order to correct for population structure and cryptic relatedness. While BOLT-LMM is based on a quantitative trait model, it can be used to analyse binary traits by treating them as continuous and applying a transformation. Ordinal items are treated as continuous. An issue when analysing binary traits in BOLT-LMM is the inflated type 1 error rates for rare SNPs when the number of cases and controls are very unbalanced (Zhou et al., Reference Zhou, Nielsen, Fritsche, Dey, Gabrielsen, Wolford, Lefaive, Vandehaar, Gagliano, Gifford, Bastarache, Wei, Denny, Lin, Hveem, Kang, Abecasis, Willer and Lee2018). In practice, all of the traits we consider here have a case proportion which is large enough (>3%) for this not to be a problem (Loh et al., Reference Loh, Kichaev, Gazal, Schoech and Price2018).
Analyses were limited to autosomal SNPs with high imputation quality score (INFO score ⩾ 0.80) and a minor allele frequency of 1% or higher, resulting in 9 413 637 SNPs being tested for association. Sex, age at baseline and batch were included as covariates. GWAS results were annotated using FUMA GWAS (Watanabe et al., Reference Watanabe, Taskesen, Bochoven and Posthuma2017). The conventional genome-wide significance threshold of p < 5 × 10⁻⁸ was applied. Given the exploratory nature of the analyses and identifying causal variants is not the primary interest of this paper, plus the high correlation between the 20 phenotypes, we did not correct for multiple testing of the 20 phenotypes as this would lead to increased type-II error rate.
Significant SNPs were clumped into blocks high in linkage disequilibrium (the non-random association of alleles at a specific locus; LD) using a threshold of r 2 < 0.10 [correlation between allele frequencies of two SNPs; as calculated by PLINK (Purcell et al., Reference Purcell, Neale, Todd-Brown, Thomas, Ferreira, Bender, Maller, Sklar, De Bakker, Daly and Sham2007)]. Independent significant SNPs were defined as the SNP with the lowest p value within an LD block. Genomic risk loci (distinct, fixed positions on a chromosome) were identified by merging independent SNPs if r 2 ⩾ 0.10 and their LD blocks are physically close to each other at a distance of 1000 kb.
LDSC analyses
Estimates of the variance in each phenotype attributable to the additive effects of all SNPs (SNP-based heritability; h 2 SNP) were calculated via single-trait LD Score Regression using GWAS summary statistics from our analyses (Bulik-Sullivan et al., Reference Bulik-Sullivan, Loh, Finucane, Ripke, Yang, Patterson, Daly, Price and Neale2015b) (see online Supplementary methods). To interpret h 2 SNP for binary items, estimates were converted to the liability scale, where the population prevalence of PHQ-9 items was estimated from our UKBB sample (population prevalence = sample prevalence; see Table 1). We applied a Bonferroni-corrected significance threshold for the 11 h 2 SNP estimates (p < 4.55 × 10⁻³).
Sample sizes, prevalence rates and SNP-based heritability estimates of all binary PHQ-9 items

Heritability (on the liability scale) estimated via single-trait LD Score Regression. All estimates are significant after multiple testing correction (p < 4.55 × 10⁻³).
Cross-trait LD Score Regression was used to estimate genetic correlations (r g) between each of the nine binary items. These estimates are not biased by sample overlap (even with complete sample overlap) (Bulik-Sullivan et al., Reference Bulik-Sullivan, Finucane, Anttila, Gusev, Day, Loh, Reprogen, Duncan, Perry, Patterson, Robinson, Daly, Price and Neale2015a). We applied a Bonferroni-corrected significance threshold for these 36 r g tests (p < 1.39 × 10⁻³). Additionally, we also calculated pairwise genetic correlations between our phenotypes (nine items and sum-scores) and 25 other psychiatric, substance use, socioeconomic and human traits with publicly available GWAS summary statistics. Multiple testing was corrected for by adjusting p values based on false discovery rate (FDR) across all tests.
We calculated I 2 heterogeneity statistics for each external trait (across the nine symptoms) to quantify the amount of variation in genetic correlations that is due to heterogeneity and not chance (Higgins and Thompson, Reference Higgins and Thompson2002). I 2 values range from 0% to 100% with higher values indicating a greater amount of variation is attributable to heterogeneity.
Confirmatory factor analyses
Confirmatory factor analyses (CFAs) were conducted using genomic structural equation modelling (genomic SEM) (Grotzinger et al., Reference Grotzinger, Rhemtulla, De Vlaming, Ritchie, Mallard, Hill, Ip, Marioni, Mcintosh, Deary, Koellinger, Harden, Nivard and Tucker-Drob2019) with a weighted least squares (WLS) estimator, in order to assess the genetic factor structure of the PHQ-9. The fit of three different factor structures commonly identified in phenotypic factor analyses was compared, including a one-factor model, a two-factor model containing ‘psychological’ and ‘somatic’ factors (Elhai et al., Reference Elhai, Contractor, Tamburrino, Fine, Prescott, Shirley, Chan, Slembarski, Liberzon, Galea and Calabrese2012; Petersen et al., Reference Petersen, Paulitsch, Hartig, Mergenthal, Gerlach and Gensichen2015; Beard et al., Reference Beard, Hsu, Rifkin, Busch and Björgvinsson2016), and a two-factor model containing ‘psychological/cognitive’ and ‘neurovegetative’ factors (Krause et al., Reference Krause, Bombardier and Carter2008; Krause et al., Reference Krause, Reed and Mcardle2010).
Model fit was evaluated with the following fit indices (and their commonly used thresholds for acceptable model fit): CFI (⩾0.95) and SRMR (⩽0.06) (Kline, Reference Kline2005). Models were compared using AIC indices, which take into account both model fit and complexity. The most parsimonious model is the model with the lowest AIC value.
Results
Descriptive statistics
The final sample (N = 148 752) was 56% female, ranging in age from 46 to 80 years old (M = 63.88, s.d. = 7.72). The distribution of responses to all PHQ-9 items (on the ordinal scale) is displayed in online Supplementary Table S2. The distribution of item scores varied considerably across items; sleep problems and fatigue had the highest endorsement rates while suicidal ideation and psychomotor changes had the lowest rates. Sum-scores ranged from 0 to 27, with a mean of 2.71 (s.d. = 3.61). Endorsement rates of binary items are shown in Table 1. The number of symptoms endorsed ranged from zero to nine, with a mean of 2.02 (s.d. = 2.20).
GWA analyses
GWA analyses of the nine binary items plus sum-score phenotypes identified a total of 326 genome-wide significant SNPs (p < 5 × 10⁻⁸), tagged by 13 independent SNPs. Two lead SNPs were significant in more than one phenotype, such that across all phenotypes there are 11 unique, independent genome-wide significant SNPs. These SNPs mapped onto nine genomic risk loci (see Table 2 for results, online Supplementary Figs S2–S11 for QQ plots and Manhattan plots of all phenotypes; and online Supplementary Table S3 for the ordinal item GWAS results).
GWAS Results for binary PHQ-9 items and sum-score phenotypes

Table displays SNPs significant at p < 5 × 10⁻⁸ and independent at r 2 < 0.10. Genomic risk loci (Gen. locus) are defined by r 2 < 0.10, window size 1000 kb. Chromosome (Chr), location in base pairs (BP) on Hg19, effect allele (A1), allele 2 (A2), frequency of effect allele (Freq A1), effect size β, standard error of β (s.e.), p value and number of SNPs clumped under lead SNP (nSNPs) are shown. Proximity (nearest gene) and eQTL (eQTL genes) mapping results are given. eQTL mapping limited to significant (FDR < 0.05) cis-eQTLs from GTEx v7 (Lonsdale et al., Reference Lonsdale, Thomas, Salvatore, Phillips, Lo, Shad, Hasz, Walters, Garcia, Young, Foster, Moser, Karasik, Gillard, Ramsey, Sullivan, Bridge, Magazine, Syron, Fleming, Siminoff, Traino, Mosavel, Barker, Jewell, Rohrer, Maxim, Filkins, Harbach, Cortadillo, Berghuis, Turner, Hudson, Feenstra, Sobin, Robb, Branton, Korzeniewski, Shive, Tabor, Qi, Groch, Nampally, Buia, Zimmerman, Smith, Burges, Robinson, Valentino, Bradbury, Cosentino, Diaz-Mayoral, Kennedy, Engel, Williams, Erickson, Ardlie, Winckler, Getz, Deluca, Macarthur, Kellis, Thomson, Young, Gelfand, Donovan, Meng, Grant, Mash, Marcus, Basile, Liu, Zhu, Tu, Cox, Nicolae, Gamazon, Im, Konkashbaev, Pritchard, Stevens, Flutre, Wen, Dermitzakis, Lappalainen, Guigo, Monlong, Sammeth, Koller, Battle, Mostafavi, Mccarthy, Rivas, Maller, Rusyn, Nobel, Wright, Shabalin, Feolo, Sharopova, Sturcke, Paschal, Anderson, Wilder, Derr, Green, Struewing, Temple, Volpi, Boyer, Thomson, Guyer, Ng, Abdallah, Colantuoni, Insel, Koester, Little, Bender, Lehner, Yao, Compton, Vaught, Sawyer, Lockhart, Demchok and Moore2013) and the CommonMind Consortium (CMC) (Fromer et al., Reference Fromer, Roussos, Sieberts, Johnson, Kavanagh, Perumal, Ruderfer, Oh, Topol, Shah, Klei, Kramer, Pinto, Gümüş, Cicek, Dang, Browne, Lu, Xie, Readhead, Stahl, Xiao, Parvizi, Hamamsy, Fullard, Wang, Mahajan, Derry, Dudley, Hemby, Logsdon, Talbot, Raj, Bennett, De Jager, Zhu, Zhang, Sullivan, Chess, Purcell, Shinobu, Mangravite, Toyoshiba, Gur, Hahn, Lewis, Haroutunian, Peters, Lipska, Buxbaum, Schadt, Hirai, Roeder, Brennand, Katsanis, Domenici, Devlin and Sklar2016). SNP rs137997194 and rs143756010 are tagging the same signal, but was the SNP with lowest p value in ‘depressed mood’ and ‘binary sum-score’, respectively.
Heritability estimates
The amount of variance explained by common SNPs (SNP-based heritability; h 2 SNP) ranged from 6% of the variance in concentration problems up to 9% of the variance in appetite changes (mean h 2 SNP across the nine items was 7%; see Table 1). h 2 SNP estimates for the sum-score and binary sum-score phenotypes were 6% and 7%, respectively. All estimates were significant after Bonferroni correction (p < 4.55 × 10⁻³; see online Supplementary Table S4).
Inter-item phenotypic and genetic correlations
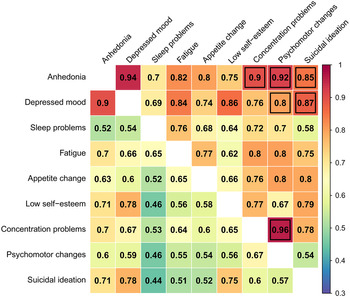
Tetrachoric correlations between all pairs of PHQ-9 binary items showed that all items were significantly and positively correlated with each other phenotypically. Coefficients ranged from 0.44 (s.e. = 0.007) to 0.90 (s.e. = 0.002), with the strongest association between anhedonia and depressed mood, the two core depressive symptoms (see Fig. 1).
Inter-item genetic and phenotypic correlations. Note: Genetic correlations (r g) above diagonal and phenotypic correlations (r tet) below diagonal. Genetic correlations estimated using cross-trait LD Score Regression. All correlations are significantly different from zero at p < 1.39 × 10⁻³. Black squares indicate correlation is not significantly different from one (95% CI includes 1).

Summary statistics from the GWASs of the nine binary items were used to calculate genetic correlations (r g) between items. All correlations were significant after correcting for multiple testing (p < 1.39 × 10⁻³) (see Fig. 1). Estimated r g's ranged from 0.54 (suicidal ideation/psychomotor changes; s.e. = 0.15) to 0.96 (psychomotor changes/concentration problems; s.e. = 0.11), with a mean r g of 0.77. Thirty out of the 36 genetic correlations were significantly less than one (95% CI did not include one), indicating genetic heterogeneity across the PHQ-9 items (see Fig. 1 and online Supplementary Table S5). Some of the genetic correlations that were not significantly different from 1 were relatively low, but have large standard errors which explain their overlap with 1.
A very similar pattern of genetic correlations emerged for the ordinal items (Pearson correlation between the set of binary item r g's and ordinal item r g's of r = 0.90, p < 0.001; see online Supplementary Fig. S12). The Pearson correlation between the genetic correlations and phenotypic correlations was moderate, r = 0.68, p < 0.001 (see online Supplementary Fig. S13).
Confirmatory factor analyses
CFAs of the genetic factor structure found that all three models provided an adequate fit to the data (see online Supplementary Table S6). Comparison of models based on AIC values revealed that the two-factor model containing a ‘psychological’ factor and a ‘somatic’ factor’ provided the best fit (see Fig. 2).
Factor loadings for a genetic two-factor model of the PHQ-9. Note: Standardised loadings estimated in Genomic SEM (using a WLS estimator) are presented for the best-fitting model.

Genetic correlations with external traits
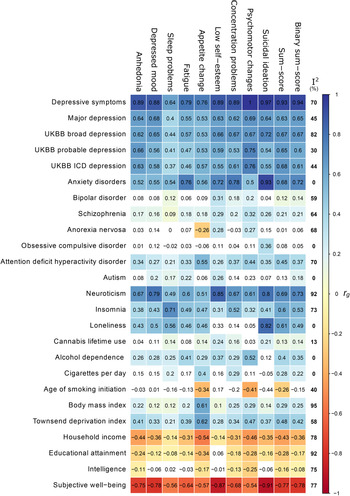
Genetic correlations of the nine PHQ-9 items, sum-score and binary sum-score with 25 other psychiatric, substance use, socioeconomic and human traits are displayed in Fig. 3 (and online Supplementary Table S7). Individual items correlated as expected with closely related traits, supporting the validity of the individual symptom phenotypes in the present study. For example, appetite changes had a substantially stronger positive genetic correlation with body mass index (r g = 0.61, s.e. = 0.03) than the other eight depression symptoms (r g's range between 0.10 and 0.29); and sleep problems had a strong, positive correlation with insomnia (r g = 0.71, s.e. = 0.06). All symptoms were negatively correlated with subjective well-being (r g range = −0.54 to −0.91), with suicidal ideation having the strongest association. Furthermore, all items positively correlated (and showed a similar pattern) with the other major depression and overall depression phenotypes.
Genetic correlations between PHQ-9 items and a range of other complex traits (psychiatric, substance use and socioeconomic phenotypes). Note: White squares indicate correlations do not meet significance after correcting for FDR. I 2 values represent the amount of variation in genetic correlations across the nine symptoms attributable to heterogeneity and not chance.

The pattern of genetic correlations with other psychiatric disorders and traits showed substantial variation across symptoms, such as with neuroticism (r g range = 0.49–0.85; I 2 = 92%), schizophrenia (r g range = 0.09–0.32, I 2 = 64%) and insomnia (r g range = 0.31–0.71, I 2 = 72%). I 2 values indicate this variation is largely due to heterogeneity and not error. Bipolar disorder was significantly correlated with only four out of nine depression items (sleep problems, low self-esteem, concentration problems and psychomotor changes; I 2 = 59%). Anorexia nervosa significantly overlapped with just three items (I 2 = 68%), with genetic correlations even being in different directions (low self-esteem r g = 0.28, s.e. = 0.09; psychomotor changes r g = 0.27, s.e. = 0.13; appetite change r g = −0.26, s.e. = 0.08).
Discussion
In the present study, we investigated genetic heterogeneity in depressive symptoms by conducting genetic analyses on individual items of the PHQ-9 in 148 752 participants from the UKBB. We identified nine genomic risk loci across the nine depressive symptoms and sum-score phenotypes. One locus (locus 3, tagged by lead SNP rs143756010) was identified in a recent GWAS of depression (Howard et al., Reference Howard, Adams, Clarke, Hafferty, Gibson, Shirali, Coleman, Hagenaars, Ward, Wigmore, Alloza, Shen, Barbu, Xu, Whalley, Marioni, Porteous, Davies, Deary, Hemani, Berger, Teismann, Rawal, Arolt, Baune, Dannlowski, Domschke, Tian, Hinds, Trzaskowski, Byrne, Ripke, Smith, Sullivan, Wray, Breen, Lewis and Mcintosh2019). The other eight loci have not been associated with depression in previous GWASs (Kohli et al., Reference Kohli, Lucae, Saemann, Schmidt, Demirkan, Hek, Czamara, Alexander, Salyakina, Ripke, Hoehn, Specht, Menke, Hennings, Heck, Wolf, Ising, Schreiber, Czisch, Müller, Uhr, Bettecken, Becker, Schramm, Rietschel, Maier, Bradley, Ressler, Nöthen, Cichon, Craig, Breen, Lewis, Hofman, Tiemeier, Van duijn, Holsboer, Müller-Myhsok and Binder2011; Hek et al., Reference Hek, Demirkan, Lahti, Terracciano, Teumer, Cornelis, Amin, Bakshis, Baumert, Ding, Liu, Marciante, Meirelles, Nalls, Sun, Vogelzangs, Yu, Bandinelli, Benjamin, Bennett, Boomsma, Cannas, Coker, De Geus, De Jager, Diez-Roux, Purcell, Hu, Rimma, Hunter, Jensen, Curhan, Rice, Penman, Rotter, Sotoodehnia, Emeny, Eriksson, Evans, Ferrucci, Fornage, Gudnason, Hofman, Illig, Kardia, Kelly-Hayes, Koenen, Kraft, Kuningas, Massaro, Melzer, Mulas, Mulder, Murray, Oostra, Palotie, Penninx, Petersmann, Pilling, Psaty, Rawal, Reiman, Schulz, Shulman, Singleton, Smith, Sutin, Uitterlinden, Volzke, Widen, Yaffe, Zonderman, Cucca, Harris, Ladwig, Llewellyn, Raikkonen, Tanaka, Van Duijn, Grabe, Launer, Lunetta, Mosley, Newman, Tiemeier and Murabito2013; Cai et al., Reference Cai, Bigdeli, Kretzschmar, Li, Liang, Song, Hu, Li, Jin and Hu2015; Hyde et al., Reference Hyde, Nagle, Tian, Chen, Paciga, Wendland, Tung, Hinds, Perlis and Winslow2016; Okbay et al., Reference Okbay, Baselmans, De Neve, Turley, Nivard, Fontana, Meddens, Linnér, Rietveld, Derringer, Gratten, Lee, Liu, De Vlaming, Ahluwalia, Buchwald, Cavadino, Frazier-Wood, Furlotte, Garfield, Geisel, Gonzalez, Haitjema, Karlsson, Van Der Laan, Ladwig, Lahti, Van Der Lee, Lind, Liu, Matteson, Mihailov, Miller, Minica, Nolte, Mook-Kanamori, Van Der Most, Oldmeadow, Qian, Raitakari, Rawal, Realo, Rueedi, Schmidt, Smith, Stergiakouli, Tanaka, Taylor, Thorleifsson, Wedenoja, Wellmann, Westra, Willems, Zhao, Lifelines Cohort, Amin, Bakshi, Bergmann, Bjornsdottir, Boyle, Cherney, Cox, Davies, Davis, Ding, Direk, Eibich, Emeny, Fatemifar, Faul, Ferrucci, Forstner, Gieger, Gupta, Harris, Harris, Holliday, Hottenga, De Jager, Kaakinen, Kajantie, Karhunen, Kolcic, Kumari, Launer, Franke, Li-Gao, Liewald, Koini, Loukola, Marques-Vidal, Montgomery, Mosing, Paternoster, Pattie, Petrovic, Pulkki-Råback, Quaye, Räikkönen, Rudan, Scott, Smith, Sutin, Trzaskowski, Vinkhuyzen, Yu, Zabaneh, Attia, Bennett, Berger, Bertram, Boomsma, Snieder, Chang, Cucca, Deary, Van Duijn, Eriksson, Bültmann, De Geus, Groenen, Gudnason, Hansen, Hartman, Haworth, Hayward, Heath, Hinds, Hyppönen, Iacono, Järvelin, Jöckel, Kaprio, Kardia, Keltikangas-Järvinen, Kraft, Kubzansky, Lehtimäki, Magnusson, Martin, Mcgue, Metspalu, Mills, De Mutsert, Oldehinkel, Pasterkamp, Pedersen, Plomin, Polasek, Power, Rich, Rosendaal, Den Ruijter, Schlessinger, Schmidt, Svento, Schmidt, Alizadeh, Sørensen, Spector, Starr, Stefansson, Steptoe, Terracciano, Thorsteinsdottir, hurik, Timpson, Tiemeier, Uitterlinden, Vollenweider, Wagner, Weir, Yang, Conley, Smith, Hofman, Johannesson, Laibson, Medland, Meyer, Pickrell, Esko, Krueger, Beauchamp, Koellinger, Benjamin, Bartels and Cesarini2016; Direk et al., Reference Direk, Williams, Smith, Ripke, Air, Amare, Amin, Baune, Bennett, Blackwood, Boomsma, Breen, Buttenschøn, Byrne, Børglum, Castelao, Cichon, Clarke, Cornelis, Dannlowski, De Jager, Demirkan, Domenici, Van Duijn, Dunn, Eriksson, Esko, Faul, Ferrucci, Fornage, De Geus, Gill, Gordon, Grabe, Van Grootheest, Hamilton, Hartman, Heath, Hek, Hofman, Homuth, Horn, Jan Hottenga, Kardia, Kloiber, Koenen, Kutalik, Ladwig, Lahti, Levinson, Lewis, Lewis, Li, Llewellyn, Lucae, Lunetta, Macintyre, Madden, Martin, Mcintosh, Metspalu, Milaneschi, Montgomery, Mors, Mosley, Murabito J, Müller-Myhsok, Nöthen, Nyholt, O'donovan, Penninx, Pergadia, Perlis, Potash, Preisig, Purcell S, Quiroz, Räikkönen, Rice, Rietschel, Rivera, Schulze, Shi, Shyn, Sinnamon, Smit, Smoller, Snieder, Tanaka, Tansey, Teumer, Uher, Umbricht, Van Der Auwera, Ware, Weir, Weissman, Willemsen, Yang, Zhao, Tiemeier and Sullivan2017; Power et al., Reference Power, Tansey, Buttenschøn, Cohen-Woods, Bigdeli, Hall, Kutalik, Lee, Ripke, Steinberg, Teumer, Viktorin, Wray, Arolt, Baune, Boomsma, Børglum, Byrne, Castelao, Craddock, Craig, Dannlowski, Deary, Degenhardt, Forstner, Gordon, Grabe, Grove, Hamilton, Hayward, Heath, Hocking, Homuth, Hottenga, Kloiber, Krogh, Landén, Lang, Levinson, Lichtenstein, Lucae, Macintyre, Madden, Magnusson, Martin, Mcintosh, Middeldorp, Milaneschi, Montgomery, Mors, Müller-Myhsok, Nyholt, Oskarsson, Owen, Padmanabhan, Penninx, Pergadia, Porteous, Potash, Preisig, Rivera, Shi, Shyn, Sigurdsson, Smit, Smith, Stefansson, Stefansson, Strohmaier, Sullivan, Thomson, Thorgeirsson, Van Der Auwera, Weissman, Breen and Lewis2017; Hall et al., Reference Hall, Adams, Arnau-Soler, Clarke, Howard, Zeng, Davies, Hagenaars, Maria Fernandez-Pujals, Gibson, Wigmore, Boutin, Hayward, Scotland, Porteous, Deary, Thomson, Haley and Mcintosh2018; Howard et al., Reference Howard, Adams, Shirali, Clarke, Marioni, Davies, Coleman, Alloza, Shen, Barbu, Wigmore, Gibson, Hagenaars, Lewis, Ward, Smith, Sullivan, Haley, Breen, Deary and Mcintosh2018; Li et al., Reference Li, Luo, Gu, Hall, Mcintosh, Zeng, Porteous, Hayward, Li, Yao, Zhang and Luo2018; Wray et al., Reference Wray, Ripke, Mattheisen, Trzaskowski, Byrne, Abdellaoui, Adams, Agerbo, Air, Andlauer, Bacanu, Bækvad-Hansen, Beekman, Bigdeli, Binder, Blackwood, Bryois, Buttenschøn, Bybjerg-Grauholm, Cai, Castelao, Christensen, Clarke, Coleman, Colodro-Conde, Couvy-Duchesne, Craddock, Crawford, Crowley, Dashti, Davies, Deary, Degenhardt, Derks, Direk, Dolan, Dunn, Eley, Eriksson, Escott-Price, Kiadeh, Finucane, Forstner, Frank, Gaspar, Gill, Giusti-Rodríguez, Goes, Gordon, Grove, Hall, Hannon, Hansen, Hansen, Herms, Hickie, Hoffmann, Homuth, Horn, Hottenga, Hougaard, Hu, Hyde, Ising, Jansen, Jin, Jorgenson, Knowles, Kohane, Kraft, Kretzschmar, Krogh, Kutalik, Lane, Li, Li, Lind, Liu, Lu, Macintyre, Mackinnon, Maier, Maier, Marchini, Mbarek, Mcgrath, Mcguffin, Medland, Mehta, Middeldorp, Mihailov, Milaneschi, Milani, Mill, Mondimore, Montgomery, Mostafavi, Mullins, Nauck, Ng, Nivard, Nyholt, O'reilly, Oskarsson, Owen, Painter, Pedersen, Pedersen, Peterson, Pettersson, Peyrot, Pistis, Posthuma, Purcell, Quiroz, Qvist, Rice, Riley, Rivera, Saeed Mirza, Saxena, Schoevers, Schulte, Shen, Shi, Shyn, Sigurdsson, Sinnamon, Smit, Smith, Stefansson, Steinberg, Stockmeier, Streit, Strohmaier, Tansey, Teismann, Teumer, Thompson, Thomson, Thorgeirsson, Tian, Traylor, Treutlein, Trubetskoy, Uitterlinden, Umbricht, Van Der Auwera, Van Hemert, Viktorin, Visscher, Wang, Webb, Weinsheimer, Wellmann, Willemsen, Witt, Wu, Xi, Yang, Zhang, Arolt, Baune, Berger, Boomsma, Cichon, Dannlowski, De Geus, Depaulo, Domenici, Domschke, Esko, Grabe, Hamilton, Hayward, Heath, Hinds, Kendler, Kloiber, Lewis, Li, Lucae, Madden, Magnusson, Martin, Mcintosh, Metspalu, Mors, Mortensen, Müller-Myhsok, Nordentoft, Nöthen, O'donovan, Paciga, Pedersen, Penninx, Perlis, Porteous, Potash, Preisig, Rietschel, Schaefer, Schulze, Smoller, Stefansson, Tiemeier, Uher, Völzke, Weissman, Werge, Winslow, Lewis, Levinson, Breen, Børglum and Sullivan2018; Howard et al., Reference Howard, Adams, Clarke, Hafferty, Gibson, Shirali, Coleman, Hagenaars, Ward, Wigmore, Alloza, Shen, Barbu, Xu, Whalley, Marioni, Porteous, Davies, Deary, Hemani, Berger, Teismann, Rawal, Arolt, Baune, Dannlowski, Domschke, Tian, Hinds, Trzaskowski, Byrne, Ripke, Smith, Sullivan, Wray, Breen, Lewis and Mcintosh2019), illustrating the importance of exploring genetic associations for specific symptoms. Our results revealed genetic heterogeneity in depressive symptoms with no overlap in significant loci across PHQ items. Though we acknowledge that the lack of overlap may be due to low statistical power to detect all true associations, we highlight some notable examples where a specific depressive symptom is linked to a gene that was previously found to be associated with a strongly related phenotype. For the item ‘sleep problems’, we found SNPs that implicate PAX8 (based on proximity), a transcription factor related to thyroid follicular cell development and expression of thyroid-specific genes, replicating previous studies linking this gene to sleep duration (Gottlieb et al., Reference Gottlieb, Hek, Chen, Watson, Eiriksdottir, Byrne, Cornelis, Warby, Bandinelli, Cherkas, Evans, Grabe, Lahti, Li, Lehtimaki, Lumley, Marciante, Perusse, Psaty, Robbins, Tranah, Vink, Wilk, Stafford, Bellis, Biffar, Bouchard, Cade, Curhan, Eriksson, Ewert, Ferrucci, Fulop, Gehrman, Goodloe, Harris, Heath, Hernandez, Hofman, Hottenga, Hunter, Jensen, Johnson, Kahonen, Kao, Kraft, Larkin, Lauderdale, Luik, Medici, Montgomery, Palotie, Patel, Pistis, Porcu, Quaye, Raitakari, Redline, Rimm, Rotter, Smith, Spector, Teumer, Uitterlinden, Vohl, Widen, Willemsen, Young, Zhang, Liu, Blangero, Boomsma, Gudnason, Hu, Mangino, Martin, O'connor, Stone, Tanaka, Viikari, Gharib, Punjabi, Raikkonen, Volzke, Mignot and Tiemeier2015; Jones et al., Reference Jones, Tyrrell, Wood, Beaumont, Ruth, Tuke, Yaghootkar, Hu, Teder-Laving, Hayward, Roenneberg, Wilson, Del Greco, Hicks, Shin, Yun, Lee, Metspalu, Byrne, Gehrman, Tiemeier, Allebrandt, Freathy, Murray, Hinds, Frayling and Weedon2016; Lane et al., Reference Lane, Liang, Vlasac, Anderson, Bechtold, Bowden, Emsley, Gill, Little, Luik, Loudon, Scheer, Purcell, Kyle, Lawlor, Zhu, Redline, Ray, Rutter and Saxena2017). In addition, SNPs associated with ‘depressed mood’ influenced the expression of KLHDC8B (protein coding gene involved in cytokinesis). This gene has been previously linked to depressed affect, a sub-cluster of neuroticism that is strongly related to depression (Nagel et al., Reference Nagel, Jansen, Stringer, Watanabe, De Leeuw, Bryois, Savage, Hammerschlag, Skene, Muñoz-Manchado, Agee, Alipanahi, Auton, Bell, Bryc, Elson, Fontanillas, Furlotte, Hinds, Hromatka, Huber, Kleinman, Litterman, Mcintyre, Mountain, Noblin, Northover, Pitts, Sathirapongsasuti, Sazonova, Shelton, Shringarpure, Tian, Tung, Vacic, Wilson, White, Tiemeier, Linnarsson, Hjerling-Leffler, Polderman, Sullivan, Van Der Sluis and Posthuma2018a).
Genetic correlations between depressive symptoms ranged from moderate (r g < 0.60) to high (r g > 0.90), suggesting that while some symptoms have high genetic overlap, a considerable amount of genetic variation is not shared between symptoms. This suggests genetic heterogeneity in symptoms of depression, in line with the finding that depression represents multiple dimensions of genetic risk (Kendler et al., Reference Kendler, Aggen and Neale2013) and previous associations between individual symptoms and specific polymorphisms (Myung et al., Reference Myung, Song, Lim, Won, Kim, Lee, Kang, Lee, Kim, Carroll and Kim2012).
The underlying genetic structure between symptoms was best explained by two genetic factors. While these factors were highly correlated, this suggests there are risk factors specific to clusters which could indicate underlying biology specific to either ‘psychological’ or ‘somatic’ symptoms of depression. This is consistent with symptoms differing in their biological correlates, with somatic symptoms such as weight gain, increased appetite and sleep problems being associated with higher levels of inflammation markers (Motivala et al., Reference Motivala, Sarfatti, Olmos and Irwin2005; Lamers et al., Reference Lamers, Vogelzangs, Merikangas, De Jonge, Beekman and Penninx2013). These clusters were not in full agreement with the three genetic factors found by Kendler et al. (Reference Kendler, Aggen and Neale2013) based on an analysis of twin data. As an example, in Kendler et al.’s study, suicidal ideation loaded onto the same factor as psychomotor changes and concentration problems, while we find that suicidal ideation clusters with symptoms of depressed mood, anhedonia and low self-esteem that together form a ‘psychological symptoms’ factor. However, results are not easily comparable given that they derived factors from a twin study (and therefore captured rare genetic variants as well as common SNPs), used a subset of eight symptoms (appetite changes did not load onto any factor) and symptom phenotypes came from structured clinical interview of lifetime major depression rather than a self-report measure such as the PHQ-9.
Results from genetic correlations between items and a range of external traits lead us to note three general observations. First, genetic correlations with external traits differed substantially between symptoms (with I 2 statistics suggesting this is largely due to heterogeneity), providing evidence for genetic heterogeneity in depressive symptoms. In agreement with previous findings for major depression (Howard et al., Reference Howard, Adams, Shirali, Clarke, Marioni, Davies, Coleman, Alloza, Shen, Barbu, Wigmore, Gibson, Hagenaars, Lewis, Ward, Smith, Sullivan, Haley, Breen, Deary and Mcintosh2018; Wray et al., Reference Wray, Ripke, Mattheisen, Trzaskowski, Byrne, Abdellaoui, Adams, Agerbo, Air, Andlauer, Bacanu, Bækvad-Hansen, Beekman, Bigdeli, Binder, Blackwood, Bryois, Buttenschøn, Bybjerg-Grauholm, Cai, Castelao, Christensen, Clarke, Coleman, Colodro-Conde, Couvy-Duchesne, Craddock, Crawford, Crowley, Dashti, Davies, Deary, Degenhardt, Derks, Direk, Dolan, Dunn, Eley, Eriksson, Escott-Price, Kiadeh, Finucane, Forstner, Frank, Gaspar, Gill, Giusti-Rodríguez, Goes, Gordon, Grove, Hall, Hannon, Hansen, Hansen, Herms, Hickie, Hoffmann, Homuth, Horn, Hottenga, Hougaard, Hu, Hyde, Ising, Jansen, Jin, Jorgenson, Knowles, Kohane, Kraft, Kretzschmar, Krogh, Kutalik, Lane, Li, Li, Lind, Liu, Lu, Macintyre, Mackinnon, Maier, Maier, Marchini, Mbarek, Mcgrath, Mcguffin, Medland, Mehta, Middeldorp, Mihailov, Milaneschi, Milani, Mill, Mondimore, Montgomery, Mostafavi, Mullins, Nauck, Ng, Nivard, Nyholt, O'reilly, Oskarsson, Owen, Painter, Pedersen, Pedersen, Peterson, Pettersson, Peyrot, Pistis, Posthuma, Purcell, Quiroz, Qvist, Rice, Riley, Rivera, Saeed Mirza, Saxena, Schoevers, Schulte, Shen, Shi, Shyn, Sigurdsson, Sinnamon, Smit, Smith, Stefansson, Steinberg, Stockmeier, Streit, Strohmaier, Tansey, Teismann, Teumer, Thompson, Thomson, Thorgeirsson, Tian, Traylor, Treutlein, Trubetskoy, Uitterlinden, Umbricht, Van Der Auwera, Van Hemert, Viktorin, Visscher, Wang, Webb, Weinsheimer, Wellmann, Willemsen, Witt, Wu, Xi, Yang, Zhang, Arolt, Baune, Berger, Boomsma, Cichon, Dannlowski, De Geus, Depaulo, Domenici, Domschke, Esko, Grabe, Hamilton, Hayward, Heath, Hinds, Kendler, Kloiber, Lewis, Li, Lucae, Madden, Magnusson, Martin, Mcintosh, Metspalu, Mors, Mortensen, Müller-Myhsok, Nordentoft, Nöthen, O'donovan, Paciga, Pedersen, Penninx, Perlis, Porteous, Potash, Preisig, Rietschel, Schaefer, Schulze, Smoller, Stefansson, Tiemeier, Uher, Völzke, Weissman, Werge, Winslow, Lewis, Levinson, Breen, Børglum and Sullivan2018), all symptoms overlapped with anxiety, schizophrenia, ADHD, insomnia, neuroticism and subjective well-being; however, the proportion of overlap varied considerably across symptoms. Second, some traits (such as bipolar disorder, cannabis lifetime use and intelligence) were significantly genetically correlated with a subset of items only. Bipolar disorder, for example, was significantly correlated with only four items (low self-esteem, concentration, psychomotor changes and sleep problems), suggesting that the moderate genetic overlap between bipolar and depression (Wray et al., Reference Wray, Ripke, Mattheisen, Trzaskowski, Byrne, Abdellaoui, Adams, Agerbo, Air, Andlauer, Bacanu, Bækvad-Hansen, Beekman, Bigdeli, Binder, Blackwood, Bryois, Buttenschøn, Bybjerg-Grauholm, Cai, Castelao, Christensen, Clarke, Coleman, Colodro-Conde, Couvy-Duchesne, Craddock, Crawford, Crowley, Dashti, Davies, Deary, Degenhardt, Derks, Direk, Dolan, Dunn, Eley, Eriksson, Escott-Price, Kiadeh, Finucane, Forstner, Frank, Gaspar, Gill, Giusti-Rodríguez, Goes, Gordon, Grove, Hall, Hannon, Hansen, Hansen, Herms, Hickie, Hoffmann, Homuth, Horn, Hottenga, Hougaard, Hu, Hyde, Ising, Jansen, Jin, Jorgenson, Knowles, Kohane, Kraft, Kretzschmar, Krogh, Kutalik, Lane, Li, Li, Lind, Liu, Lu, Macintyre, Mackinnon, Maier, Maier, Marchini, Mbarek, Mcgrath, Mcguffin, Medland, Mehta, Middeldorp, Mihailov, Milaneschi, Milani, Mill, Mondimore, Montgomery, Mostafavi, Mullins, Nauck, Ng, Nivard, Nyholt, O'reilly, Oskarsson, Owen, Painter, Pedersen, Pedersen, Peterson, Pettersson, Peyrot, Pistis, Posthuma, Purcell, Quiroz, Qvist, Rice, Riley, Rivera, Saeed Mirza, Saxena, Schoevers, Schulte, Shen, Shi, Shyn, Sigurdsson, Sinnamon, Smit, Smith, Stefansson, Steinberg, Stockmeier, Streit, Strohmaier, Tansey, Teismann, Teumer, Thompson, Thomson, Thorgeirsson, Tian, Traylor, Treutlein, Trubetskoy, Uitterlinden, Umbricht, Van Der Auwera, Van Hemert, Viktorin, Visscher, Wang, Webb, Weinsheimer, Wellmann, Willemsen, Witt, Wu, Xi, Yang, Zhang, Arolt, Baune, Berger, Boomsma, Cichon, Dannlowski, De Geus, Depaulo, Domenici, Domschke, Esko, Grabe, Hamilton, Hayward, Heath, Hinds, Kendler, Kloiber, Lewis, Li, Lucae, Madden, Magnusson, Martin, Mcintosh, Metspalu, Mors, Mortensen, Müller-Myhsok, Nordentoft, Nöthen, O'donovan, Paciga, Pedersen, Penninx, Perlis, Porteous, Potash, Preisig, Rietschel, Schaefer, Schulze, Smoller, Stefansson, Tiemeier, Uher, Völzke, Weissman, Werge, Winslow, Lewis, Levinson, Breen, Børglum and Sullivan2018) may be predominately driven by these selected symptoms. This highlights how insight into the genetic architecture of complex traits can be gained from conducting symptom-level analyses. Third, we found traits that were genetically correlated with individual items, but not with the sum-score phenotypes. Anorexia nervosa did not overlap with aggregate measures of depression symptoms as operationalised in the sum-score phenotypes, in agreement with Howard et al. (Reference Howard, Adams, Shirali, Clarke, Marioni, Davies, Coleman, Alloza, Shen, Barbu, Wigmore, Gibson, Hagenaars, Lewis, Ward, Smith, Sullivan, Haley, Breen, Deary and Mcintosh2018) who similarly found no genetic overlap between anorexia and their three overall depression phenotypes. Yet, anorexia nervosa was genetically correlated with appetite change, low self-esteem and psychomotor changes. Interestingly, the overlap with appetite change was in the opposite direction than the other two items, again emphasising the importance of analysing individual symptoms of a disorder, as important information is ignored by relying on sum-scores or overall phenotypes.
Limitations
The findings and conclusions of this study should be interpreted in view of some key limitations. First, despite having the largest sample available to date, the current study is still underpowered to detect significant SNPs. Given the relatively high prevalence of depression, much larger sample sizes are needed compared to other psychiatric disorders (Wray et al., Reference Wray, Pergadia, Blackwood, Penninx, Gordon, Nyholt, Ripke, Macintyre, Mcghee, Maclean, Smit, Hottenga, Willemsen, Middeldorp, De Geus, Lewis, Mcguffin, Hickie, Van Den Oord, Liu, Macgregor, Mcevoy, Byrne, Medland, Statham, Henders, Heath, Montgomery, Martin, Boomsma, Madden and Sullivan2012). To not reduce power further we did not correct for multiple testing (of 11 GWA analyses) and hence our GWAS results require independent replication. Second, depression items were analysed in isolation, regardless of the overall MDD status of the participant. For example, a participant could strongly endorse the symptom fatigue, yet have no other signs of depression and hence the endorsement of fatigue is unrelated to major depression. Nevertheless, it is possible that fatigue, regardless of the context it occurs in, possesses the same underlying genetic basis. Third, we used a PHQ-9 cut-off score of 1 to dichotomise items in order to maximise the number of cases and improve statistical power. A PHQ-9 item score of one does not meet the diagnostic criteria for endorsement, hence the phenotypes may represent a predisposition rather than full endorsement of the particular symptom. Fourth, our results may be affected by ascertainment bias due to healthy volunteerism within the UKBB. As such our sample could represent a truncated version of the population's genetic distribution for symptoms (people on the far end of liability scale may be less likely to participate), hence resulting in reduced number of cases for some symptoms or reduced variation between cases and controls.
Implications
The recent success in the discovery of genetic variants associated with depression has been driven by ever increasing sample sizes, an approach that has been favoured over reducing phenotypic heterogeneity. Consequently, GWASs have been conducted on a diverse range of depression-related phenotypes that often include a small subset of symptoms, generally with the view that the increase in sample size can overcome the lack of clinical precision. While this has indeed been proven to be effective at increasing the number of significant variants identified, our finding of symptom-level genetic heterogeneity raises questions about this approach. Using broad diagnostic phenotypes ignores the unique genetic factors associated with specific symptoms of depression that would likely provide useful information to further unravel the genetic architecture of depression. Further, our finding of genetic heterogeneity across depressive symptoms implicates that individuals with depression may show variation in disease pathogenesis. This variation may be linked to response to clinical interventions, such that patients presenting with specific symptom patterns (e.g. characterised primarily by somatic symptoms) may be expected to respond differently.
Conclusion
Our results provide evidence that current self-reported depressive symptoms are genetically heterogeneous, and highlight the utility of analysing the genetics of individual items or symptoms. Insights into the genetic aetiology and underlying biology of depression will be maximised by combining large-scale genetic studies of broad clinical definitions with follow-up studies of more refined phenotypic measures of specific diagnostic subtypes. Future studies should investigate to what extent genetic heterogeneity in depressive symptoms is recapitulated in clinical symptoms of depression.
Supplementary material
The supplementary material for this article can be found at https://doi.org/10.1017/S0033291719002526
Acknowledgements
This work was conducted using the UK Biobank Resource (application number 25331). The UK Biobank was established by the Wellcome Trust medical charity, Medical Research Council (UK), Department of Health (UK), Scottish Government and Northwest Regional Development Agency. It also had funding from the Welsh Assembly Government, British Heart Foundation and Diabetes UK.
Financial support
S.M. is supported by a National Health and Medical Research Council (NHMRC) Fellowship. A.T.M. is supported by the Foundation Volksbond Rotterdam.
Conflict of interest
None.