


The abundant bibliography on the possible association between the consumption of saturated fat and the incidence of cardiovascular disease, as well as various types of cancer (Lewis, Reference Lewis1988; Sofos et al. Reference Sofos, Harmayani and Smith1995) has provoked great concern among consumers and led to changes in their dietary habits, with a shift towards ‘light’ foods, in which the fat content is reduced or even completely eliminated. Many people have gone so far as to exclude traditional foods such as whole milk or other dairy products from their diet. These changes in dietary habits can cause deficiency-related problems, due to the absence of certain nutrients, such as amino acids, essential fatty acids, minerals or vitamins (Blaxter & Webster, Reference Blaxter and Webster1991).
In view of the properties attributed to it, goat milk is currently employed for various types of foods intended both for the young and for other population groups, depending on their specific requirements (Haenlein, Reference Haenlein2004; Park, Reference Park, Park and Haenlein2006; Park & Haenlein, Reference Park, Haenlein, Park and Haenlein2006). From a nutritional standpoint, this is justified on the basis of the specific composition presented by the different nutrients within goat milk, especially its protein and fat, which are aspects of its composition that differentiate it clearly from cow milk (Haenlein, Reference Haenlein2004; Park, Reference Park, Park and Haenlein2006). For some time, it has been suggested that goat milk protein could be more valuable than that of cow milk, in the light of its digestive and metabolic utilization. These considerations are explained by reference to the different fractional composition of the protein in the two types of milk, as well as the different levels of energy availability for protein utilization that are produced depending on the fat composition of each type of milk. With respect to the different classes of casein, goat milk contains lower levels of αs1-casein and so the coagulate formed in the stomach is softer and more easily broken down, which facilitates the action of proteinases both in the stomach and subsequently in the intestine, which may give rise to faster and more efficient digestion (Park, Reference Park1994, Reference Park, Park and Haenlein2006; López-Aliaga et al. Reference López-Aliaga, Alférez, Barrionuevo, Nestares, Sanz Sampelayo and Campos2003). The main difference between the composition of goat and cow milk concerns their fat content. Goat milk fat contains medium-chain triglycerides (MCT), made up of fatty acids whose carbon chain has 6–14 atoms of carbon; the MCT content in the goat milk fat normally approaches 30%, in contrast to cow milk fat, where these compounds do not exceed 20% (Haenlein, Reference Haenlein2004). MCT are characterized by the fact that they employ a different utilization route from that of long-chain triglycerides (Matsuo & Takeuchi, Reference Matsuo and Takeuchi2004). With respect to their digestibility, the fatty acids originating from MCT hydrolysis can be absorbed without re-esterification within the intestinal cells, entering the bloodstream directly, and transferred by the portal system to the liver and other peripheral tissues. They then penetrate the cell mitochondria where, with no need of acyl-CoA carnitine transferase, they are oxidized to produce a rapid discharge of energy that can be used by the organism in diverse metabolic processes, including protein synthesis (Velázquez et al. Reference Velázquez, Seto and Rombeau1996; Matsuo & Takeuchi, Reference Matsuo and Takeuchi2004; Sanz Sampelayo et al. Reference Sanz Sampelayo, Fernández, Ramos, Hermoso, Gil Extremera and Boza2006).
Taking these considerations into account, the objective of the present study was to investigate the N and the energy utilization of diets whose protein and fat content was derived entirely from goat milk or from cow milk. To the best of our knowledge, this is the first published research on this subject.
Materials and Methods
Animals and diets
The study was carried out with 40 weaned male Wistar rats (Harlan Interfauna Ibérica, Barcelona, Spain) of initial weight 40±2 g. Eight of these animals were killed immediately upon arrival at the laboratory and the rest were divided into four groups of eight animals. They were kept in individual metabolism cages, inside an ecologic chamber (21–24°C, 50–60% relative humidity, diurnal light cycle of 12 h) for 4 weeks, and then killed on the last day of this period. Each of the four groups of animals was fed a different diet, varying in its protein and fat content, as follows: diet 1 (D1) contained fat and protein from goat milk; diet 2 (D2) had fat from cow milk and protein from goat milk; diet 3 (D3) had fat from goat milk and protein from cow milk; diet 4 (D4) had fat and protein from cow milk. The protein in the diets was obtained from powdered skim goat milk (Lácteas Cobreros, Zamora, Spain) or skim cow milk (Puleva S.A., Granada, Spain). The fat source was goat milk cream (Lácteas Cobreros, Zamora, Spain) or cow milk butter (Puleva S.A., Granada, Spain). The diets were prepared in such a way that they contained 10% protein (UNU, Reference Pellet and Young1980) and 10% fat (Alférez et al. Reference Alférez, Barrionuevo, López-Aliaga, Sanz Sampelayo, Lisbona, Robles and Campos2001). Table 1 shows the ingredients and chemical composition of the four experimental diets.
Ingredient composition (g/kg diet), chemical composition and gross energy content of experimental diets
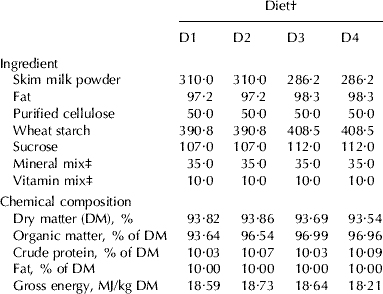
† Diet: D1=protein and fat from goat milk, D2=protein from goat milk and fat from cow milk, D3=protein from cow milk and fat from goat milk, D4=protein and fat from cow milk
‡ Mineral and vitamin mixed were prepared according to the recommendations of the America Institute of Nutrition (Reeves et al. Reference Reeves, Nielsen and Fahey1993)
In accordance with the protein content of the goat skim milk powder and cow skim milk powder, the necessary quantity was taken to provide the total amount of protein required for each diet. As in each case skim milk contains a small amount of fat, the amount needed for each diet was obtained from goat milk cream or cow milk butter. To do so, the necessary quantities of these materials were melted in a bain-marie and then centrifuged (Hetticj; Universal 30 RF, Germany) at 4°C and at 4000 rpm for 15 min, to separate out the supernatant fraction, which was composed entirely of fat. Each diet contained 5% purified cellulose as well as 3·5% mineral mix and 1% vitamin mix, as recommended by the American Institute of Nutrition (Reeves et al. Reference Reeves, Nielsen and Fahey1993). In each case, the mineral mix was prepared taking into account the mineral composition of the corresponding skim milk powder. To complete the composition of each diet, wheat starch and saccharose were added, in proportions similar to those recommended by the American Institute of Nutrition (Reeves et al. Reference Reeves, Nielsen and Fahey1993).
Experimental procedure
The animals consumed the diets ad libitum and had free access to water throughout the assay period. During the first 3 weeks, the individual food intake and the body weight (BW) were recorded twice weekly. During the final week of the experimental period, a balance assay was performed and the food intake was quantified daily, and the faeces and urine produced by each animal were collected. Urine was collected in 0·5% HCl (v/v). Following the balance assay, all the animals were killed by an intraperitoneal injection of sodium pentobarbital (Pentothal; Abbot, Madrid, Spain). Then the stomach and intestines of each animal were emptied and cleaned and the bodies stored at −20°C until required for analysis. The animals that had been killed on arrival at the laboratory were dealt with in the same way. All management and experimental procedures conducted in this study were carried out in strict accordance with the requirements of the EU and Spanish rules and guidelines regarding the ethical treatment of laboratory animals (Jefatura del Estado, Reference Jefatura del2007). While still frozen, the animal bodies were minced in a Retsch ZM1 mill (Retsch, Haan, Germany), using liquid nitrogen and a 1-mm matrix size. After mincing, samples were stored at −20°C until required for analysis.
Measurements and analysis
Dry matter (DM) was determined by oven-drying at 100±2°C for 24 h. Nitrogen was measured using a Kjeldahl method (AOAC, 2005). Protein-N was calculated as the difference between total N and non-protein N (NPN). Total N was determined from whole skim milk powder samples. After preparing a solution of each type of skim milk powder, the NPN content was determined on a filtrate of the solutions after precipitation with 12% (w/v) trichloroacetic acid. Protein-N values were converted to protein by multiplying by a factor of 6·38. The fat content of the skim milk powders was measured by the Gerber method (AOAC, 2005) after preparing a solution of each one. Concentrations of Ca, Mg, Fe, Cu and Zn were determined by atomic absorption spectrophotometry (Perkin-Elmer 1100 B1; Perkin-Elmer, Shelton CT, USA) by a wet ashing method (Alférez et al. Reference Alférez, López Aliaga, Nestares, Díaz-Castro, Barrionuevo, Ros and Campos2006). The concentration of P was determined by visible spectrophotometry (Perkin-Elmer UV/vis spectrometer Lambda 16) using the Fiske-Subbarow technique (Fiske & Subbarow, Reference Folch, Less and Stanley1925).
The protein-fraction composition was established by the NIRS methodology (Burns & Ciurzak, Reference Fabre and Freund2001; Gómez-Ruiz et al. Reference Gómez Ruiz, Miralles, Agüera and Amigo2004). A continuous-spectrum monochromator spectrophotometer (Foss-NIRSystem 6500, Foss Inc., Silver Spring MD, USA) fitted with a gyro mechanism, scanning from 400 to 2500 nm, was used to obtain the spectra of the milk samples. Spectra were compiled using ISI NIRS3 version 2.05 (Infrasoft International, Port Matilda PA, USA). Chemometric processing of the spectroscopic data was performed using the program Winisi II, version 1.04 Foss-NIRSystem/Tecator (Infrasoft International). Preparation of the skim milk powder samples for analysis consisted of obtaining a solution of each skim milk powder, heating to 40°C, and then introducing a fibreglass filter (Millipore AP40, Millipore, Billerica MA, USA) soaked in the milk solutions.
To determine the fatty acid composition of the goat and cow milk fat, fatty acid methyl esters were prepared (Lepage & Roy, Reference Lepage and Roy1986). These were separated in an Autosystem GC (Perkin-Elmer, Norfolk CT, USA) fitted with an SP-2560 fused silica capillary column [100 m long, 0·25 mm (i.d.), 0·20 μm film; Supelco Bellefonte PA, USA] equipped with a flame ionization detector. The temperature was programmed from 150°C to 185°C at 5 deg C/min held for 30 min and then to 230°C at 5 deg C/min held for 26 min. The carrier gas was N2. Injector and detector temperatures were 250°C and 300°C, respectively. Peaks for individual fatty acids were identified using pure methyl ester standards (Supelco, Bellefonte PA). Standards for CLA isomers (cis-9, trans-11, CLA and trans-10, cis-12 CLA) were obtained from Matreya Inc. (Pleasant Gap PA, USA). Peak areas for individual fatty acids were corrected for recovery using a butter-oil reference standard (CRM 164, Commission of the European Community Bureau of References, Brussels, Belgium).
Samples of faeces, urine and body mass were analysed for DM, N and energy content. Fat content of body mass was also determined. DM was determined by lyophilization and N content using a Kjeldahl method (AOAC, 2005). The energy content of the samples was determined by adiabatic bomb calorimeter (CBA-305; Gallenkamp, London, UK). The fat content (neutral lipid fraction plus phospholipid fraction) of body mass was determined by extraction with a chloroform-methanol mixture (2:1, v/v; Folch et al. Reference Frankhuizen, Burns and Ciurczak1957). The weights of protein and fat deposited were measured by the comparative slaughter method, i.e. the body composition of animals killed at the beginning and 30 d after starting the experiment. Energy retained as protein and as fat were calculated by multiplying the weight of protein deposited by 23·8 (kJ/g protein) and the weight of fat deposited by 39·8 (kJ/g fat) (Brouwer, Reference Brouwer and Blaxter1965; Van Assendelft et al. Reference Van Assendelft, Mook and Zijilstra1973). As energy retained is primarily protein and fat, this was calculated as the sum of energy retained as protein and energy retained as fat. Heat production was calculated as the difference between metabolizable energy (ME) intake and total energy retained. Values for each individual animal were calculated from its mean body weight over the experimental period, between days 0 and 30 after starting the experiment. Finally, heat loss associated with protein oxidation was calculated as the difference between the corresponding ME intake and energy retention. In the same way, heat loss associated with fat oxidation was calculated with the assumption that fat deposition was entirely of dietary origin (Astrup et al. Reference Astrup, Buemann, Flint and Raben2002; Sanz Sampelayo et al. Reference Sanz Sampelayo, Fernández, Ramos, Hermoso, Gil Extremera and Boza2006).
Statistical analysis
N intake, N balance, energy intake and energy balance data were analysed using Statgraphics statistical software (Statgraphics, 2001). The model took into account the two factors involved (protein and fat source in the diet) and the interaction between them. When the interaction term was not statistically significant (P>0·05), the least-squares means were calculated from the model omitting this term. Duncan's multiple range test was used to determine the differences among means. Tables describe the mean values, rsd (square root of the error mean square) and the level of significance of the effects.
Results
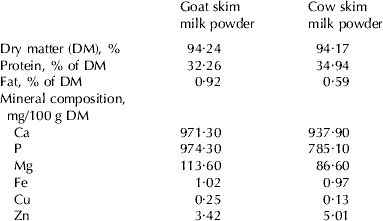
Table 2 shows the composition of goat skim milk powder and cow skim milk powder. Differences in the mineral content reveal that goat skim milk powder contained a greater concentration of Ca, P, Mg and Cu. On the other hand, there were no differences regarding Fe, and only minor ones in the case of Zn. Table 3 shows the protein fraction composition of the protein in the goat and cow skim milk powder, and Table 4 shows the fatty acid profile of the goat milk cream and the cow milk butter. In both cases, the differences are conspicuous, reflecting the different composition of the protein and fat in these two types of milk.
Composition of goat skim milk powder and cow skim milk powder
Protein fraction composition (g/100 g total protein) of goat milk protein and cow milk protein
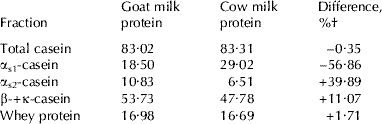
† Differences between goat milk protein value and cow milk protein value [(goat milk protein value−cow milk protein value)/goat milk protein value×100]
Fatty acid composition (g/100 g fatty acids) of goat milk fat and cow milk fat

† MCFA=medium chain fatty acids, SFA=saturated fatty acids, MUFA=monounsaturated fatty acids, PUFA=polyunsaturated fatty acids
‡ Differences between goat milk fat value and cow milk fat value [(goat milk fat value−cow milk fat value)/goat milk fat value×100]
Table 5 shows the results for utilization of N by diet consumed as well as the results of the statistical analysis. The dependent variables measured included N intake, faecal and urinary N excretion, digestible N (N intake less faecal excretion) and N retained (digestible N less urinary excretion). All values are expressed as g per unit of metabolic body weight per day (g/kg0·75 per d). In order to analyse the efficiencies with which N intake was utilized for digestion and metabolism, the ratios indicative of such efficiencies were calculated. The protein source affected (P<0·05) values of faecal N excretion, digestible N, retained N, digestible N/intake N, retained N/intake N and retained N/digestible N. Except in the case of faecal N excretion, all these values were higher in the animals fed diets with goat milk protein. The fat source affected (P<0·05) urinary N excretion, retained N, retained N/intake N and retained N/digestible N. Except in the case of urinary N excretion, all these values were higher in the animals fed diets with goat milk fat. The interaction between factors for urinary N excretion was significant (P<0·05); the mean value for the diet with goat milk protein and fat was lower than that corresponding to the one with cow milk protein and fat.
Effect of protein and fat source in the diet on nitrogen intake and excretion

† Protein source=main effect of protein source; fat source=main effect of fat source; P×F=protein source×fat source interaction
‡ rsd=residual standard deviation
§ P>0·05; *P<0·05; **P<0·01; ***P<0·001; a, b, c values with different superscript letters are different
Table 6 shows the results for energy utilization by diet consumed, together with the results of the corresponding statistical analysis. The parameters measured included gross energy intake, faecal and urine energy excretion, digestible energy intake (gross energy intake less faecal energy excretion), ME intake (digestible energy intake less urine energy excretion), energy retained as protein, energy retained as fat, total energy retention, total heat loss (ME intake less total energy retention), heat loss associated with protein oxidation and heat loss associated with fat oxidation, all expressed as kJ/kg0·75 per d, as well as the energy efficiencies. Protein source influenced the digestible energy intake/gross energy intake (P<0·05) with higher values being recorded in the animals fed diets with goat milk protein. Fat source influenced faecal energy excretion, total energy retained, energy retained as fat, digestible energy intake/gross energy intake, total energy retained/ME intake, and heat loss associated with fat oxidation/total heat loss (P<0·05). Except in the case of digestible energy intake/gross energy intake and heat loss associated with fat oxidation/total heat loss, all these values were lower in the animals fed diets with goat milk fat. Together with this, heat loss associated with protein oxidation/total heat loss tended (P=0·13) to be also lower in the animals fed diets with goat milk fat. The interaction between factors for digestible energy intake/gross energy intake was significant (P<0·05); the mean value for the diets with goat milk protein was higher but only when the fat was also from goat milk.
Effect of protein and fat source in the diet on energy intake and excretion
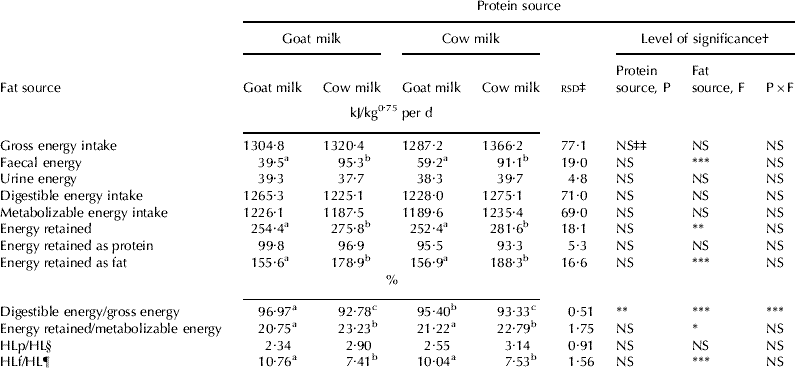
† Protein source=main effect of protein source; fat source=main effect of fat source; P×F=protein source×fat source interaction
‡ rsd=residual standard deviation
§ HLp/HL=heat loss associated with protein oxidation/total heat loss
¶ HLf/HL=heat loss associated with fat oxidation/total heat loss
‡‡ P>0·05; **P<0·01; ***P<0·001; a, b, c values with different superscript letters are different
Discussion
Utilization of protein
Children with intolerance to the protein in cow milk show that when the latter is replaced by goat milk, it is better tolerated and its digestive utilization is higher (Fabre, Reference Fiske and Subbarow1997; Grzesiak, Reference Grzesiak and Freund1997; Reinert & Fabre, Reference Fiske and Subbarow1997). López-Aliaga et al. (Reference López-Aliaga, Alférez, Barrionuevo, Nestares, Sanz Sampelayo and Campos2003), in a study in which rats were fed diets in which only part of the protein was derived from cow milk or goat milk, reported better digestibility and N balances when the diet utilized was the one containing protein from goat milk. The better digestive utilization of goat milk protein compared with the cow counterpart is probably due to its softer curd formation, which is more easily broken down by the action of the stomach proteinases, resulting in higher digestibility (Park, Reference Park1994, Reference Park, Park and Haenlein2006). This different behaviour results from the differences in composition, especially with respect to the casein fractions. As shown in the present study, the protein in cow milk has a higher proportion of αs1-casein (Haenlein, Reference Haenlein2004). The high degree of genetic polymorphism among goats, related to the levels of αs1-casein in their milk, would account for the different behaviour of the casein fractions in the stomach (Ambrosoli et al. Reference Ambrosoli, Di Stasio and Mazzoco1988; Haenlein, Reference Haenlein2004). As for the possible effect of the nature of the fat in the two types of milk on the digestive utilization of protein, Aurousseau et al. (Reference Aurousseau, Vermorel, Theriez and Vezinhet1989) commented that MCT could give rise to higher levels of protein digestibility, as the easy hydrolysis of these compounds in the stomach facilitates the degradability of the protein content of the coagulate that contains both nutrients. From the results of the present study we may conclude that the digestive utilization of the protein in the different diets was determined by its origin, and that there was no influence of the nature of the fat; better results were obtained when the protein was derived from goat milk.
With respect to the metabolic utilization of the digestible protein of goat or cow milk, as determined by the nature of the fat it contains, goat milk fat might be expected to have a greater effect due to its higher content of MCT. These compounds not only result in faster, more efficient digestion than is achieved by long-chain triglycerides (García Unciti, Reference García Unciti1996; Alférez et al. Reference Alférez, Barrionuevo, López-Aliaga, Sanz Sampelayo, Lisbona, Robles and Campos2001), but they also give rise to powerful, fast oxidative metabolism, thus showing themselves to be excellent sources of energy that could be made use of in various metabolic processes, including protein synthesis (Velázquez et al. Reference Velázquez, Seto and Rombeau1996; Matsuo & Tekeuchi, Reference Matsuo and Takeuchi2004). The results obtained in the present study suggest that the metabolic utilization of N is dependent on the protein source and on dietary fat, with that obtained from goat milk exercising a positive effect. This protein-sparing effect of the goat milk fat would be a consequence of its particular nature, an aspect that is highlighted in this study by the fatty acid profile of the two types of milk fat.
Utilization of energy
Diet-induced thermogenesis plays an important role in regulating energy balance and, consequently, body composition (Trayhurn et al. Reference Trayhurn, Goodbody and James1982). The macronutrient composition of the diet influences this thermogenesis, and therefore the total flow of energy lost as heat by the organism (Rothwell, Reference Rothwell1979). The nature of dietary fat, with respect to its fatty acid composition, can influence diet-induced thermogenesis and, hence, fat deposits in the body (Shimomura et al. Reference Shimomura, Tamura and Suzuki1990). Various experimental results have suggested that MCT are oxidized as an energy source faster and more intensely than are long-chain triglycerides; therefore, they are deposited in the body in smaller quantities, which gives rise to an increase in diet-induced thermogenesis (Su & Jones, Reference Su and Jones1993; Matsuo & Takeuchi, Reference Matsuo and Takeuchi2004). In rats fed the same diet, in terms of energy, containing MCT or saturated fatty acids, both the weight gain and the quantity of fat deposits were lower when the diet contained MCT; moreover, the rate of basal metabolism was higher (Senior, Reference Senior1990). Matsuo & Takeuchi (Reference Matsuo and Takeuchi2004) report that MCT have a particular metabolic destination, which accounts for the difference observed with these compounds concerning postprandial thermogenesis. The fatty acids in these compounds penetrate the mitochondria of the liver cells, independently of acyl-CoA carnitine transferase. The acyl-CoA formed during β-oxidation may subsequently be oxidized via the Krebs cycle, to form CO2 and water (Velázquez et al. Reference Velázquez, Seto and Rombeau1996). The level of enzymes in the Krebs cycle, considered to be an indicator of oxidative capacity in the mitochondria, is lower when MCT are consumed. Matsuo & Takeuchi (Reference Matsuo and Takeuchi2004) report that this greater oxidative capacity is related to the mechanisms that determine the lower level of fat deposited when MCT are consumed, a consequence of the greater thermogenesis produced with consumption of a diet including these compounds. The latter authors remark that this particular metabolism is indicative of the possible utility of MCT for certain treatments for obesity.
The present results may be attributed to the differences in composition of cow and goat milk fats. The particular metabolism of MCT would mean that consumption of diets containing fat from goat milk would produce lower levels of retained energy, in the form of fat, as a consequence of the greater heat loss associated with their oxidation. Accordingly, there would also be a lower overall efficiency of utilization of ME consumed. Moreover, if the energy derived from the oxidation of fat can be used for protein synthesis such as is deduced from the present study, then a logical consequence would be a greater deposition of protein. From the above results, it might also be possible to calculate the final composition of the animals' live body weight. In the present experimental case, the BW of the animals did not differ (mean value=154·4±0·3 g) which reflects the absence of effects on growth. Other than this, the most important aspect of interest is that the fat in goat milk produces a lower level of fat retention, and thus the BW would tend to contain a lower proportion of fat.
Conclusions
The protein of goat milk is more digestible than that of cow milk. The digestible protein in both types of milk produces a metabolic utilization that depends both on its own nature and on that of dietary fat.
Goat milk fat, owing to its high content of MCT, intervenes more actively in diet-induced thermogenesis than does cow milk fat, producing lower levels of fat deposition and greater amounts of protein in the body. This leads us to deduce the existence of a protein-sparing effect of goat milk fat.
Since goat milk has certain advantages over cow milk (i.e., its hypoallergenicicity and less problematic in terms of lactose intolerance) these properties should be sought in the raw materials used for various dairy foods for the young and the elderly. The results of the present study should be considered in deciding which type of milk should be used.
This study was supported financially by the Consejería de Innovación, Ciencia y Empresa. Junta de Andalucía. Spain. (Project: C03-045).



