I. INTRODUCTION
Trivalent ytterbium ion (Yb3+) is a very attractive laser ion with some unique characteristics. The two-energy level structure of Yb3+ (2F 7/2 ground state and the 2F 5/2 excited state) causes no up-conversion, no luminescence quenching and can easily be obtained with commercial diodes. The electronic configuration 4f 13 causes a stronger electron-phonon interaction to make the optical spectra of crystal show broad absorption and emission bands.Reference Tsang and Binks1–Reference Wang, Wang, Li and Zhang4 As a rare-earth ion with the simplest energy level structure, it has many important merits such as high efficiency in energy conversion, longer fluorescence lifetime, larger capacity for effective energy storage, no excited-state absorption, and so forth. Because of the strong peak of absorption at wavelength ∼970 nm, it is capable of being effectively coupled with the pump wavelength of laser diode (LD) to generate the ∼1-μm laser or ∼500-nm blue-green laser, which were generally used in the fields of atmospheric studies, military applications, medical procedures, storage and so forth.
Crystal ZnWO4 has the monoclinic structure with P2/c space group. Its lattice parameters are: a = 0.469 nm, b = 0.572 nm, c = 0.493 nm, and β = 90005’. ZnWO4 is known as a laser host and a promising material as scintillator, optical fiber and so forth. And so, in this work, we grew the good quality ZnWO4:Yb3+ single crystal by Czochralski method and investigated the spectroscopic property and the laser output.
II. EXPERIMENTS
Using pure ZnO (99.99%), WO3 (99.99%), Yb2O3 (99.997%) and K2CO3 (99.99%), single crystal ZnWO4:Yb3+ was grown by the Czochralski technique. The chemical reaction is as following:

Here, the doped concentration x is 4 at.%. The initial compounds were mixed in carnelian bowl and sintered for almost 3 days at 1020 °C. Then the charge was deposited in a Pt crucible bowl of Φ55 mm × 30 mm and placed in the DJL-400 furnace (Beijing Opto-Electronics Technology Co. Ltd., Beijing, China). With the Pt-wire rotating at a rate of 12 rpm and the pulling rate of 1.2 mm/h, the crystal was grown. When the procedure was over, the crystal was drawn out and cooled down to room temperature at a rate of 10–30 °C/h.
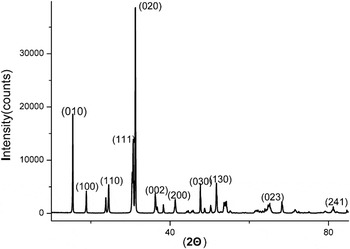
The x-ray powder diffraction investigations were carried out with CAD4 diffractometer (Rigaku Corporation, Matsubara, Japan) equipped with Cu Kα radiation (λ = 1.54056 Å). The data was collected using Ni-filtered Cu-target tube (Shanghai Precision Instrument Co., Ltd., Shanghai, China) at room temperature in the 2θ range from 50 to 850. Figure 1 shows the diffraction patterns, which is in good accordance with the standard JCPDS card (No. 73 0554) of ZnWO4.
The XRD of crystal ZnWO4:Yb3+.

The crystal was oriented by YX-2 X-ray Crystal Orientation Unit produced by Dandong Radioactive Instrument Co. Ltd. (Dandong City, China) and was cut into several samples. Sample used for spectroscopic measurements was optically polished to flat.
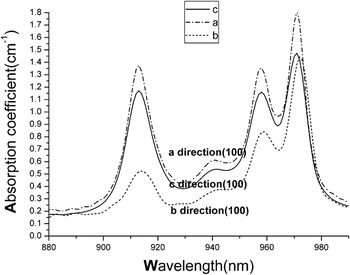
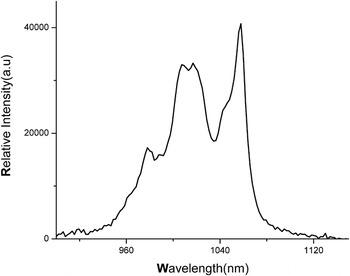
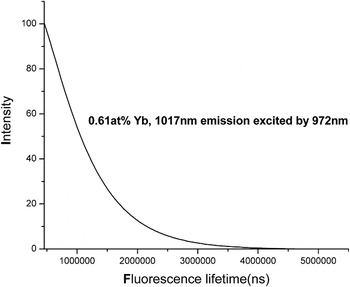
The absorption spectrum of crystal ZnWO4:Yb3+ measured by Lamda900 spectrometer (Perkin-Elmer UV-VIS Spectrometer, Santa Clara, CA) in the range of 800–1200 nm at room temperature was shown in Fig. 2. The luminescence spectrum measured by FLS920 at room temperature using a CW xenon lamp (Edinburgh Instruments Ltd., Edinburgh, UK) as the exciting source was shown in Fig. 3. The decay curve was shown in Fig. 4 and the fluorescence lifetime τ f was measured to be 0.644 ms.
Absorption spectra along crystallographic axes a, b, c directions of crystal ZnWO4:Yb3+.

Room emission spectrum of ZnWO4:Yb3+ excited by 972 nm.

Room fluorescence decay curve of ZnWO4:Yb3+.

Pumping crystal ZnWO4:Yb3+ with the 975 nm LD, the laser property was investigated. The used laser crystal ZnWO4:Yb3+ was cut with dimension of (3 × 3 × 2 mm3).
III. RESULTS AND DISCUSSION
The concentration of Yb3+ in ZnWO4 was measured to be 0.3411 wt% (0.61 at.%) by inductively coupled plasma atomic emission spectrometry method (ICP-AES instrument, HORIBA Ltd., Edison, NJ). So, the calculation of segregation coefficients of the dopant in crystals “K” was performed using the following relationship:

Here molesYb is the mole fraction of dopant and trivalent host ion, respectively, in the crystal (numerator) and in the melt (denominator).The segregation coefficient of Yb3+ in ZnWO4 was obtained to be 0.3.
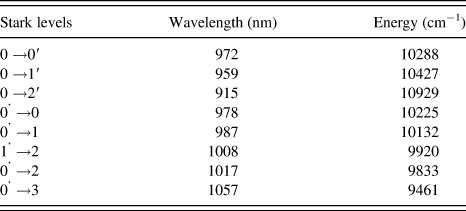
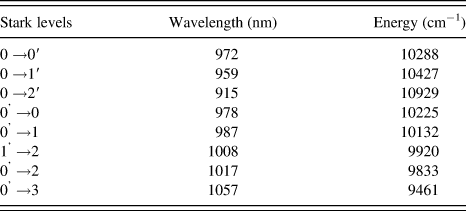
Figure 2 shows the absorption spectra of ZnWO4:Yb3+ along three crystallographic axes at room temperature. Three absorption peaks centered at 915 nm, 959 nm, 972 nm are associated with the transitions from the lowest Stark level (0) of the ground state 2F7/2 to three Stark levels (0’, 1’, 2’) of the excited state 2F5/2. The transition energies were shown in Table I. The absorption spectrum related to the transition 0 →1’ and 0 →2’ shows wide absorption region due to the strong interaction of Yb3+ with the phonons. The absorption line with maximum intensity at 972 nm has a full width at half maximum (FWHM) of 12 nm. The absorption cross section was defined as per following equations:


The transition energies of ZnWO4:Yb3+.
Here, σ α is the absorption cross section; a is the absorption coefficient, A is the absorbance, L is the thickness of the polished crystal, and Nc is the doped ion concentration in atoms (Here its value is 0.61 at.% Yb3+). Based on the absorption spectra, the absorption cross section versus wavelength was obtained. At 972 nm, the absorption cross sections σ α along a, b, c axes are 2.6 × 10⁻²⁰ cm2, 2.0 × 10⁻²⁰ cm2, 2.1 × 10⁻²⁰ cm2, respectively. The average is 2.2 × 10⁻²⁰ cm2.
A fact that the energy level splitting is different with different temperature was established in this work. The splitting of zero-line can be evaluated by the transition of 0-0′, whose absorption peak is centered at 972 nm. At low temperature, the splitting of zero-line is apparent, which could be explained by the presence of host material or reabsorption-emission process. But, the absorption spectrum at room temperature shows that the splitting of zero-line emission is invisible. The difference was also shown in the referenced absorption figures of M.O. Ramirez et al.Reference Ramírez, Bausá, Cavalli and Bovero5 The splitting of zero-line occurred only at low temperature could be explained to be the interactions between Yb3+ and phonon that induce the difference. At lower temperature, the crystal thermal vibration will be slower to induce the weaker interaction between phonon and ytterbium ion. So, the low temperature absorption could reflect the real splitting of energy levels.
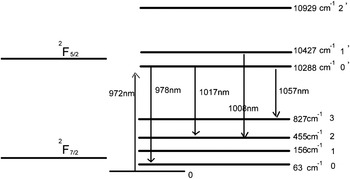
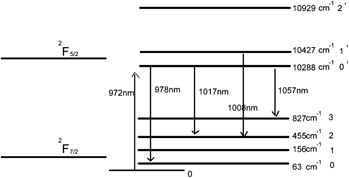
Figure 3 shows the fluorescence spectrum excited with 972 nm radiation. The emission band associated with transition of 2F5/2→ 2F7/2 was observed in the region of 900–1100 nm. There were five broad emission bands centered at 978 nm, 987 nm, 1008 nm, 1017 nm and 1057 nm in the fluorescence spectrum. We noticed that the two peaks at 1008 nm and 1017 nm were separate symmetrically, and the intensity centered at 1057 nm was quite strong. The phenomenon could be explained by two reasons. One reason: The emission peak centered at 1057 nm was similar to Nd3+. So, at first we estimated that the now single crystal Yb3+: ZnWO4 was doped with minor little Nd3+, which could come from the used Yb3+ (we know, although the purity of used Yb3+ was 99.997%, that the Nd3+ might inevitably exist). With the use of ICP-AES, the concentration of Nd3+ was measured to be 0.0026 at.%. Thus the explanation for most lines centering at 1057 nm might be the result of  energy transfer. The idiographic discussion could refer to the article written by D. Jaque et al.Reference Jaque, Ramírez, Bausa, García Solé, Cavalli, Speghini and Bettinelli6. The two peaks 1008 nm and 1057 nm might come from the interactions between Yb3+ and Nd3+. The others among the most possible reasons: Compared with concentration of Yb3+ (0.61 at.%), the concentration of Nd3+ was so small (0.61/0.0026 = 234). The volume concentration of Nd3+ was estimated to be 1017 cm−3, which indicated that the Nd3+ was sensitized with difficulty to emit such a strong intensity of light. If it were true, the phenomenon might have resulted from the self-splitting of energy levels of Yb3+ in crystal field. ZnWO4 has the monoclinic structure with C2/h point-group symmetry and P2/c space group. Its lattice parameters a = 4.72 Å, b = 5.70 Å, c = 4.95 Å, and β = 90005′. Zinc ions are in the octahedral positions. Doped in ZnWO4, Yb3+ replaces the zinc ion to be in the octahedral position, and then it is affected by a strong crystal field. From the energy levels illustration (Table I), the peak centered at 1057 nm could be the transition of
 (10288-827 = 9461 cm−1, (1057 nm).) We know that the intensity was always low because of the transition possibility
 was actually small. Thus, in the instant case, the strong intensity might indicate the transition
 was excited by the strong crystal field. The peak centered at 1008 was associated with transition 1′ →2. The energy levels of ZnWO4:Yb3+ were calculated as shown in Fig. 5. The so-strong intensity emission peaks centered at 1057 nm was suitable for commercial 1-μ m laser.
The energy levels of ZnWO4:Yb3+ crystal.

The fluorescence lifetime at 1017 nm is measured to be 644μ s at room temperature. The emission cross-sections can be calculated by means of the Fuchtbauer Ladenburg (F–L) equation:Reference Deloach, Payne and Chase7, Reference Pujol, Bursukova and Guell8
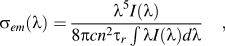
where n is the refractive index with a value of 2.25, c is the speed of light, I (λ) is the relative fluorescence intensity, τ r is the radiative lifetime that can be obtained with the following equation:
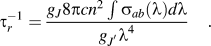
 ,
 are the degeneracy of 2F7/2 and 2F5/2 energy levels. Then, the emission cross section versus wavelength was obtained. At 1017 nm, the emission cross sections σ em was 1.7 × 10⁻²⁰ cm2. The radiative lifetime at 1017 nm was calculated to be 0.209 ms.
Based on the spectral data, laser parameters such as β min, I sat, I min can be used to evaluate the performance of crystal doped with Yb3+. The parameters are defined as following equations:

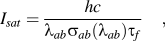

Here, β min is the minimum inverse fraction; I sat is the pump saturation intensity; I min is the minimum pump intensity; λ ab is the pump wavelength and λ ext is the excited wavelength. The parameters were obtained to be 4.6%, 14.4 Kw/cm2, 0.66 Kw/cm2, respectively. As a result, the laser parameters compared with other Yb3+-doped crystals are shown in Table IIReference Chen, Lin, Lin and Luo9–11 The larger value of στf in Yb3+:ZnWO4 has higher quality factor and lower threshold.
The spectral and laser parameters of some crystals doped with Yb3+.

The laser output was also evaluated. The resonator was made up of a pair of mirrors: M1 transmitted (HT>) 95% of the pump radiation and highly reflected (HR>) 99.9% at the 1017 nm wavelength; M2 transmitted (T=) 3% at 1017 nm and reflected (HR>) 99.9% at 972 nm. All of the other faces of the crystals were polished and transmitted highly at the laser and Stokes wavelength. The room temperature was 293 K and the whole length of the cavity was about 30 mm. The highest output power at wavelength 1017 nm was obtained to be 0.5 W, corresponding to the pumping power of 10 W and the threshold was about 2 W. Compared with the laser parameters mentioned above, we can observe that the larger value of στf contributes to the description of the laser property. The spectroscopic parameters such as emission cross-sections σem can reflect the laser output efficiency and power. The lower laser output of 0.5 W originated from the lower emission cross sections.
IV. CONCLUSION
Single crystal ZnWO4:Yb3+ has been grown by Czochralski method and characterized with optical spectroscopic techniques. The strange room temperature absorption and emission spectra indicate that the interaction between phonon and Yb3+ are stronger at room temperature than lower temperatures. The decay lifetime was 0.209 ms. The Stark-level components of the 2F 7/2,2F 5/2 and crystal filed splitting were also determined. The laser parameters β min, I sat, I min were calculated to be 4.6%, 14.4 Kw/cm2, 0.66 Kw/cm2, respectively. The highest output power at wavelength 1017 nm was obtained to be 0.5 W, corresponding to the pumping power of 10 W and the threshold was about 2 W.
ACKNOWLEDGMENTS
This project was supported by Major Projects from FJIRSM (SZD08001-2 and SZD09001), National Nature Science Foundation of China (No. 50902129) and Fund of Research Center of Laser Technology Integration and Application Engineering Technology of Haixi Industrial Technology Research Institute (2009H2009), Fujian Jiangxia University generally project (2011B025).