

INTRODUCTION
This article reports on a study of standardization and language change in the Basque town of Oiartzun. In particular, it examines the extent to which features from a newly invented Basque standard called Batua, developed and promulgated in 1960s and 1970s, may be diffusing into the local dialect. In an effort to study this process of dialect contact and possible change in progress, this article analyzes variation between Batua and local dialectal forms of four variables.
The main claim of this article is that these processes of language contact and diffusion have been shaped by rapid social and economic changes in Oiartzun and in the Basque Country more generally since 1975. Increased mobility and housing development in Oiartzun in recent years have brought many newcomers to town, which has weakened local social networks and diminished participation in many traditional community practices. In addition, rising housing prices in the community have driven many young native Oiartzuners out of the local housing market at the same time that new subdivisions are being built for wealthier outsiders. Based on a quantitative analysis of variation in a corpus of local speech, and on community members' evaluations of Batua, local dialect, and their place in town life, I argue that the ambivalence of many community members toward changes in town life is reflected in their use of these varieties in speech. In particular, apparent time evidence presented here suggests that while some standard features are entering local speech, other emblematic features of local speech are not giving way to competing Batua forms. In the spirit of Labov's (1972) Martha's Vineyard study, it is argued that younger Oiartzuners' retention of emblematic local forms is a way of staking a claim to a local identity undercut by recent social and economic changes in the community.
The analysis presented here contributes to Basque sociolinguistics by providing a quantitative measure of the extent to which Batua features are diffusing into one Basque dialect. Indeed, the possibility that contact with Batua may lead to change in local dialects is of longstanding concern in Basque language planning efforts, and arises frequently in discussions of language in popular Basque media (Urla 1987, 1993; Zuazo 1988, 2003). In addition, this study contributes to the broader sociolinguistic literature on the linguistic consequences of shifting local identities in the context of rapid social and economic change including migration (Bailey et al. 1993, Labov 1972, Schilling-Estes 1998).
THE DEVELOPMENT OF A BASQUE STANDARD
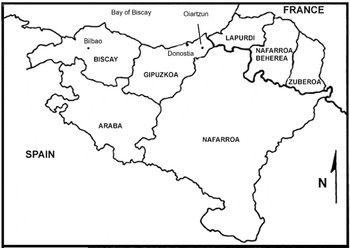
Basque is spoken by around 600,000 people in an area straddling the French–Spanish border, shown in Figure 1. These speakers make up about one-third of the population of the seven historically Basque provinces shown here (Basque Statistical Office 2001).

The Basque Country (adapted from Trask 1997).
Most native speakers of Basque today speak a regional variety as their first language and either Spanish or French as an L2 or additional L1. In addition, these speakers may have some proficiency the Basque standard, Batua, which has been gradually developed and promulgated since the 1960s.
The development of a literary standard had been a goal of Basque language planners since the birth of Euskaltzaindia (the Basque Language Academy) in 1918, which formed initially to stanch rapid language shift in many parts of the Basque Country. Euskaltzaindia's efforts to develop a standard were interrupted by the civil war (1936–1939) and oppression by the early Franquist dictatorship (1939–1975), but resumed in the late 1950s. In 1964, Euskaltzaindia published a standard orthography for a new standard Basque to be called Euskara Batua ‘Unified Basque’ (often shortened to Batua ‘Unified’), and since then, it has gradually set forth orthographic and grammatical norms for written language and “careful” speech. Today, Batua is used in most print publications, including a Basque-language daily newspaper, Berria. In addition, Batua is used on most of the region's Basque-language television and radio stations, including broadcasts by the Basque government's radio and television network, EITB, founded in 1982 (see also Urla 1995). It is also taught in all government-run Basque-medium schooling, and in the overwhelming majority of private Basque-medium schools.
As Batua has come to be used more frequently in public institutions and media over the past several decades, what it means to speak Batua has changed as well. In the late 1960s and 1970s, Batua was disseminated throughout the population through a massive grassroots effort. During these latter days of the Franquist dictatorship, Basque language instruction was still officially illegal; however, through a network of clandestine gau eskolak ‘night schools' and ikastolak ‘Basque-medium schools’, Batua was taught to native speakers wishing to develop literacy in Basque and to non-native speakers looking to learn Basque. As Urla 1987, 1993 describes in careful detail, these centers were self-consciously democratic efforts devoted not only to the dissemination of Batua, but also, in many cases, to Basque nation-building efforts and radical political causes. In recent years, however, the grassroots literacy and language teaching movement has weakened substantially, and Batua has gained a greater presence in public institutions. As much recent literature on speaker perceptions suggests, these social changes may well be related to speakers’ changing attitudes toward the standard: Increasingly, Batua is no longer a variety associated with radical politics and opposition, but rather is now a language of public institutions and upward mobility (Amorrortu 2000; Berri-Otxoa 2000; Echeverria 2000, 2003; Tejerina 1992; Urla 1987, 1993).
These recent changes in how and when Batua is used in Basque society have also had consequences for the meaning of speaking local Basque dialects. In particular, Urla 1995 and Echeverria 2000 present some preliminary evidence suggesting that, as Batua has come to be used in schools, mainstream media, and government, those varieties in opposition to which Batua has been constructed seem to be emerging as a way of marking opposition to meanings associated with these institutions. One example of this phenomenon comes from the slogan for a three-day “youth gathering” (gazte topagunea) that took place in 2004 in the Gipuzkoan town of Itsasondo, and which was promoted as an organizational summit among youth groups from the Basque political left (www.gaztetopagunea.com). Crucially, the slogan for the gathering – gu gera herria, egin dezagun bidea, ‘we are the people, let's build the way’ – features the Gipuzkoan dialectal auxiliary gera, rather than the Batua form gara. What is telling about the use of gera in this context is not only that it stands in opposition to the Batua form, but also that use of this opposition between Batua and dialect as a rhetorical device is available only to speakers who know both Batua and dialect, and the sociolinguistic distribution of these varieties; this set of speakers is overwhelmingly young. Hence, the use of dialect as an oppositional rhetorical strategy seems to index younger speakers, in whose name it is spoken. (The slogan is in the first person plural.) The possible emergence of dialect as a resource in oppositional discourse, then, is further evidence of the arrival of Batua as a standard. That is, the language of radical politics seems no longer to be Batua, but rather local dialects, in opposition to which Batua was initially developed.
In the remaining discussion, I will examine the way that Batua has entered the linguistic life of one Basque town, Oiartzun. As I hope to show, the way that local speakers talk about and use Batua is shaped by social and economic changes in Oiartzun brought on by economic development. Some of these changes are discussed in the following section.
WHAT'S WRONG WITH OIARTZUN? ECONOMIC, SOCIAL AND LINGUISTIC CHANGE SINCE 1975
Basque in Oiartzun
Oiartzun is a town of around 9000 inhabitants in a valley in the northeastern corner of Gipuzkoa, a ten-minute drive away from the provincial capital, Donostia (see Fig. 1). Linguistically, Oiartzun is comparable to other towns of its size in the central Basque Country in that it remains relatively heavily Basque-speaking, despite gradual language shift; 74% percent of Oiartzuners still reported Basque as a mother tongue in 1996 census data (Basque Statistical Office).
Today, most primary and secondary education students in Oiartzun attend Haurtzaro, the local ikastola, which was founded clandestinely in the latter years of dictatorship to teach children literacy in Basque. During the 1980s, Oiartzun's other school – a public school – also began offering Basque-medium instruction, and today the overwhelming majority of students in Oiartzun's two schools are enrolled in Basque-medium programs. The rest are enrolled in bilingual programs in which both Basque and Spanish are used as the medium of instruction; no students are enrolled in exclusively Spanish-medium programs (informant data; cf. Basque Statistical Office 1996).
Hence, except for the handful of young Oiartzuarrans who attend non-Basque-medium schools outside Oiartzun, all younger speakers have received considerable exposure to Batua through these two schools (and media). Moreover, because Batua has been introduced only in the past 30 years, local speakers' exposure to it varies by age. All but one of the younger speakers in the present study (20–30 years old) received Batua-medium primary and secondary instruction, but only one of the middle-aged and older speakers (over 40) did so. These social changes suggest the possibility that use of Batua as a classroom language will influence students' speech outside the classroom, and hence shape the development of the local dialect over time. Indeed, as I will discuss shortly, the possibility that Batua's use in the classroom shapes young people's non-classroom speech is part of popular local discourse about language.
Transportation and housing development since 1975
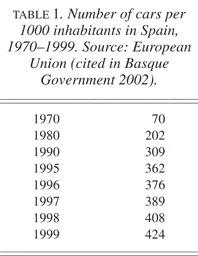
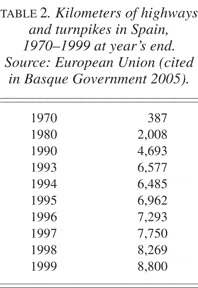
For Oiartzun and for many other small towns in Spain, one of the most important consequences of economic development since 1975 has been increased mobility: Today's Oiartzuners travel in and out of the valley much more easily than did previous generations. One factor behind this change has been a dramatic increase in car ownership. Table 1 shows that the number of cars per thousand inhabitants in Spain increased sixfold in the period from 1970 to 1999. During this period, new highway construction has also accelerated. Table 2 shows that the total number of kilometers of highways and turnpikes in Spain has increased dramatically during this period. One such highway, built in the early 1970s, cuts through the northern tip of Oiartzun and links the town with Donostia, Bilbao, and northern Basque cities including Miarritze (Biarritz) and Baiona (Bayonne).
Number of cars per 1000 inhabitants in Spain, 1970–1999. Source: European Union (cited in Basque Government 2002).

Kilometers of highways and turnpikes in Spain, 1970–1999 at year's end. Source: European Union (cited in Basque Government 2005).

One consequence of this change has been that today's Oiartzuners – especially the young – spend much more time outside their local neighborhoods and outside town than did previous generations. Moreover, many Oiartzuners, such as speaker 38 in (1) below, see these changes as weakening community ‘ties’ (loturak) or ‘relations’/‘interactions’ (hartu-emanak). That is, because Oiartzuners are now freer to leave the valley, they spend less time interacting with their neighbors than in previous years.

For space reasons, this quote and subsequent quotes from interview data are provided only in English and not in the original Basque. Interested readers may find transcripts in Basque in Haddican 2005. The process of speaker recruitment and interview procedure is discussed below. In the following data, unintelligible material is marked “xx.”
One specific way in which increased mobility seems to bear on participation in community life is in young people's destinations on weekend nights parranda botzeko, ‘for partying’. In particular, young people increasingly head to the provincial capital, Donostia, or, less often, to the nearby town of Hernani, rather than to one of the taverns in Oiartzun. Speaker 4 – a 20-year-old who is often among the Friday and Saturday night émigrés – blames cars for the exodus of young people on weekend nights, which she suggests has led to a diminishing of town life.

A second change that Oiartzuners often mention in discussing decreasing participation in local public life is the decline of neighborhood fiestas (jaiak). In the summertime, each of Oiartzun's eight neighborhoods has traditionally held a fiesta, often on and around the day of the neighborhood's patron saint. In recent years, however, participation in neighborhood fiestas has declined considerably, and in some years the fiestas have not been held at all. Some Oiartzuners, like Speaker 21 in (3), explain this change in terms of greater mobility.

An additional consequence of increased mobility has been a growth in housing construction in Oiartzun in recent years. Because transportation between Oiartzun and neighboring cities and towns – especially Donostia – is now easier than in recent years, commuting has become more attractive. This, in turn, has stimulated a demand for housing in Oiartzun – just ten minutes from Donostia by car – and in other nearby towns.
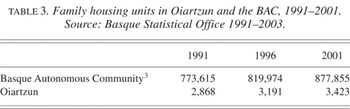
Table 3 shows growth in the number of family housing units in Oiartzun and in the Basque Autonomous Community (BAC) as a whole in the decade from 1991 to 2001. In particular, it shows that the number of family housing units in Oiartzun grew faster than in the BAC as a whole during this time, at 19% compared to 13%.
Family housing units in Oiartzun and the BAC, 1991–2001. Source: Basque Statistical Office 1991–2003.Under the current Spanish constitution, Araba, Biscay, and Gipuzkoa together form a political unit – the Basque Autonomous Community – juridically distinct from Navarre.

Many Oiartzuners are critical of the recent housing development for different kinds of reasons. Speaker 5, for example, laments this development for aesthetic reasons.

In addition, many community members worry that the influx of newcomers brought by this housing development might further weaken local social networks. Specifically, some Oiartzuners express worry that this immigration has led to a less dense community network, which, as Speaker 12, suggests, might erode local community identity.

Increased mobility, however, has also led to another kind of change in Oiartzun. In particular, rising housing prices triggered by this demand for housing in Oiartzun has priced many Oiartzuners – especially young people – out of the local market.4
No data on housing price increases in Oiartzun specifically are available at this time. In the province of Gipuzkoa as a whole, however, in the period from 1997 to 2001 the price per square meter for new housing rose 56%, from 1527 euros to 2376 (Basque Statistical Office). (During this same period average unadjusted personal income in Gipuzkoa rose only 30%–28% in Oiartzun.) These figures, then, show that the rise in housing prices is not unique to Oiartzun.
This discourse indexes the fact that many contemporary Oiartzun families have long histories in the valley. Indeed, Oiartzuners can often trace back their family lineage in the valley indefinitely, and many contemporary Oiartzuners' surnames are transparent valley toponyms.

Speaker 6's comments in this regard are similar. When asked if he wants to continue living in Oiartzun, Speaker 6 points out that he would like to, but cannot because of rising housing prices.

Although the euro had replaced the peseta by the time that fieldwork was conducted for this project, real estate prices were still frequently quoted and discussed in pesetas.
To review, increased mobility and housing development since 1975 have made Oiartzun a much less insular place than it was a generation ago, and many residents explicitly connect these changes with diminishing participation in certain traditional social practices and a perceived weakened sense of local identity. As I will argue in the following discussion, these social and economic changes are plausibly related to Oiartzuners' attitudes toward the local dialect and Batua.
Dialect loyalty in Oiartzun
In interview data collected in Oiartzun for this project, participants often observed that young people speak very differently from their elders. Many participants, moreover, explicitly attribute this change to contact with Batua through schools and media, as in (8), below. (Below, I present apparent time evidence that some Batua features are in fact making their way into local speech.)

Moreover, many such participants – especially, but not exclusively, younger speakers – lament this change. One middle-aged speaker, for example, reported that her teenage children and her brother do not let her speak in Batua but rather insist that she speak in the local dialect.

Similarly, in (10), when Speaker 12 is asked if she notices any differences in the speech of older speakers and younger speakers, she claims that her daughters are conscientious about “defending” the local dialect.

In 1996, the municipal government published Oiartungo Hizkera ‘The speech of Oiartzun’, a descriptive grammar of the local dialect by two linguists native to the area, Fraile and Fraile. The book is one in a series published annually by the town government during the local summer fiestas, focusing on various aspects of local history and culture. (Other books in the series include an anthology of local songs, a history of the town church, and a guide to flora and fauna in the valley.) Fraile & Fraile's book is notable in the context of the present discussion not only because it underscores the salience of the local dialect as a symbol of valley identity, but also in the importance that it attaches to dialect maintenance. In a summary, the authors emphasize the need to maintain the local dialect in the following way:
This work would not be complete without underlining the importance of maintaining the language of our people alive. Today, in the XXth century, dialects are dying and the different languages are becoming increasingly more uniform.
However, we do not realize that when we let the natural language of a place die we let the spontaneity of expressing in different areas, different registers die along with it and we even let an important part of our past, that is to say our language, die. (Fraile & Fraile 1996:246)
I would like to suggest that the rise in dialect loyalty in Oiartzun – the sense among many Oiartzuners that the local dialect needs to be “defended” from Batua – is partly a reaction to changes in town life discussed above, and in particular to a perceived weakening of community identity and participation in collective life. That is, Oiartzuners' nostalgia for traditional practices and more dense local social networks is plausibly manifested in what they say about language in Oiartzun (and, as I will argue below, in linguistic practice).
Indeed, to some degree the linguistic varieties involved in these processes of linguistic variation and change appear to be iconically linked to the social changes discussed above. In particular, Batua is associated with economic development as the language of public institutions and upward mobility (see Amorrortu 2000 and Echeverria 2000 for matched guise evidence to this effect), while local dialects are linked to an imagined traditional Basque world centered on Basque farmsteads (baserri) and agricultural production. (See Echeverria 2000, 2003 for an extensive discussion of representations of “authentic” Basqueness in pedagogical materials in Basque secondary schools.) An example of this construction of the local dialect appears in excerpt (11), in which Speakers IV and V are discussing the speech of Basque farmers (baserritarrak), whom Speaker V describes as “real Basques” (lit. ‘Basque-Basques’). (Neither speaker IV nor V nor their immediate families are baserritarrak.) Speakers IV and V describe the speech of baserritarrak speech as more “closed,” and contrast it with their own speech, which they describe as more Batua-like.

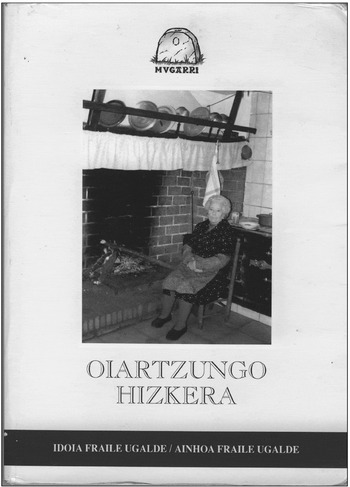
A vivid, similar representation of the local dialect comes from the photo on the cover of Fraile & Fraile's Oiartzungo Hizkera, shown in Figure 2. In this photo, Oiartzun Basque is personified by an elderly woman (named Maria), who indexes traditional life in Oiartzun in two ways: as an older speaker, and as a baserritarra ‘farmer’. The photo, moreover, locates Oiartzun Basque by the hearth of Maria's farmhouse, the focus of traditional life. As many Oiartzuners are also aware, Maria's house, where this photo was taken, is located in an eminently rural setting, in a remote mountainous part of the valley far away from the center of town.

Cover, Oiartzungo Hizkera.
These examples of representations of the local dialect in images and local discourse, then, are consistent with ethnographic work and work on speaker attitudes previously discussed, suggesting that one kind of meaning evoked by the dialect/Batua opposition is one of authenticity/tradition vs. development (Blommaert 1994, Kulick 1992). This evidence, however, does not, of course, demonstrate a causal connection between the social and economic changes in Oiartzun in recent decades and the way Oiartzuners talk about language and language change in the community; doing so will require more thorough ethnographic study. Rather, the foregoing discussion is intended to establish the plausibility of such a link. In the remaining discussion, I will further argue that such an analysis also suggests an account of certain patterns of language variation in change in Oiartzun.
METHODOLOGY
In an effort to gauge the extent to which Batua features may be entering local speech, and why, two kinds of data were gathered. First, to measure variation between standard and dialectal forms and the direction and speed of possible linguistic changes in progress, speech data were collected in sociolinguistic interviews (Labov 1972) with community members. I later transcribed these interviews and analyzed variation between Batua and dialectal forms across speakers using GOLDVARB 2001, a multivariate analysis application for PCs.7
The interviews were transcribed using standard Basque orthography, adjusted to reflect some relevant phonological variation.
Second, in order to study community members' language attitudes, participants were asked, as part of the interview, about their views on different aspects of language use in Oiartzun and other aspects of town life, including economic development. Much work has shown such ethnographic interviewing to be a valuable way to illuminate how attitudes toward language are related to other (nonlinguistic) social meanings in a given speech community (Briggs 1986, Hill 1998, Schieffelin 1990). Specifically, participants were asked about urbanization and decreasing participation in traditional local practices, including Mass and local fiestas. Participants were also asked about their views of Batua, the local dialect, and differences in speech between older and younger speakers.8
In addition, some of the ethnographic data presented here come from a second corpus of interviews with 12 community members who are native speakers of the local dialect. The interviews were conducted by me, in the local dialect (to the extent permitted by my competence in it), during a pilot study in July and August of 2001. Speakers from this corpus are identified using Roman numerals. The interview technique as well as the process of speaker recruitment is discussed in Haddican 2005.
The interviews were divided thematically into six parts (modules): (i) childhood in Oiartzun; (ii) changes in Oiartzun; (iii) school; (iv) work/future plans; (v) language; and (vi) biographical information. However, since the goal of the interview was to elicit maximally unself-conscious speech, the interviewer did not interrupt participants when they occasionally strayed from the interview topics to issues that held greater interest for them. Tokens (instances of use of one variant or another) to be used in quantitative analysis of variation were taken only from the first four modules. That is, because the interviews were intended to elicit maximally unself-conscious speech, tokens from modules that touched on language use – module 5 – were excluded from the data set. Tokens from the brief biographical module were also excluded, since these questions also typically disfavor unself-conscious speech.
In order to better elicit use of the vernacular during the interviews, I myself – a non-native speaker and a non-community member – did not conduct the interviews, and instead relied on four different local volunteers to conduct them. The interviewers were Maider, a 22-year-old recent BA graduate in Basque philology from the University of the Basque Country; Jabi, a 34-year-old BA graduate in Basque philology at the University of the Basque Country with some postgraduate training; Haizea, a 20-year-old undergraduate in Basque philology at the University of the Basque Country; and Iñaki, an older man who is known locally as an expert on town history. I was present during all of the interviews but generally did not participate during the first four modules of the interview, from which tokens were taken. In the fifth module – focusing on language in Oiartzun – I joined the discussion.
The interviews were conducted in Oiartzun from September 2003 through August 2004. They usually took place in the participants' home or an interviewer's home; however, in a few cases participants were interviewed in their place of work – a restaurant in one case and a corner store in another. The interviews were recorded using both a digital recorder and an analog cassette recorder, each with a lavalier microphone.
The interviews were conducted in the local dialect, the unmarked variety for informal speech among Basque speakers in Oiartzun. Nevertheless, the fact that three of the interviewers were young (18–34) suggests the likelihood of a greater presence of Batua features in the interviewers' speech than in that of older speakers. While no quantitative data are available at this time on Batua/dialect variation in the interviewers' speech, impressionistic evidence suggests that the interviewers' speech in the interviews was much like that of younger participants in key respects. In particular, the interviewers tended to use one local feature, /t/-palatalization, with aspectual morphemes very rarely. (As will be seen, use of /t/-palatalization in these environments is inversely related to age.) The fact, then, that Maider, Jabi, and Haizea are all young (18–34), with a discernible influence of Batua in their speech, may have encouraged the use of Batua forms among participants, especially among younger speakers who have learned Batua.
Participants were recruited through my network of acquaintances in Oiartzun, and through the social networks of the four interviewers for this project. Prospective participants were told that they would be recorded and that interview questions would focus on their experiences and life in Oiartzun. Participants were also told that the purpose of the project was to study the language in Oiartzun. Because many community members either knew me or knew of me from a previous pilot study in Oiartzun, it was neither practical nor appropriate to dissimulate this fact.
In all, 50 Oiartzuners who are native or near-native speakers of the local dialect were interviewed.9
Included in the present data set is one younger speaker who grew up speaking Basque not at home but rather in her Basque-medium school and with friends in her neighborhood.
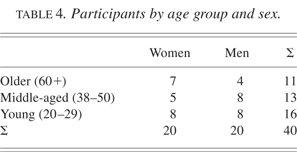
In recruiting participants, special attention was given to the participants' age and sex, which previous research has suggested are particularly likely to emerge as significant factors in conditioning variation (Fraile & Fraile 1996). Table 4 shows that a roughly even distribution of speakers across these two categories was achieved.
Participants by age group and sex.

Table 4 also shows that younger speakers are slightly better represented in the sample than middle-aged and older speakers. The purpose of this weighting was to gather as much data as possible from the set of speakers likely to be leading the spread of Batua features into the local dialect, namely younger speakers.10
An additional factor likely to bear on variation between Batua and local forms is education. For the set of participants used for this study, age is inversely related to educational level very closely: all of the 16 younger speakers completed secondary school, and 11 out of these 16 speakers attended college; among the 13 middle-aged speakers in the sample, only two had attended college, and 9 of these 13 attended school until age 17 or later; finally, among the 11 older speakers in the sample, none attended college and only 2 attended school until age 17. This overlap, then, obscures the question of change in progress, since it presents the possibility that intergenerational differences in use of Batua vs. dialectal features do not reflect a true generational difference but rather differences in educational level. To address this problem, separate multivariate analyses were performed with educational level – rather than age group – as a factor group. (Because of the close overlap between these two variables, they could not be included in the same analysis.) Across the variables to be examined here (except for variation in naz vs. naiz use, for which multivariate analysis could not be performed), models with age group provide a better fit for the data – that is, better help explain variation between Batua and local forms – than does educational level. These data, then, suggest that the variation between Batua and local forms is indeed conditioned significantly by speaker age. For space reasons, the details of these runs are not provided here, but may be found in Haddican 2005.
Finally, it bears noting that two aspects of the process of speaker recruitment may have favored the inclusion of participants with strong allegiance to the local dialect. First, because participants knew the nature of this project, Oiartzuners with strong feelings toward the local dialect may have been especially inclined to participate. Second, because only native or near-native speakers are included in this project, these data do not reflect the attitudes and performance of non-native speakers of the local dialect, who may have less allegiance to it. These considerations suggest that the data presented here may not be representative of the full range of local language attitudes.
RESULTS
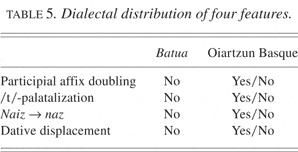
This article presents data on the four variable features of local speech shown in Table 5. These features are all variably present in the local dialect but proscribed in Batua. The following sections present data on each of these features, in turn.
Dialectal distribution of four features.

Participial affix doubling
Main verbs in Basque may bear one of four participial markers. For a closed class of verbs this marker is standardly -n. This class includes iza-n ‘have, be’, Aux, and ego-n ‘be-loc’, as shown in (12). However, in Oiartzun and a handful of neighboring towns, this participial affix appears to double in certain environments. Specifically, the open class affix -tu may affix to the verb+n/-i on certain state and activity verbs, including iza-n ‘be/have’, ego-n (loc. cop), and bizi ‘live’, as in (13).11
In other neighboring dialects this class also includes jakin ‘know’ and ibili ‘walk’.

In this example and in others to follow, the /t/ of -tu assimilates in voicing to the preceding nasal. This phenomenon is presumably orthogonal to the claims made here.
Doubling is also available on izan as a non-finite auxiliary, as shown in (14).13
Participial affixes occur in several different environments. On main verb complements of finite auxiliaries as in (12)–(14), these affixes necessarily co-occur with a perfective interpretation as reflected in the glosses. In addition, however, these affixes occur in several other kinds of environments, in which they do not necessarily co-occur with a perfective interpretation, such as future constructions, on verbal complements of modals, in imperatives, and as complements of prepositions including nahiz (eta) ‘despite’. In this latter set of environments, doubling is unattested in the present data set. (See Haddican 2005 for a formal account of this difference.) Non-doubling tokens in this latter set of environments have therefore been excluded from the analysis.

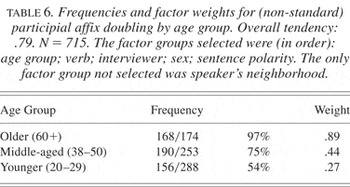
Table 6 shows frequencies and factor weights for participial affix doubling by age group. These factor groups together form a model of factors conditioning participial affix doubling. The factor group “weights” (in the far right column) reflect the degree to which individual factors favor a variant of the dependent variable – in this case, participial affix doubling. Factor weights range from 0 to 1. A value greater than .50 favors the variant, and a value below .50 disfavors it; a value of .50 is neutral, neither favoring nor disfavoring the chosen variant. The overall tendency reflects the global probability of occurrence of participial affix doubling.
Frequencies and factor weights for (non-standard) participial affix doubling by age group. Overall tendency: .79. N = 715. The factor groups selected were (in order): age group; verb; interviewer; sex; sentence polarity. The only factor group not selected was speaker's neighborhood.

The age-group data in Table 6 suggest straightforward support for the hypothesis of change in progress: Older speakers favor nonstandard forms (.89), followed by middle-aged speakers (.44) and finally younger speakers, who strongly favor standard forms (.27). From the perspective of the discussion of the introduction of Batua above, however, it is surprising that middle-aged speakers' weights for doubling are so much lower than those of older speakers. (Indeed, the difference in factor weights between middle-aged and older speakers, .45, is greater than that between middle-aged and younger speakers, .17.) Recall that Basque-medium broadcast media and broad Basque-medium schooling (in Batua) began in earnest only in the 1980s. Among participants in this study, all but one of the middle-aged speakers received exclusively Spanish-medium schooling and were young adults by the time that the Basque government's Basque-medium TV and radio network was created in 1982.14
This speaker attended the local ikastola in its clandestine early years, at a time when Basque-medium education was still prohibited. In a separate run with this speaker's tokens removed, the same factor groups were selected, and the ordering of constraints was unchanged.
/t/-palatalization
Many Basque dialects have a palatalization rule targeting one or more of the coronal segments /n, l, t, d/. There is significant cross-dialectal variation in both the kind of environments conditioning palatalization and in the set of segments targeted by the rule, although there seems to be a general preference for the sonorants /n/ and /l/ as targets (Hualde 1991).
In Oiartzun, /n, l, t/ all variably palatalize following high front vowels and glides. Nevertheless, because palatalization of /n/ and /l/, unlike /t/-palatalization, is commonplace in Batua, even in formal contexts such as newscasts, variation in palatalization of /n/ and /l/ is unenlightening for the present research questions focusing on whether, how, and why standard features are entering local speech. This study therefore focuses only on palatalization of /t/, as formalized in (15).

In addition, /t/-palatalization is constrained both morphologically and phonologically; significant variation is limited to palatalization in onset position in monomorphemes, and across certain morpheme boundaries, namely with absolutive plural markers, and with the aspectual markers -tu and -ten. This study, then, considers palatalization of /t/ in only these environments.
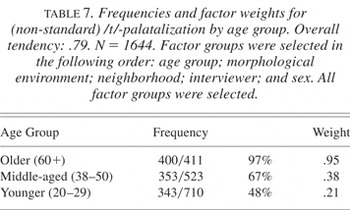
Table 7 shows frequencies and factor weights for /t/-palatalization by age group. The data in Table 7 are similar to those for participial affix doubling in Table 6: Older speakers strongly favor the nonstandard local form (.95), followed by middle-aged speakers (.38), and finally younger speakers (.21). These data, then, support the hypothesis of change in progress toward the standard. Nevertheless, the behavior of middle-aged speakers shown in Table 7 is again unexpected in view of the discussion of the development of Batua. As in the case of participial affix doubling (Table 6), middle-aged speakers' factor weight for /t/-palatalization is much lower than the oldest age group's weight. (In both cases this difference is significant. That is, in runs with only older and middle-aged speakers, age is selected as a significant factor group.) Again, these data are surprising because middle-aged speakers, by and large, have not grown up with extensive exposure to Batua in the educational system and media, and many were adults by the time that the promulgation of Batua began in earnest.15
As discussed above, one 40-year-old speaker in the middle-aged group attended Basque-medium school. When this speaker's tokens are excluded, the results are still significant.
Frequencies and factor weights for (non-standard) /t/-palatalization by age group. Overall tendency: .79. N = 1644. Factor groups were selected in the following order: age group; morphological environment; neighborhood; interviewer; and sex. All factor groups were selected.

naz vs. naiz
In Oiartzun Basque, the diphthongs

and

may monophthongize in closed syllables on auxiliary verbs as illustrated in (16). In Batua, these monophthongal forms are proscribed.

In the present corpus, the most frequent environment for this alternation is in the 1 sg. present tense form of the intransitive indicative auxiliary,

(〈naiz〉)∼ [nas] (〈naz〉), as in (17) and (18). Other environments occurred too infrequently to be usefully included in the data set.

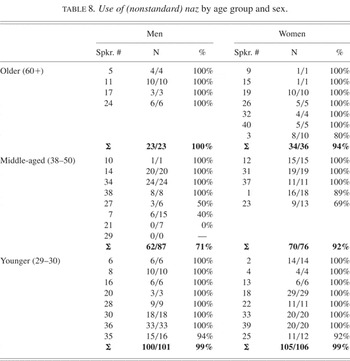
Table 8 presents frequencies of naz use (vs. naiz) by age group and sex. Because use of naz is nearly categorical in this sample, multivariate analysis was not performed with these data. Unlike the data in Table 6 and Table 7, these data suggest little support for the hypothesis of change in progress. In all six age/sex groups, most speakers use (nonstandard) naz categorically. A slightly greater proportion of older speakers use naz categorically than do middle-aged speakers; however, younger speakers in this sample use naz categorically in roughly the same proportion as the oldest age group. As a group, then, middle-aged speakers in fact show lower rates of naz use than younger speakers. Later I will return to the question of why naz does not appear to be giving way to a competing Batua variant, unlike the case of /t/-palatalization and participial affix doubling.16
Notably, the three middle-aged speakers with lowest rates of naz use – 23, 21, and 7 – also show the lowest rates of palatalization. Among younger speakers, however, no such correlation exists: Those younger speakers with low rates of palatalization do not also have low rates of naz use. The difference between younger speakers and middle-aged speakers with regard to these variables is taken up in the second half of this article.
Use of (nonstandard) naz by age group and sex.

Dative displacement
Basque auxiliary verbs agree in person and number with absolutive, ergative, and dative arguments. In addition, Oiartzun Basque, but not Batua, has a phenomenon termed “dative displacement” by Fernández 2004, in which dative arguments are (variably) marked on the auxiliary with an absolutive agreement morpheme.17
This is reminiscent of loismo in some Spanish dialects.

Dative displacement is also available in dative subject constructions, as shown in (21) and (22):

In Oiartzun Basque, this process is subject to two main constraints: (i) It is restricted to present tense auxiliaries; and (ii) only 1sg, 2sg and 2pl agreement morphemes undergo displacement (Fraile & Fraile 1996). Tokens in these environments were then included in the data set for multivariate analysis.
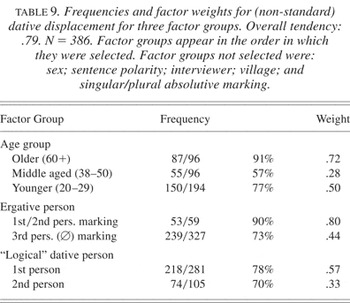
Table 9 presents significant factor groups favoring dative displacement. The age-group data in Table 9 are very different from those seen in the case of palatalization and participial affix doubling: Older speakers favor (nonstandard) displacement (.72), followed by younger speakers (.50) and finally middle-aged speakers, who strongly favor standard forms. That is, the younger speakers and middle-aged speakers have switched places vis-à-vis the data on participial affix doubling (Table 6) and /t/-palatalization (Table 7). These data are reminiscent of the data on naz vs. naiz, for which middle-aged speakers, again, showed lower rates of use of nonstandard forms than younger speakers did. This age-group difference between dative displacement and naz on one hand and /t/-palatalization and participial affix doubling on the other is discussed in detail in the section on /t/-palatalization.
Frequencies and factor weights for (non-standard) dative displacement for three factor groups. Overall tendency: .79. N = 386. Factor groups appear in the order in which they were selected. Factor groups not selected were: sex; sentence polarity; interviewer; village; and singular/plural absolutive marking.

Table 9 shows that two internal factors also constrain dative displacement. In particular, first person agreement morphemes participate in displacement more readily than second person morphemes do. These different environments are illustrated in (23) and (24) below. (Again, only 1 sg., 2 sg., and 2 pl. agreement morphemes participate in displacement.)

A second factor that bears significantly on displacement is ergative person marking. Auxiliaries with first and second person ergative person marking favor dative displacement (.80), while auxiliaries with (null) third person agreement, or without ergative arguments at all (dative subject constructions), disfavor it (.44). Example (26) shows such a favoring environment: a double object construction, in which the ergative argument is marked with a second person agreement morpheme.

By contrast, disfavoring environments are those illustrated below, in which either the ergative agreement morpheme is null (26), or in which there is no ergative argument (27).

The generalization, then, seems to be that overt person markers favor displacement, while absence of overt marking disfavors displacement. An account of these differences is proposed below.
DISCUSSION
The apparent time data presented here raise several questions. In particular, what motivates change in the case of variables for which evidence of change in progress exists, namely /t/-palatalization and participial affix doubling? Moreover, what explains why some of these features show evidence of change in progress, but not others? Again, the data on /t/-palatalization and participial affix doubling suggest straightforward evidence of change in progress, since, for these variables, younger speakers show higher rates of innovative Batua forms than do their elders. By contrast, the data on dative displacement and naz do not suggest that younger speakers are adopting Batua forms; indeed, in both cases, younger speakers show lower rates of innovative standard forms than do middle-aged speakers.
In the case of /t/-palatalization and participial affix doubling, this change is plausibly driven in large part by prescriptive brute force – that is, by standard language ideology, especially through Basque-medium schooling (cf. Milroy & Milroy 1990). In particular, many Oiartzuners (of all age groups) see Batua as in some sense objectively more correct than the local dialect. One kind of evidence to this effect is that several middle-aged and older town members complained during the interviews that their Batua-educated children and grandchildren “correct” their dialectal forms. In addition, as discussed earlier, Batua is also associated with modern, urban life and seen as a variety for young people, in opposition to dialects, which are associated with older speakers, rural settings, and an imagined Basque traditional world. In view of these two kinds of ideological pressures, then, it seems unsurprising that Batua features should be making their way into young people's speech (and even into middle-aged Oiartzuners' speech).
What, then, explains the fact that naz and dative-displacement show no signs of giving way to competing Batua forms in the speech of the youngest age group? The difference between these two sets of variables is plausibly related in part to the fact that naz and dative displacement – unlike /t/-palatalization and participial affix doubling – are emblematic features of local speech. That is, in the interviews conducted for this project, when participants talk about how Oiartzuners talk, these are some of the features that they are most likely to mention. By contrast, participants rarely mention /t/-palatalization and participial affix doubling at all.
Some examples of the way that naz and dative displacement are emblematic of the local dialect in local metalinguistic discourse are given in the following excerpts. Excerpt (28) comes from a portion of interview in which Speaker 3 and the interviewer are discussing aspects of local speech. When Speaker 3 notices the interviewer using dative displacement in her speech, she interrupts to point out, “That's from Oiartzun.”

Similarly, in (29), Speaker 4 describes communication between herself and two former college roommates from other Basque towns, and reports that what most struck these non-Oiartzuners was her use of naz and the dative displaced form, nau. When I ask her what she would think if she heard someone say (standard) naiz, she replies that she would think the speaker is not speaking the local dialect or is not from Oiartzun.

In view of the foregoing discussion of dialect loyalty, a plausible explanation of the difference between these two sets of variables is that younger speakers are hanging onto naz and dative displacement because these features are stereotypical of local speech. By contrast, /t/-palatalization and participial affix doubling are not emblematic of local speech and are undergoing change.
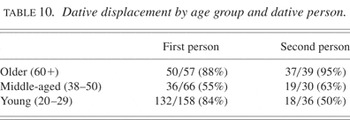
The emblematic status of the form nau may also help explain differences in the way that dative person bears on dative displacement. Recall from Table 9 that 1 sg. agreement morphemes favor displacement (.57) while second person agreement morphemes disfavor it (.33). This difference is plausibly attributable to the fact that the emblematic form of this phenomenon is invariably nau, an auxiliary whose displaced agreement morpheme is first person rather than second person. This explanation, moreover, would seem to predict that the difference between first and second person displaced forms will be greatest among the group of speakers for whom dialect loyalty seems to bear most directly on usage – younger speakers. Indeed, the following cross-tabulation bears this out. Table 10 shows that older and middle-aged speakers actually have slightly higher rates of displacement for second person forms. For younger speakers, however, the opposite pattern emerges: The frequency of displaced forms for first person agreement morphemes is much higher than for second person agreement morphemes.
Dative displacement by age group and dative person.

This proposal – that the auxiliary nau's status as an emblem of dative displacement and local speech has shaped environmental conditioning in this process of change – nevertheless seems to be counterexemplified by the ergative person data in Table 9. Table 9 shows that displacement is disfavored in environments with (null) third person ergative agreement morphemes, and without ergative arguments (.44), and favored in forms with first and second person marking (.80). The emblematic form nau occurs in the first two of these environments, as illustrated in (26) and (27), repeated below, and not in the latter environments, as shown in (25), repeated below. The emblematic form, nau, then, corresponds to precisely those ergative persons that disfavor displacement.

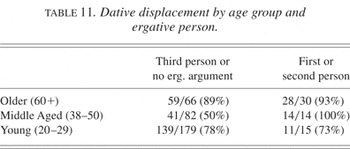
On closer inspection, however, the ergative person data turn out not to be entirely unlike the pattern for dative person. The cross-tabulation in Table 11 shows that the way ergative person constrains displacement varies by age group. Middle-aged and older speakers have higher frequencies of displacement for first or second person forms than for third person ergative/dative subject forms, while for younger speakers the reverse is true: The rate of displacement is slightly higher for third person ergative and dative subject constructions (78%) than for first person or second person ergative person forms (73%). Hence, again, among the group of speakers for whom dialect loyalty appears to bear most directly on language change, environments conditioning the emblematic form nau are (weakly) favorable for dative displacement.
Dative displacement by age group and ergative person.

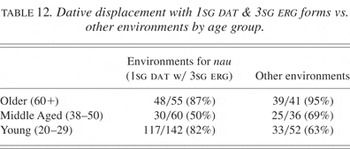
Table 12 combines these two factors – “logical” dative person and ergative person – in order to compare dative displacement in environments in which nau is possible vs. those where it is not possible. Table 12 shows that younger speakers exhibit dative displacement at higher rates than middle-aged speakers only in 1sg dat/3sg erg environments (i.e., those in which dative displacement yields nau). In other environments, younger speakers use dative displacement at roughly the same rate as do middle-aged speakers (69% vs. 63% respectively). These facts, then, suggest that younger speakers' increased rates of dative displacement vis-à-vis middle-aged speakers in Table 12 are attributable to the emblematic status of nau in the community.
Dative displacement with 1sg dat & 3sg erg forms vs. other environments by age group.

This account of nau, if correct, entails that the emblematic nature of certain forms may bear on language change not only by motivating change (or absence of change) among certain salient sociolinguistic variables, but also in determining what environments will be in the vanguard of linguistic change. That is, variationists have long known that socially salient variables often behave differently from less salient variables in terms of style shifting and rates of change (Labov 2001:196). The above data, however, suggest that such emblematic forms and shibboleths may also bear on language change at the level of constraint hierarchies (Labov 1969, Tagliamonte 2002).
It remains to be explained why, in the case of these emblematic features, younger speakers tend toward the local variant more than do middle-aged speakers. That is, in the case of naz and dative displacement, younger speakers actually show higher rates of local variants than do middle-aged speakers. I would like to suggest that this difference is related to the unique way that economic development and social change have borne on young Oiartzuners' lives and sense of identity as Oiartzuners. Most important, today's young Oiartzuners, unlike older generations, face the prospect of being forced out of town by rising housing prices at the same time that new subdivisions are being built for wealthy outsiders. One possible interpretation, then, of the linguistic behavior of the younger speakers in this sample, and of local discourses on the loss of dialectal features, is as a reaction to these changes. That is, younger speakers' dialect loyalty is a way of staking claim to an Oiartzuner identity undercut by recent social and economic changes in the community. In small Basque towns like Oiartzun, local dialects are often linked with traditional Basque practices and meanings, for which many community members are frankly nostalgic. In using emblematic dialectal features, then, younger speakers might plausibly be viewed as making use of a powerful resource for staking a claim as heirs to this tradition – as those to whom Oiartzun ought to belong.
From this perspective, the variation data for emblematic local features in this sample are reminiscent of patterns of diphthong centralization among residents of Martha's Vineyard in the wake of tourist development there (Blake & Josey 2003, Labov 1972). Specifically, Labov 1972 proposes that Vineyarders' increased centralization of the nuclei in /aw/ and /ay/ – a feature of Vineyard speech – is a reaction to the encroachment of “summer people,” wealthier mainlanders who have bought property on the Vineyard for summer residences. In Labov's locus classicus, “When a man says [rAIt] or [hAUs], he is unconsciously establishing the fact that he belongs to the island: that he is one of the natives to whom the island really belongs” (1972:36). Crucially, in Labov's (1972) study, as in the present Oiartzun data, dialect loyalty – as manifested both by linguistic practice and what speakers say about language in the community – is strongest among the set of community members whose sense of belonging to the community has been most directly affected by social change.
Nevertheless, as Jaqueline Urla observes (p.c.), these patterns of variation are also likely to reflect another kind of social change absent in the Martha's Vineyard case. In particular, the intergenerational difference may also be related to the changing sociolinguistic distribution of Batua and its shifting meaning over the past 30 years. The middle-aged speakers in this study (aged 38–50) would have been in their teens and early twenties in the late 1970s and early 1980s when Batua, in its early life, was the language of grassroots Basque language-maintenance efforts and radical politics (Urla 1987, 1993). By contrast, the Batua that the young people in the present sample have grown up with is an institutional variety: the language of schools, media, public institutions and the labor market. (The older speakers in this study were all middle-aged by the fall of the dictatorship, and the language might be expected not to have influenced the vernacular of these speakers to the same extent as today's middle-aged speakers.) The changing meaning of speaking Batua over the past generation, then, might further explain why younger speakers – to a greater extent than middle-aged speakers – are more likely to make use of the dialect/standard opposition as a linguistic resource for expressing discontent with development and housing speculation. Future work might usefully explore this possibility.18
As noted above, Urla 1995 and Echeverria 2000, 2003 both discuss the use of “vernacular” Basque in oppositional discourse among Basque youth. These studies describe the use of a T/V pronoun distinction (hika vs. zuka) as a resource in oppositional discourse but do not provide any evidence that the dialect/Batua opposition per se fulfills a similar rhetorical role.
This account of language variation and change in Oiartzun contributes to a growing body of work on the often unique behavior of emblematic local features in processes of diffusion, particularly in speech communities undergoing rapid social and economic change. In particular, several studies, beginning with Labov's Martha's Vineyard work, have shown that speakers may conserve stereotypical local features in processes of social and linguistic change as a symbolic resource for legitimizing a local identity. Bailey et al. 1993, for example, suggest that the persistence and spread of fixin to in Oklahoma cities is a reaction to immigration of Northerners and the perceived threat they represent to “traditional” local culture. Similarly, Schilling-Estes 1998 describes how speakers of Ocracoke English – a moribund dialect of the Outer Banks Islands in the United States – may retain an emblematic raised nucleus for /ay/ in performing the local “brogue” for tourists and outsiders. Most recently, Johnstone et al. 2002 argue that the persistence of monophthongization of /aw/ in Pittsburgh (U.S.) English may be partly attributable to the salience of this feature in popular representations of local speech.
In the foregoing discussion, I have argued that such an account may help explain patterns of diffusion across four variables in Oiartzun Basque. In addition, I have provided a preliminary characterization of the way that this change may be mediated by local ideologies of tradition and authenticity (cf. Irvine & Gal 2000:47). This discussion, however, is intended to be exploratory. The data presented here do not suffice to establish a causal relationship between recent social and economic changes in Oiartzun and patterns of variation in linguistic practice in Oiartzun; rather, again, this discussion is intended to establish the plausibility of such an account. Much more detailed ethnographic work is needed in small Basque communities like Oiartzun to understand the way these social changes may be shaping change in Basque dialects. It is hoped that this article may provide a point of departure for such further study.