
Introduction
Photoelectrochemical (PEC) water splitting is noticeably one of the superior methods for a clean and sustainable production of energy. The use of solar energy in the production of hydrogen from water is one of the promising alternatives that could potentially provide a clean and cost-effective solution to fossil fuels.[Reference Chen, Dinh and Miller1, Reference Qi, Zuo, Wang and Chan2] Solar water splitting is based on immersing a semiconducting electrode into an electrolyte and harvest sunlight to break down water into its constituents for converting solar energy into chemical energy. Prerequisites for an efficient water splitting system include that the photoanode material should be able to generate a voltage higher or equivalent to the water splitting potential (1.23 V) and its band gap should allow absorption of a broad range of the solar spectrum, as well as the band edges must be compatible with hydrogen and oxygen redox potentials.[Reference Chen, Dinh and Miller1] Moreover, long-term stability against photocorrosion, long carrier diffusion lengths, and efficient charge transport are key criteria for efficient photoelectrocatalysts.
In the context of large surface area materials, electrospinning is a cost-effective net-shaping methodology that allows the fabrication of nanofiber-based photoelectrodes with large surface areas and porosity.[Reference Kumar, Sundaramurthy, Sundarrajan, Babu, Singh, Allakhverdiev and Ramakrishna3] Electrospinning has been employed to fabricate a wide range of oxide materials, such as TiO2, Fe2O3, CuO, NiO, BiFeO3, LaFeO3, LaNiO3, and BaTiO3, used in photocatalysis, water splitting, magnetism, multiferroics, piezoelectricity, supercapacitors, and gas sensing applications.[Reference Wang, Li, Chi, Li, Yan, Li and Shao4–Reference Kim, Honda, Kim and Kim8] TiO2 is one of the most investigated materials for water splitting due to its very high photocatalytic efficiency, non-toxicity, and stability.[Reference Chen and Mao9] Nevertheless, its large band gap (3.2 eV) only allows the absorption in the UV range that restricts the overall PEC efficiency. Thus, alternative transition oxide materials have been investigated in order to achieve visible-light-driven water splitting. Particularly, bismuth ferrite (BiFeO3 or BFO) has been recently investigated as a promising candidate for this purpose. BFO is a well-known p-type semiconducting and multiferroic material with a perovskite structure that has been investigated for a broad range of applications such as magnetism, electronics, and optics.[Reference Coll, Gazquez, Fina, Khayat, Quindeau, Alexe, Varela, Trolier-McKinstry, Obradors and Puig10–Reference Yang, Seidel, Kim, Rossen, Yu, Gajek, Chu, Martin, Holcomb, He, Maksymovych, Balke, Kalinin, Baddorf, Basu, Scullin and Ramesh12] Interestingly, BFO is non-toxic, very stable, and it has a band gap of about 2.2 eV which is ideal for applications in the visible range of the solar spectrum.[Reference Li, Lin, Zhang, Wang and Nan13, Reference Rong, Chu, Tang, Zhang, Cui, He, Zhang and Xiao14] Hematite (α-Fe2O3) has also driven much attention for its potential use as photoelectrode for water splitting since it can also absorb a wide range of the visible solar spectrum by virtue of its band gap (E g~2.1 eV). In addition, it is chemically stable in water, nontoxic, and earth-abundant.[Reference Du, Yang, Mayer, Hoyt, Xie, McMahon, Bischoping and Wang15, Reference Qiu, Leung, Zhang, Hua, Lin, Wei, Tsui, Zhang, Yang and Fan16]
In this paper, we have investigated the photocurrent response of photoelectrodes prepared from p-type BFO nanofibers at different temperatures. In addition, we integrated these nanofibers into n-type hematite films. The photocurrent response of variable amounts of BFO nanofibers/α-Fe2O3 nanocomposite films is evaluated for the fabrication of photoelectrodes for overall water splitting.
Materials and methods
Synthesis of BiFeO3 nanofibers
BiFeO3 nanofibers were synthesized by electrospinning. The precursor solution with a 0.2 M concentration was prepared by the following procedure. In a typical synthesis, Bi(NO3)3·5H2O, and Fe(NO3)3·9H2O precursor salts (Sigma Aldrich) were dissolved in acetic acid, and polyvinylpyrrolidone (PVP, M w = 1,300,000 g/mol, Sigma Aldrich), in a proportion of 0.075 g/mL, was slowly added to the previous solution while continuously stirring the reaction mixture to obtain a viscous solution. The electrospinning process was done by loading the precursor solution into a plastic syringe, feeding it to a stainless-steel needle with a micro-infusion pump at a rate of 10 µL/min. A high voltage of 10–15 kV was supplied with a power supply in order to establish an electric field (1–1.5 kV/cm) between the needle and the collector, kept 10 cm apart. The collected as-spun nanofibers were then calcined at 500–600 °C for 5 h at a heating rate of 1 °C/min. Typically, slow heating rates are employed during the calcination process that leads to the formation of oxide nanofibers to achieve a homogeneous decomposition of the polymer, preventing them from collapsing or breaking into shorter nanowires.[Reference Jiang, Fan, Zhang, Bai, Liu, Huang, Mao, Yuan, Liu and Shi17]
Preparation of α-Fe2O3/BFO nanofiber composite electrodes
The precursor solution for synthesizing hematite was prepared from Fe(NO3)3·9H2O (Sigma Aldrich) which was dissolved in ethanol and stirred a transparent solution was obtained. The solution concentration was adjusted at 0.2 M after optimization of the PEC response of α-Fe2O3 films (Fig. S1). Different amounts of BFO nanofibers (5, 10, and 25 wt%) were dispersed in the α-Fe2O3 precursor solution. The α-Fe2O3, BFO nanofibers, and α-Fe2O3/BFO nanofibers composite films were prepared by spin-coating at 1200 rpm for 30 s on fluorine-doped SnO2 (FTO) substrates. The films were then dried at 200 °C for 10 min and annealed at 700 °C for 4 h in air. Prior to that, the FTO substrates were cleaned separately in a Hellmax soap/water solution, deionized water, acetone and ethanol, and they were dried in a hot air flow.
Characterization
Thermogravimetry (TG) analysis of the as-spun nanofibers was done on a TGA/DSC1-STAR system (METTLER-TOLEDO GmbH) with a GC 100 gas controller. The samples were placed in a 70 µL aluminum oxide pan and the measurements were conducted under a 25-mL air flow in the temperature range 40–1100 °C with a heating rate of 10 °C/min. The crystalline phase of the nanofibers was determined by x-ray diffraction (XRD) patterns recorded on a STOE STADI MP diffractometer equipped with a Mo source (λ = 0.7107 Å). The morphological characterization of the samples was performed by scanning electron microscopy (SEM) using a QUANTA FEI 200 FEG-ESEM and atomic force microscopy (AFM) using a Park Systems XE-100 AFM working in contact mode. The PEC response of the samples was investigated in a quartz cell. The samples were set as the working photoelectrode, saturated calomel as the reference electrode. The Pt counter electrode was coupled to a potentiostat (VersaSTAT 4, AMETEK Scientific Instruments), and a 150 W Xenon arc lamp (Oriel Instruments) equipped with a 1.5 AM filter was used as a light source. The measurements were done at room temperature and using a 1 M NaOH solution as the electrolyte.
Results and discussion
Self-standing BFO nanofibers and their PEC water splitting behavior
The thermal analysis in air of the as-spun Fe-Bi/PVP nanofibers (Fig. S2) showed that there is an initial weight loss, Δm1, of about 10–15% below 260 °C, which indicated the evaporation of the acetic acid and any absorbed water. A pronounced weight loss, Δm2, of ~35% observed between 260 and 340 °C is possibly due to the decomposition of nitrates at ~290 °C and the partial decomposition of the polymer.[Reference Yuvaraj, Fan-Yuan, Tsong-Huei and Chuin-Tih18, Reference Loría-Bastarrachea, Herrera-Kao, Cauich-Rodríguez, Cervantes-Uc, Vázquez-Torres and Ávila-Ortega19] The remaining organic material present in the fiber mats is completely decomposed above 410 °C (Δm 3~3%) to produce a solid of definite composition. The total weight loss of the whole decomposition process is about 53% of the initial mass.
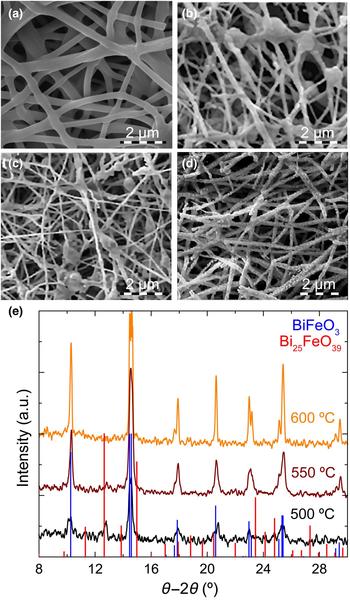
The surface morphology of as-spun nanofibers evaluated by SEM [Fig. 1(a)] showed continuous fiber mats. The PVP/Bi–Fe nanofibers are cylindrical in shape and have quite a uniform diameter over its length. The diameters were about 400 ± 120 nm and the length could be adjusted in the micro- to millimeter range. The surface morphology of the nanofibers after calcination at 500, 550 and 600 °C [Figs. 1(b)–1(d)] showed average nanofiber diameters of 160 ± 75 nm. The observed shrinkage, when compared with as-spun nanofibers is mainly attributed to the removal of PVP. Nanofibers became slightly brittle after the polymer elimination and exhibited a granular and rough surface composed of small BFO crystallites of different orientations.[Reference Wang, Li, Chi, Li, Yan, Li and Shao4] The fibers calcined at 500 and 550 °C [Figs. 1(b) and 1(c)] showed some beads and the surface was less granular than fibers calcined at 600 °C [Fig. 1(d)]. This could be due to residual polymer present at lower calcination temperatures.
SEM images of the (a) as-spun and BFO nanofibers calcined at (b) 500, (c) 550, and (d) 600 °C for 4 h with a heating ramp of 1 °C/min. (e) Indexed XRD patterns of BFO nanofibers annealed at 500, 550, and 600 °C for 4 h with a heating ramp of 1 °C/min.

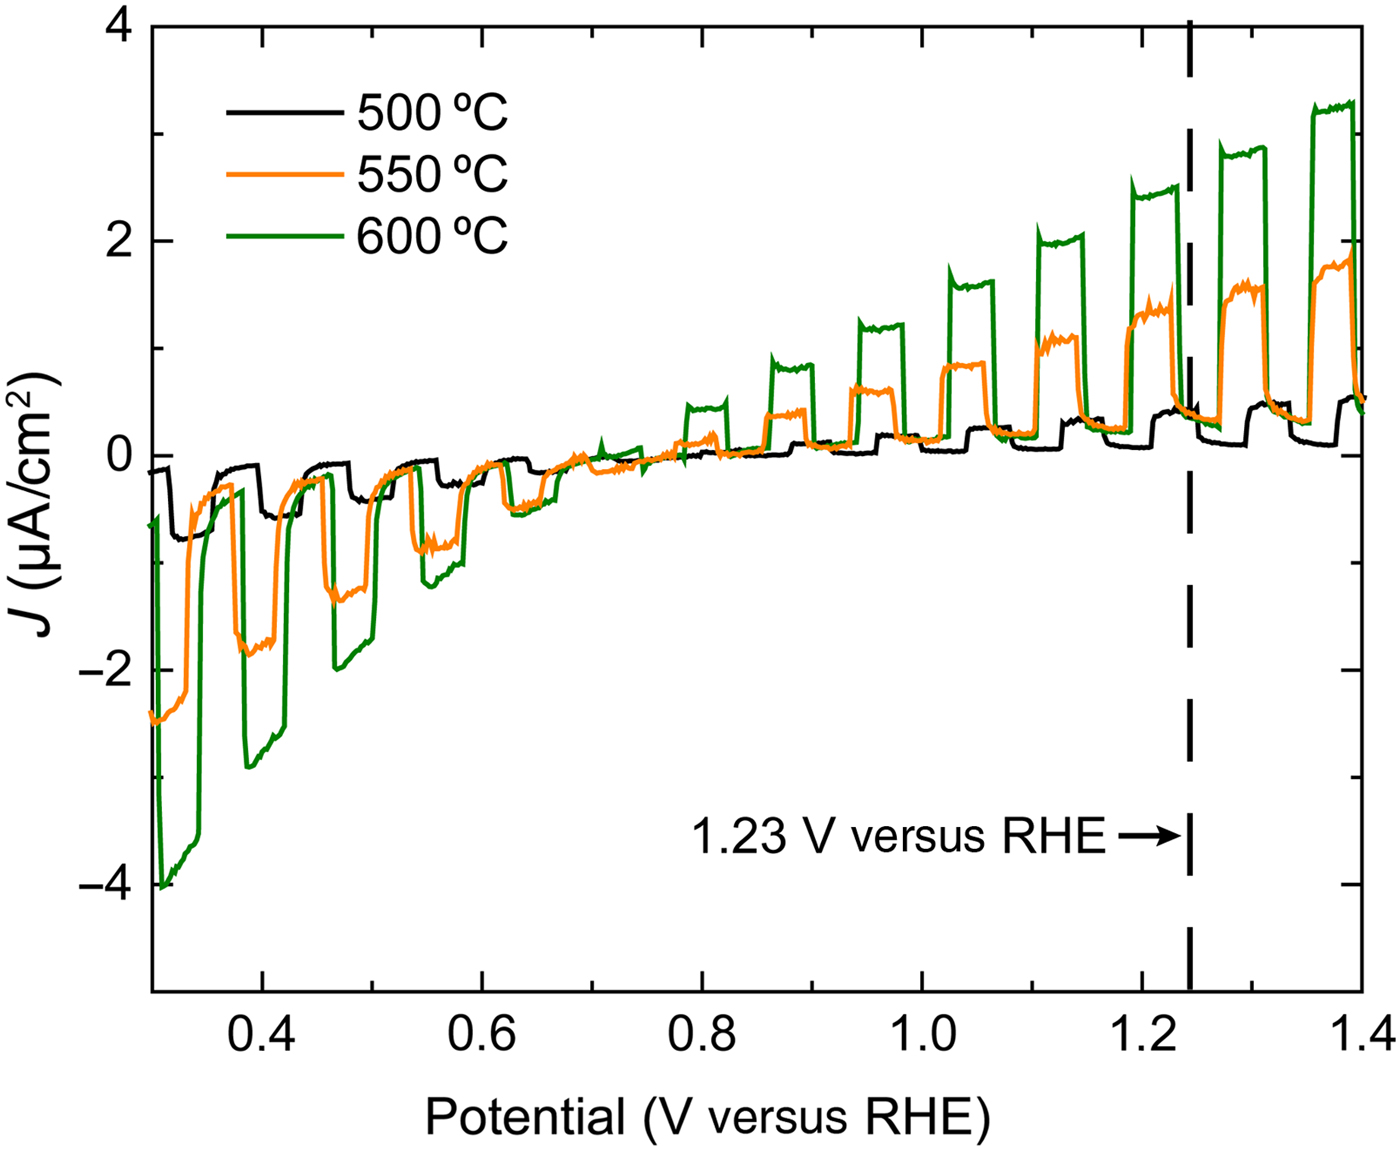
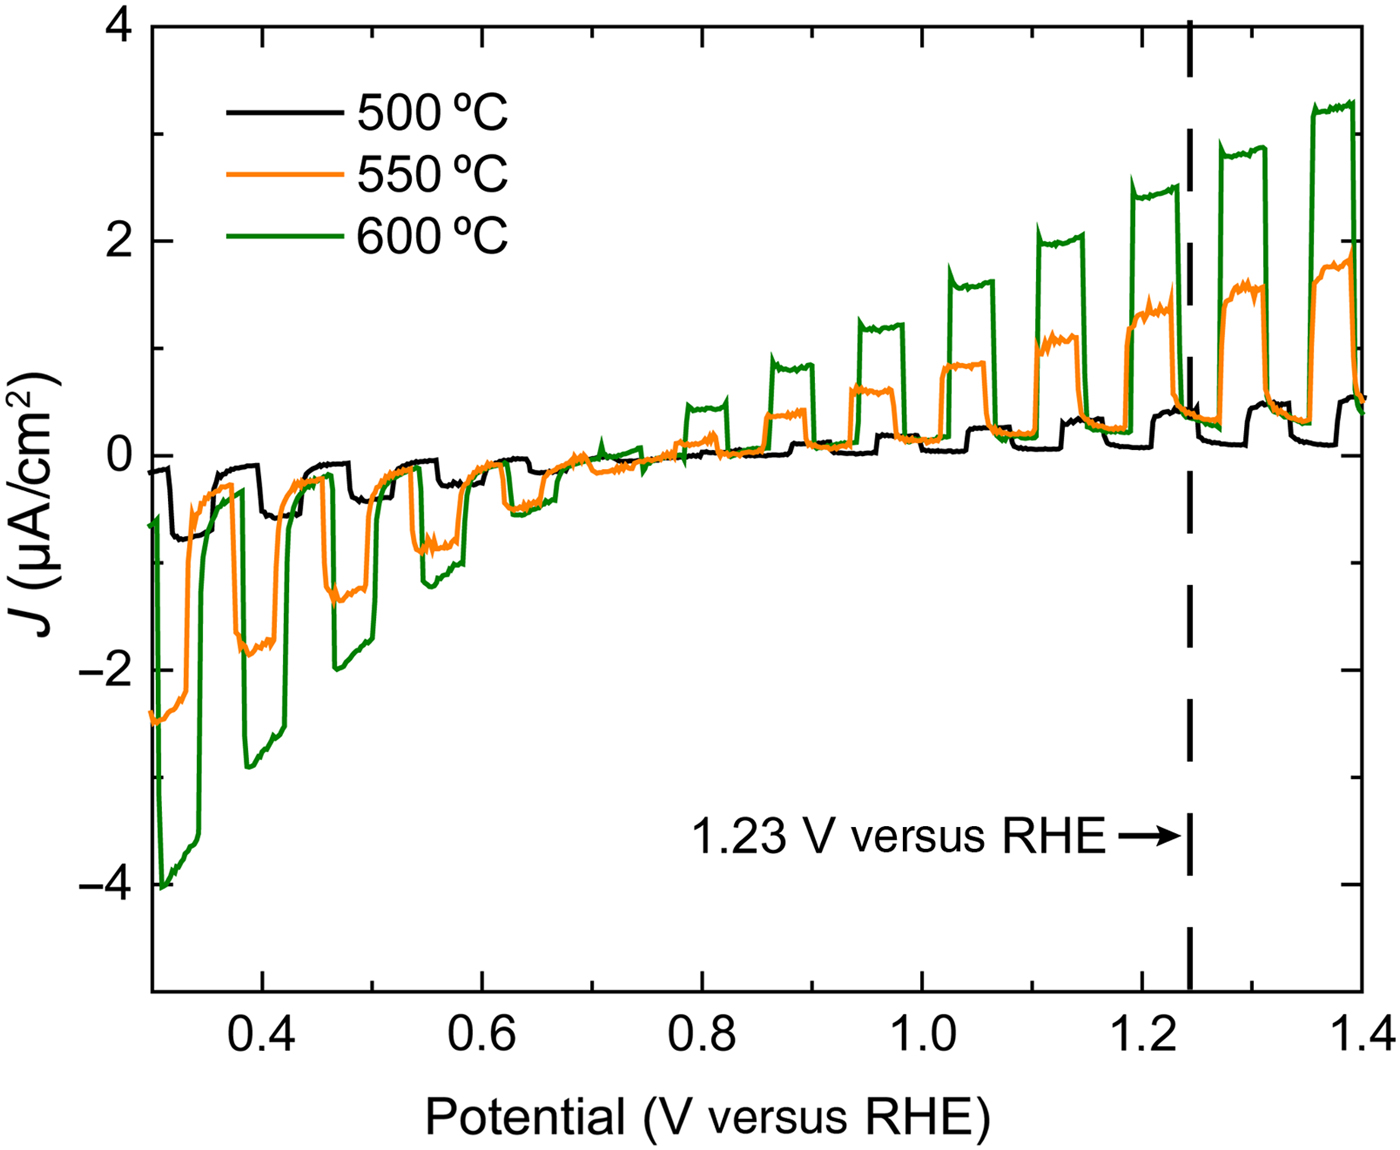
XRD patterns [Fig. 1(e)] of the nanofibers after calcination at 500, 550, and 600 °C for 4 h with a heating ramp of 1 °C/min revealed that annealing temperatures above 450 °C induce the crystallization of BFO.[Reference Xu, Ke, Jia, Wang and Zhou20] In addition, the appearance of impurity phases such as Bi25FeO39 and Bi2Fe4O9 during the crystallization of BFO was evident.[Reference Anthony Raj, Muneeswaran, Jegatheesan, Giridharan, Sivakumar and Senguttuvan21] Therefore, the annealing conditions required to be properly tuned. As expected, the nanofibers obtained after calcination were polycrystalline. The BFO R3C rhombohedral perovskite phase was identified for nanofibers calcined at 500 °C, while the coexistence of a phase that matched the composition Bi25FeO39 with the most intense peaks found between 11.3° and 15°, and from 23.4° and 27.4° was visible in the XRD data. No monometallic phases were detected. The secondary Bi25FeO39 phase was reduced upon increasing the annealing temperature to 550 °C, probably due to the volatilization of bismuth.[Reference Casper, Losego and Maria22] Only the pure BFO phase remained at 600 °C. Comparing the photocurrent values in fibers calcinated at 500, 550, and 600 °C (Fig. 2), it was observed that the current density, J, increased with the annealing temperature with maximum J observed for samples annealed at 600 °C. This can be correlated with the rise in crystallinity of the nanofibers as the temperature increases [Fig. 1(e)]. A further increase of the calcination temperature would very likely lead to higher J due to the increase in crystallinity up to a maximum value determined by the intrinsic charge carrier conversion and transfer of BFO, as well as their accumulation at the grain boundaries which creates an electric field hindering their mobility.[Reference Koster, Huijben and Rijnders23] However, it would also lead to the formation of n-type Bi2Fe4O9, as reported previously by Zhang et al.[Reference Zhang, Shen, Qiu, Liu, Xiong, Shi and Wei24] The photocurrent values of the BFO nanofibers grown at 600 °C showed values ranging from −4 to 3.5 µA/cm2, which are six times larger than those of BFO nanofibers reported in the literature.[Reference Zhang, Shen, Qiu, Liu, Xiong, Shi and Wei24] The water oxidation onset potential for the samples is about 0.7–0.8 V versus RHE, investigated with 1 M NaOH as electrolyte. We also observed two different behaviors of current density. There were negative values of the photogenerated current for values below the onset potential, whereas the current density became positive after. Negatives values of current density are attributed to p-type materials because they provide electrons to the electrolyte, whereas positive values of current density are common of n-type materials which collect electrons.[Reference Chen, Dinh and Miller1] The negative current density behavior was associated with BFO,[Reference Yang, Liu, Wei, Pan, Xiong and Shi25] while the positive J values could be linked to the n-type semiconductor Bi2Fe4O9 phase.[Reference Zhang, Guo, Duan, Li, Yang, Wang, Sun, Xu and Liu26] Additional XRD measurements performed on the electrodes confirmed the presence of Bi2Fe4O9 after their preparation at 700 °C for 4 h (Fig. S3). Electrodes that combine p- and n-type semiconductors such as the ones presented in this work, are beneficial for the generation of H2 and O2 from overall water-splitting, as reported before for other complex oxide (e.g., CaFe2O4–BiVO4) heterojunctions.[Reference Srinivasan, Sakai and Miyauchi27] Therefore, the presence of p- and n-type phases may be advantageous in the improvement of the PEC properties in our case.
Comparison of the current density J as chopped linear sweep voltammogram of BFO nanofibers calcined at 500, 550, and 600 °C, 1 °C/min, and 4 h.
α-Fe2O3/BFO nanofiber composite films and their PEC response
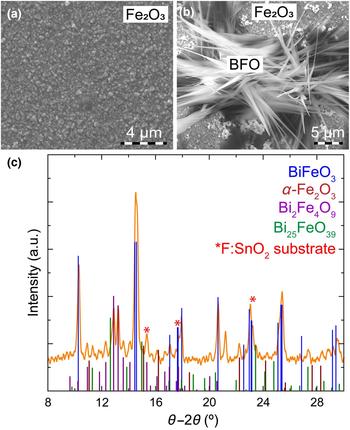
The evaluation of p-type and n-type semiconductors for their use in overall water-splitting was further investigated by combining BFO nanofibers with α-Fe2O3. Basically, nanofibers were dispersed into an α-Fe2O3 precursor solution used to produce the nanocomposite films. SEM analysis of a α-Fe2O3 film grown on FTO at 700 °C for 4 h [Fig. 3(a)] showed a very homogeneous film surface consisting of triangular-like grains with sizes between 100 and 500 nm and heights from 10 to 40 nm. Randomly distributed and shorter BFO nanoneedles were detected on α-Fe2O3 films [Fig. 3(b)]. The needles, which were merged together, have diameters of ~2–4 µm. The transformation of nanofibers into needles and the increase in dimensions would be caused by the subsequent high temperature annealing after deposition of the BFO nanofibers/α-Fe2O3 precursor solution.
SEM images of the α-Fe2O3 films (a) without and (b) with 25 wt% BFO nanofibers grown at 700 °C for 4 h. (c) Indexed XRD patterns of α-Fe2O3/BFO nanofibers films deposited on FTO substrates.
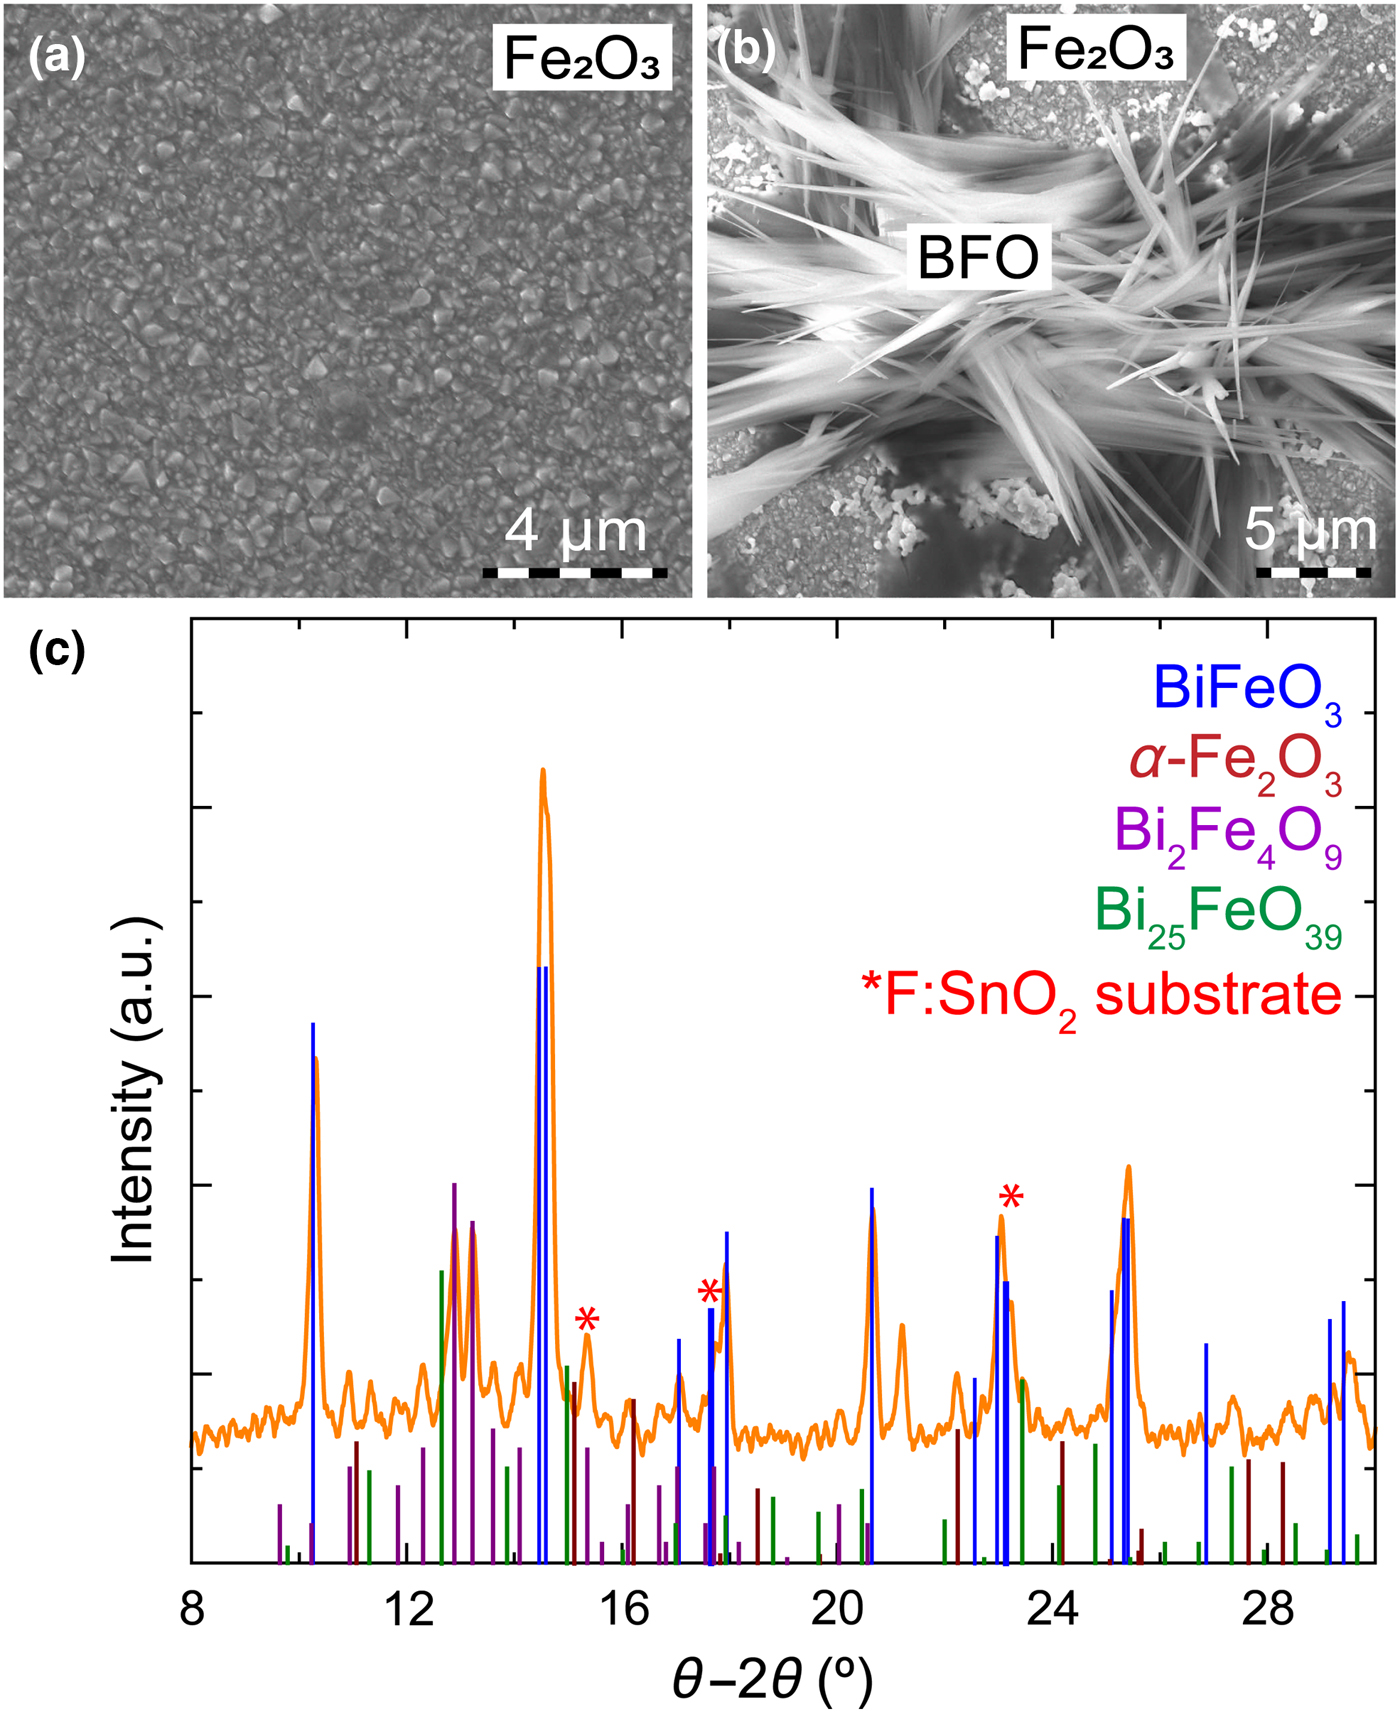
XRD measurements of BFO nanofibers/α-Fe2O3 nanocomposite films deposited on FTO substrates [Fig. 3(c)] revealed very intense peaks corresponding to the BFO phase. In addition, the presence of Bi2Fe4O9 was due to the annealing at 700 °C during the preparation of the photoelectrodes. The additional Fe content supplied by the α-Fe2O3 precursor solution, as well as Bi evaporation could also contribute to increase the amount of the Bi deficient Bi2Fe4O9 phase.
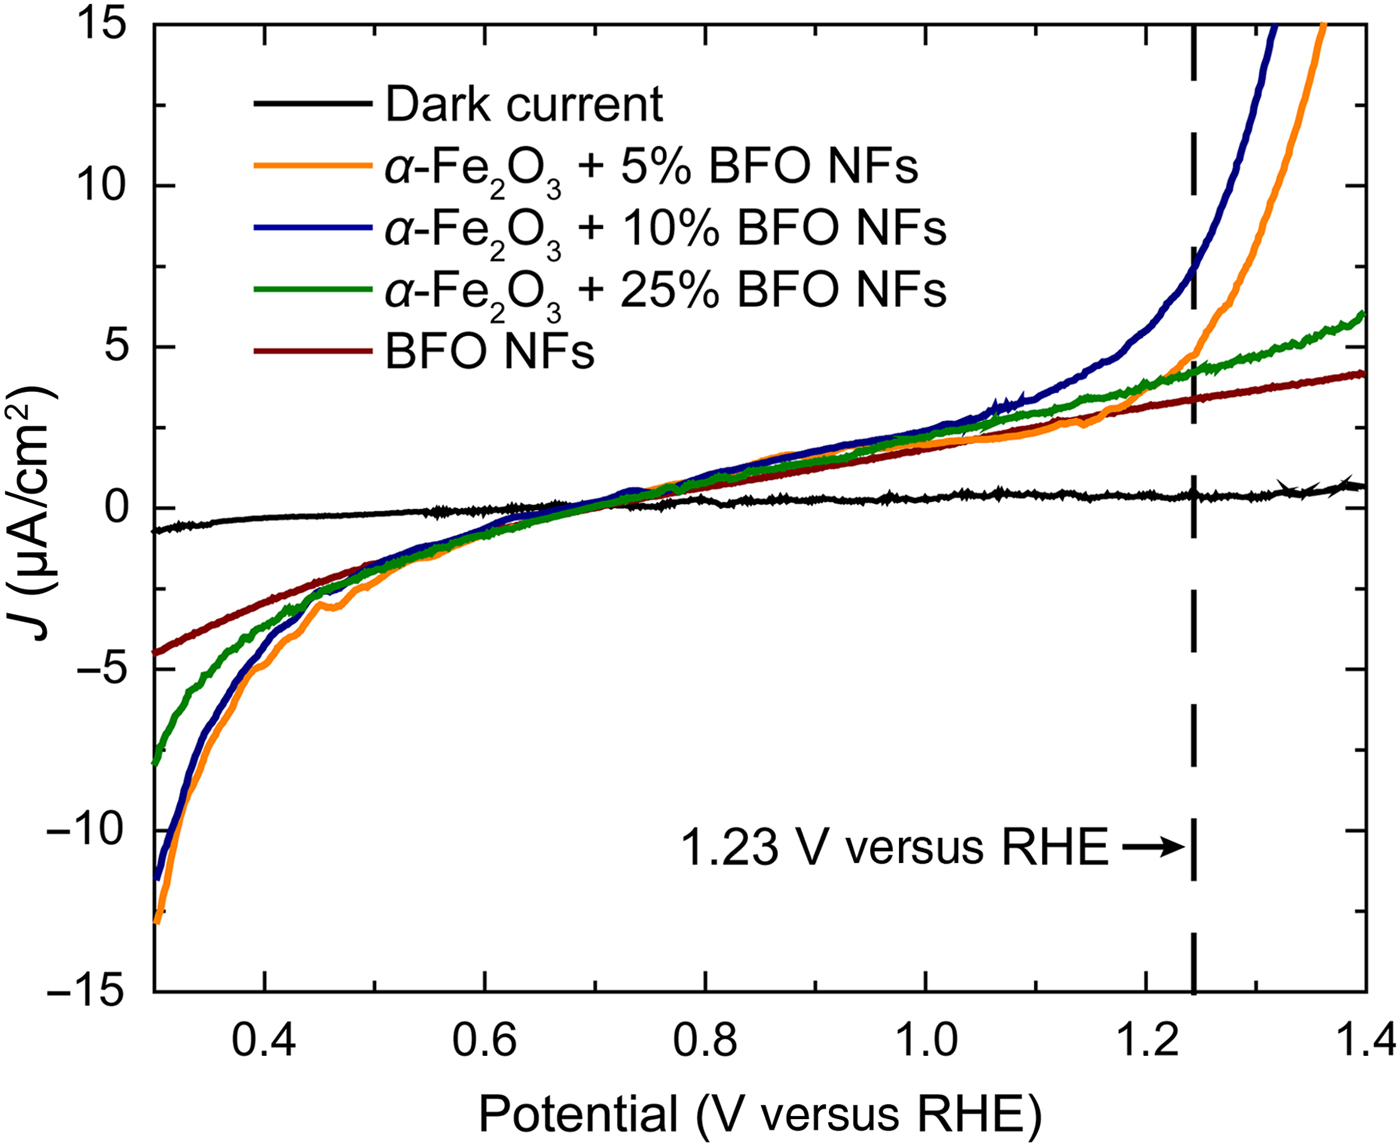
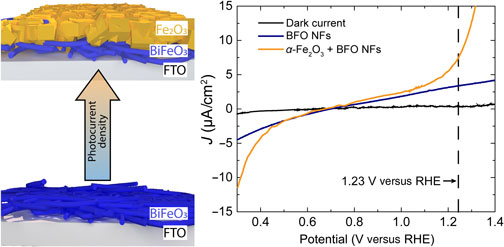
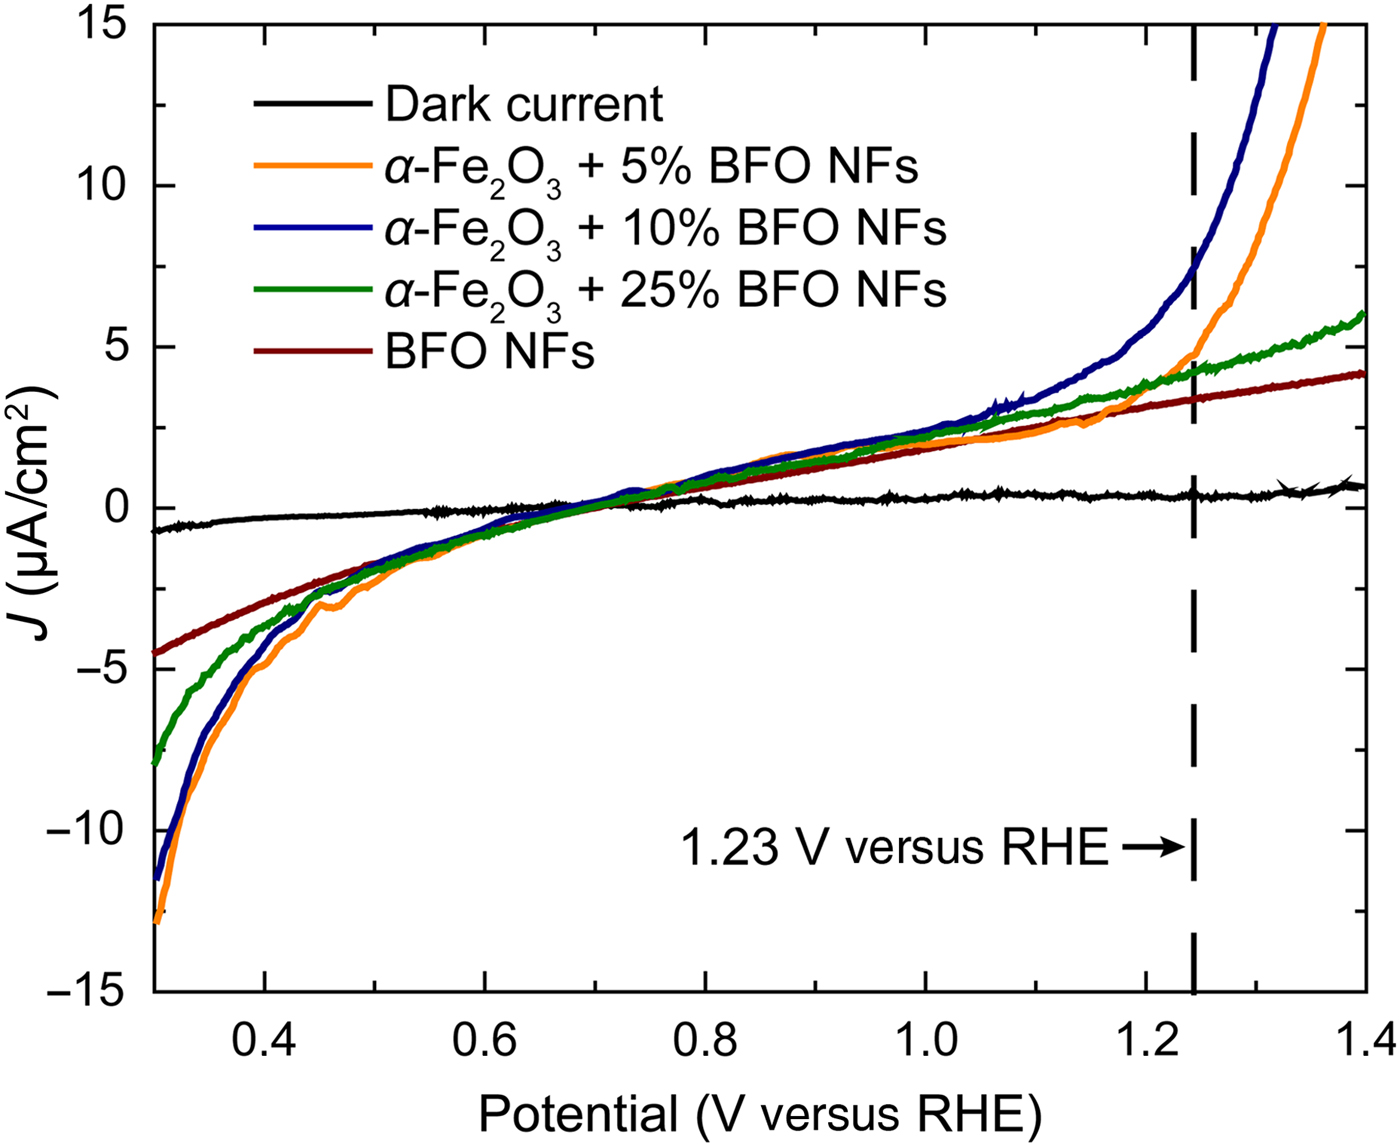
Linear sweep voltammograms (Fig. 4) collected from α-Fe2O3/BFO nanofiber composite films as a function of the BFO nanofibers content were recorded in 1 M aqueous NaOH solution in the dark and under light illumination. Comparing the photocurrent density of α-Fe2O3/BFO nanofiber composite films, we observed an increase of J with the amount of nanofibers from 4.3 µA/cm2 at 5 wt% to 7.5 µA/cm2 at 10 wt% (at 1.23 V versus reversible hydrogen electrode (RHE)), while it decreased to 4 µA after further addition of nanofibers (25 wt%). These values were much larger when compared to pure BFO nanofibers photoanodes (2 µA/cm2 at 1.23 V versus RHE), being around three times higher for films containing 10 wt% BFO nanofibers. The anisotropy in charge transport due to the underlying nanofibrous pathways, preventing charge recombination, but also the improved connection between nanofibers and substrate due to α-Fe2O3 may cause the increase in J values. On the other hand, the low J values at 25 wt% BFO nanofibers could be due to the decrease in contact with the substrate since the maximum covered surface area allowed was surpassed, thus, hindering the functional properties. The onset potential for water splitting remained unchanged (0.7 V versus RHE). A significant increase of J towards more negative values, from −4 µA/cm2 (pure BFO nanofibers) to −13 µA/cm2 (α-Fe2O3/BFO nanofiber films) was also observed. Despite the enhanced photocurrent density achieved as compared with pure BFO nanofibers, further improvement is still required. While BFO has a larger band gap than Fe2O3, transition metal oxides possess a short carrier diffusion length because the transfer of polarons from Fe2+ to Fe3+ creates crystal lattice deformations and impedes the charge transfer.[Reference Petrović, Chellappan, Dalapati and Ramakrishna28, Reference Shinde, Bansode, Bhosale and Rajpure29] The improvement in the photocurrent may also be limited by the slightly unfavorable positioning of the conduction band edge of Fe2O3, located at higher energy levels than BFO.[Reference Li and Wu30] Nevertheless, doping the structure of BFO with cations that substitute Fe has shown increased carrier diffusion length and higher photocurrent values due to the modification of the valence and conduction bands.[Reference Rong, Chu, Tang, Zhang, Cui, He, Zhang and Xiao14] Therefore, this will open a path for further enhancement of the PEC properties of our approach. In summary, the promising enhancement in photocurrent density reveals a pathway to achieve higher J values by combining nanofiber structures with sol–gel thin films. The combination of different fabrication methods such as electrospinning and spin-coating is key to improve the physical properties for the production of efficient photoelectrodes for water splitting.
Linear sweep voltammogram of α-Fe2O3 films with 5, 10, and 25 wt% of BFO nanofibers deposited on FTO substrates. The references for dark current and BFO nanofibers film with 10 wt% are plotted for comparison.
Conclusions
Nanocomposite α-Fe2O3/BiFeO3 nanofibers films where fabricated by combining electrospinning and spin-coating techniques. P-type semiconducting BFO nanofibers with diameters of 160 nm were grown from electrospinning showing good photocurrent density values. The formation of n-type semiconducting phases during the preparation of BFO/FTO electrodes leads to photocurrent responses with negative and positive values below and above the onset potential, being very interesting for their use as electrodes for overall water splitting. The integration of the BFO nanofibers into α-Fe2O3 films improves J values around four times compared with pure BFO nanofibers. The charge transport anisotropy due to the nanofibrous network promoting charge carrier separation and the better nanofiber/substrate connection causes the increase in J values. The enhancement of the carrier diffusion length of Fe, as well as the alignment between BFO and α-Fe2O3 conductions bands by doping with atoms that bring closer both conduction bands would provide an additional increase of the photocurrent densities for overall water splitting. The combination of electrospinning and spin-coating offers potential for the enhancement of the photoelectrocatalytic properties for the fabrication of efficient photoelectrodes for water splitting, but also for other applications that benefit from the use of electrospun nanofibers.
Supplementary material
The supplementary material for this article can be found at https://doi.org/10.1557/mrc.2018.101
Acknowledgments
Authors kindly acknowledge the financial support of the University of Cologne. A. Queraltó appreciates the support of the Alexander von Humboldt Foundation and the German Federal Ministry for Education and Research, supporting his postdoctoral research.