Introduction
Neuropsychiatric symptoms (NPS) of dementia including Alzheimer’s disease (NPS-AD) are highly prevalent (80–90%) and most patients with AD will exhibit one or multiple symptoms over the course of the illness (de and Vugt, Reference de Vugt2006; Steinberg, Reference Steinberg2004; Tariot, Reference Tariot1995). These symptoms tend to persist or recur and are associated with greater patient and caregiver distress, increased rates of institutionalization, and increased mortality (Shin, Reference Shin2005; Steinberg, Reference Steinberg2008; Tan et al., Reference Tan, Wong and Allen2005; Tatsumi, Reference Tatsumi2009). The range of NPS is wide and multidimensional and include depression, anxiety, irritability, apathy as well as agitation, aggression, aberrant vocalizations, hallucinations, and disinhibition among others. Cluster analyses have identified three to five syndromes of NPS-AD: behavioral dysfunction (e.g. agitation/aggressiveness); psychosis (e.g. delusions and hallucinations); and mood disturbance (e.g. depression or apathy) (Canevelli, Reference Canevelli2013). Management of NPS has relied on both pharmacological and non-pharmacological therapies based on treatments developed for idiopathic psychiatric disorders but have had limited effectiveness. The lack of progress for the development of these treatments may be due to an incomplete understanding of underlying biological mechanisms.
Recent neurobiological studies have used novel neuroimaging techniques to elucidate behaviorally relevant circuits and networks associated with NPS syndromes. Disruption in fronto-subcortical circuits, cortico-cortical networks, and neurotransmitter systems have been proposed as underlying NPS-AD. Common to most of these syndromes are the broad regions associated with the salience network (anterior cingulate and insula), mood regulation (amygdala), and motivated behavior (frontal cortex) (Balthazar, Reference Balthazar2014; Rosenberg et al., Reference Rosenberg, Nowrangi and Lyketsos2015). Correlating NPS with brain structure provides an approximation of the underlying mechanism.
We sought to examine these associations in an academic memory clinic setting where a large proportion of patients receive a structural 3T magnetic resonance imaging (MRI) as part of a standard clinical work-up for cognitive complaints including dementia with NPS. For this analysis, we focus on three common and distressing NPS: agitation, apathy, and delusional psychosis. Because existing literature has shown overlap between brain regions associated with these, we aimed to examine structural brain volumes using clinical quality MRI in a heterogenous “real world” clinical cohort. Specifically, we tested the hypothesis that decreases in specific regional volumes of limbic and frontal lobe structures are associated with these NPS. Based on synthetic literature review of NPS in dementia, (Rosenberg et al., Reference Rosenberg, Nowrangi and Lyketsos2015) we expected that decreased volumes of the insula, anterior cingulate cortex (ACC), amygdala, and hippocampus would be associated with agitation; posterior cingulate cortex, amygdala, hippocampus, and frontal lobar structures would be associated with apathy; cingulate cortex, frontal and prefrontal lobe structures (including the dorsolateral prefrontal cortex [DLPFC]), and amygdala would be associated with delusions. Compared to other studies from research settings, this dataset is derived from routine albeit specialized clinical care. We hope that this study will serve as a validating first step in the eventual application of more sophisticated neuroimaging methods to the study of behavioral symptoms across neuropsychiatric diseases in the clinical setting.
Methods
Participants and study design
This is a cross-sectional retrospective study performed in an outpatient memory disorders clinic at a tertiary teaching hospital. We collected clinical and neuroimaging data from the medical records of patients seen at the Johns Hopkins Memory and Alzheimer’s Treatment Center (“MATC”) who had presented for comprehensive evaluation of cognitive and related complaints between 2008 and 2010. Clinicians included neurologists, geriatric neuropsychiatrists, and geriatricians. Patients received a comprehensive neurocognitive, neuropsychiatric, and functional evaluation which often included obtaining a brain MRI based on clinical determination. The range of diagnoses is wide (ranging from no cognitive impairment to severe dementia) and a majority of patients were followed over time. Chart review was conducted on 90 individuals who also received a 3T MRI scan as a routine part of their clinical care. These scans were performed at Johns Hopkins Bayview Medical Center using a standardized scanning protocol. The study was approved by the Johns Hopkins Institutional Review Board. A waiver of consent provided retrospective access to patients’ medical records for this study.
MRI scan acquisition and image processing
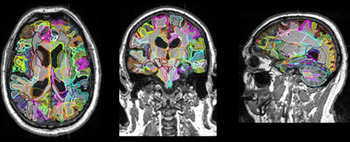
A three-dimensional, magnetization-prepared, rapid gradient-echo sequence was utilized, with a repetition time of 2300 ms, an echo time of 2.98 ms, and a voxel resolution of 1 × 1 × 1 mm, scanned on a 3T Siemens Verio scanner (Siemens, Erlangen, Germany). Image processing employed a multi-atlas label fusion method in which an entire brain is automatically parcellated into 265 anatomical units (Tang, Reference Tang2013). This is a fully automated method accessible through the website (www.MRICloud.org). All MRIs were bias-corrected and linearly aligned to the Johns Hopkins University JHU-MNI atlas space (Oishi, Reference Oishi2009). Then, atlases in the JHU T1 Geriatric Multi-Atlas Inventory (Djamanakova, Reference Djamanakova2013; Wu, Reference Wu2016), which is designed for geriatric patient populations with potential brain atrophy, were transformed to the linearly aligned subject image using large deformation diffeomorphic metric mapping (LDDMM) (Ceritoglu, Reference Ceritoglu2009). The multi-atlas fusion algorithm (Tang, Reference Tang2013) was applied to the transformed atlases to obtain a brain-structure parcellation map specific to each subject MRI. The volume of each parcel was measured. This generated brain volumes in 193 regions (Figure 1). All MRI scans were generally obtained soon after baseline visits in the MATC.
193 segment parcellation using JHU T1 Geriatric Multi-Atlas Inventory.

Region of interest selection
From a prior synthetic literature review (Rosenberg et al., Reference Rosenberg, Nowrangi and Lyketsos2015), we identified candidate brain regions of interest (ROIs) for this analysis that were commonly associated with NPS-AD using various neuroimaging methods. This review allowed us to identify the ROIs associated with each NPS by selecting the ones that were most commonly cited across studies. For agitation, we identified the insula, cingulum bundle, ACC, amygdala, hippocampus, and DLPFC. For apathy, we found the orbitofrontal cortex, frontal gyrus, posterior cingulate cortex, amygdala, DLPFC, hippocampus, middle and superior temporal cortex. For delusions, we identified the DLPFC, anterior and posterior cingulate cortex, orbitofrontal cortex, anterior insula, hippocampus, and parahippocampal gyrus. We compared these ROIs with those from the 193 regions generated by the parcellated MRI scans and selected ROIs for statistical analysis that matched. Where there were multiple subregions for a ROI, we included all of them into the statistical analysis.
Assessment of cognitive and NPS
NPS were assessed with the Neuropsychiatric Inventory Questionnaire (NPI-Q) (Cummings, Reference Cummings1997; de Medeiros, Reference de Medeiros2010). The NPI-Q was adapted from and cross-validated with the standard NPI (Cummings, Reference Cummings1994) to provide a brief assessment of NPS primarily in the clinical setting. It is an informant-based self-administered survey containing 12 behavioral domains. Initial responses to each domain question require a yes or no answer for whether a specific symptom is present. If present, a 3-point scale is used to rate the severity of the symptoms within the last month and a 5-point scale rating caregiver distress. For the present analysis, the data available included whether a particular symptom was present (yes or no), total severity score, and the total NPI-Q score. Because we were interested in the association of individual brain structures with the presence of a behavioral phenotype, informants who indicated that a symptom (agitation, delusions, apathy) was present (yes) were included into the analysis. It is possible that a patient had more than one symptom present and in that case included them into the subanalysis for each positive domain.
At the baseline visit, all patients received the Mini-Mental State Exam (MMSE) (Folstein et al., Reference Folstein, Folstein and McHugh1975) and many completed the following cognitive battery: Modified Mini-Mental State 3MS (Teng and Chui, Reference Teng and Chui1987), Animal Fluency (Lezak, Reference Lezak and Lezak2004c), Hopkins Verbal Learning Test Revised (HVLT-R) (Miotto, Reference Miotto2012), Clock Drawing Task (Goodglass, Reference Goodglass1983), Controlled Oral Word Association Test (COWAT) (Ruff, Reference Ruff1996), Trails Making Test (TMT) A and B (Reitan, Reference Reitan1955). Patients and families filled out structured and standardized rating scales for the assessment of severity of cognitive symptoms (IQCODE), daily function skills (Functional Activities Questionnaire [FAQ] [Pfeffer, Reference Pfeffer1982]), and Geriatric Depression Scale (GDS) (Yesavage, Reference Yesavage1982). As the MMSE is often used in clinical and research settings to determine normal cognition, MCI, and dementia syndrome, we utilized this construct to subgroup the sample as described below (Crum, Reference Crum1993; Nilsson, Reference Nilsson2007; Tombaugh and McIntyre, Reference Tombaugh and McIntyre1992).
Statistical analysis
Following previously described approaches to identify candidate ROIs (as in 2.2.1), we a priori identified and selected five structures for agitation, five for apathy, and three for delusions. We included both right and left hemispheres effectively doubling the number of structures analyzed. An attempt was made to extract diagnosis from the free-text sections of the history and physical form. Between clinicians, diagnostic terminology varied widely. For example, diagnoses suggesting dementia syndrome would receive “Alzheimer’s Dementia,” “Dementia NOS,” “memory and functional loss,” and other designations. At times, there were no discernable or completely missing diagnoses due to the hand-written nature of the patient charts. To account for this variability as well as to examine the relationship between cognition, NPS, and brain volume, we standardized the sample by severity of cognitive impairment using MMSE score. The most impaired group corresponding to dementia category MMSE: 0–20; middle impairment corresponding to MCI: 21–26; mild impairment corresponding to normal cognition: 27–30. Within each MMSE stratified group, linear regression models, controlling for age, years of education, and sex were estimated to examine the association between ROI and NPS.
Differences in baseline characteristics for the total sample and between MMSE groups were examined using Fisher’s Exact Tests for categorical variables and ANOVAs for continuous variables, with t-tests for pairwise comparisons when a significant difference (p < 0.05) was noted. Bonferroni and Holm methods for multiple comparisons controlling for 84 tests (28 ROIs × 3 groups) were applied to control the family-wise error rate. All computations were completed using STATA version 15.0 (StataCorp, College Station, TX).
Results
Participant characteristics
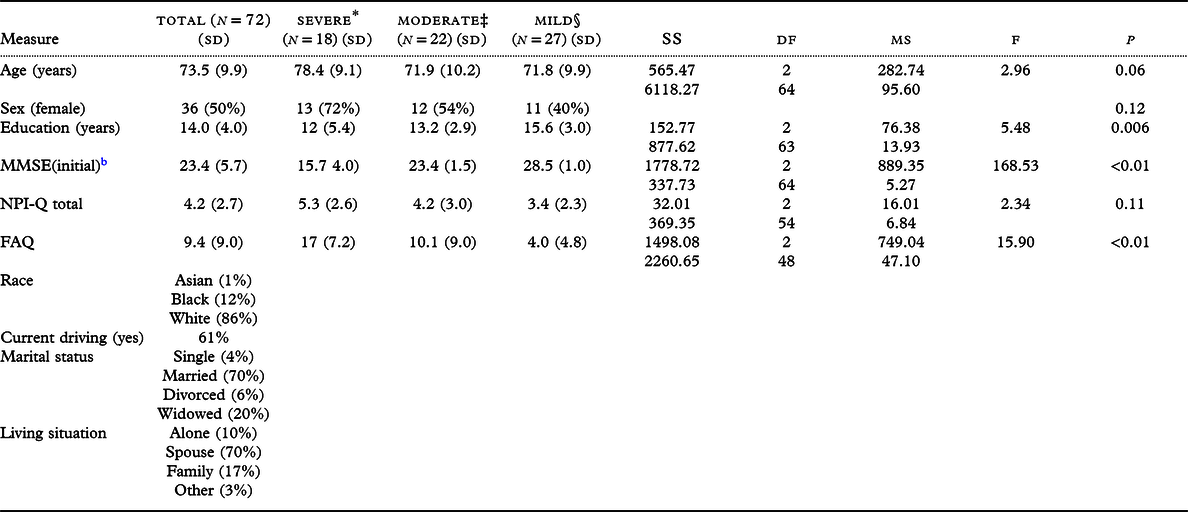
A total of 163 clinical MRI scans of MATC patients were available for analysis. Of these, 90 were part of the initial diagnostic workup, and of those 72 had analyzable clinical, neuropsychological, and behavioral data. Clinical characteristics for the whole group and MMSE subgroups characteristics are shown in Table 1. Unsurprisingly, for an outpatient cohort at an academic medical center, the total cohort on average was well educated, had mild cognitive and functional impairment, was married, and was living with their spouse. Between group comparisons indicate significant differences in MMSE (F(2,63) = 168.53, p < 0.01), FAQ (F(2,48) = 15.90, p < 0.01), and education (F(2,63) = 5.48, p = 0.006). Scores on the NPI-Q were generally and relatively low (range of 3.4–5.3) in each of the MMSE subgroups reflecting only mild behavioral disturbance. Differences between groups with respect to NPI-Q total scores were not significant.
Mean baseline participant characteristics and one-way ANOVA a

a Abbreviations: SS = sum of squares; df = degrees of freedom; MS = mean squares; MMSE = Mini-Mental State Examination; FAQ = Functional Activities Questionnaire; NPI-Q = Neuropsychiatric Inventory Questionnaire
b MMSE data for five patients were not included and so were omitted from the imaging analysis.
Association between ROI and NPS subdomain by group
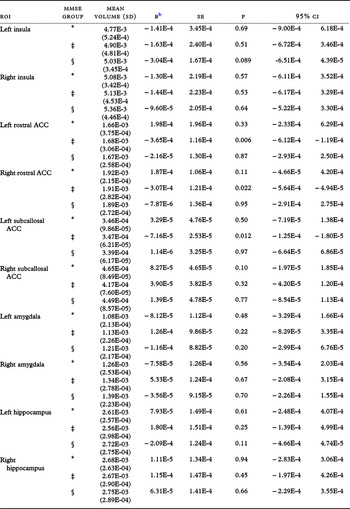
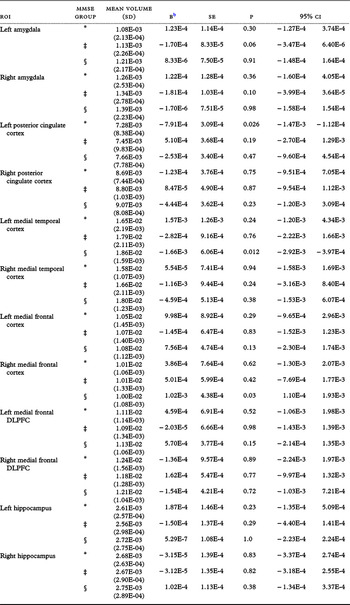
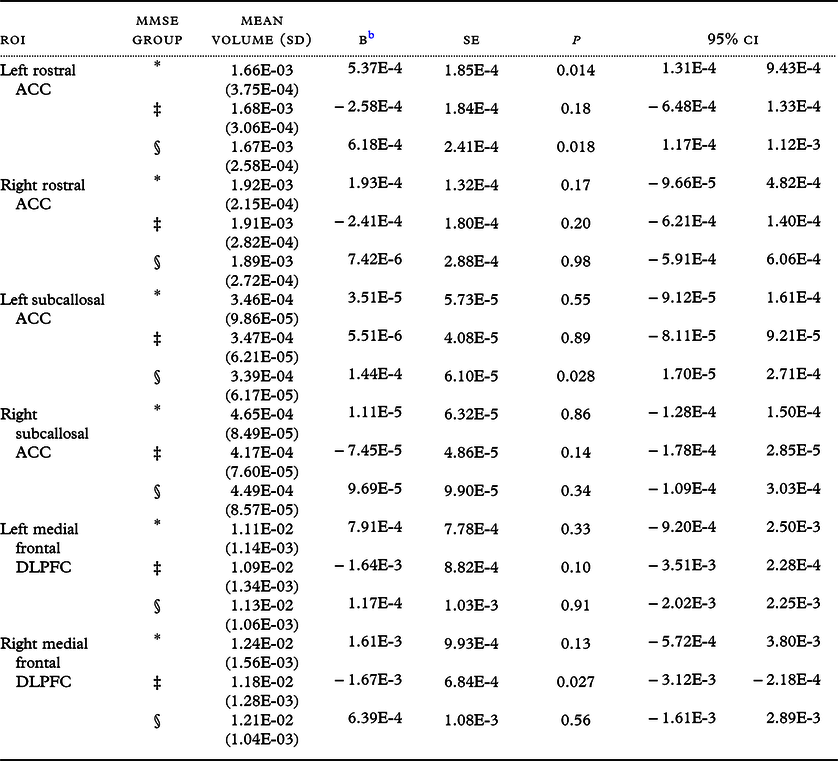
We performed within MMSE group stratified regression analyses. Individuals without an MMSE score were excluded from the regression analyses. These results are in Table 2A-C and summarized below.
Summary of linear regression analysis for ROI on NPI domain: Agitation a

a Abbreviations: ACC = anterior cingulate cortex. Mean volumes in mm3.
b B = unstandardized slopes.
NPI-Q Agitation was inversely associated with ROI volumes in rostral ACC bilaterally (left: β = −3.65E-4, p < 0.01; right: β = 3.06E-4, p = 0.02) and left subcallosal ACC (β = −7.16E-5, p = 0.012) only within the moderate subgroup (see Table 2A). Other regions including the amygdala and insula were not associated with agitation. NPI-Q Apathy was inversely associated with volumes of the left posterior cingulate cortex (β = −7.91E-4, p = 0.026) in the severe group, and the left medial temporal cortex (β = −1.66E-3, p = 0.012) in the mild subgroup. It was positively associated with right medial temporal cortex (β = 1.02E-3, p = 0.03) (see Table 2B). No other ROIs were associated with apathy. NPI-Q Delusions were positively associated with left ACC volumes including the rostral regions in severe and mild groups and the right subcallosal region in the mild subgroup. Finally, the right dorsomedial prefrontal cortex had a significant inverse association (β = −1.67E-3, p = 0.03) in the moderate subgroup (see Table 2C). In spite of these significant results, they did not survive correction for multiple comparisons and listed p-values are uncorrected.
Summary of linear regression analysis for ROI on NPI domain: Apathy a

a Abbreviations: DLPFC = Dorsolateral Prefrontal Cortex. Mean volumes in mm3.
b B = unstandardized slopes.
Summary of linear regression analysis for ROI on NPI domain: Delusions a

a Abbreviations: DLPFC = Dorsolateral prefrontal cortex; ACC = Anterior cingulate cortex. Mean volumes in mm3.
b B = unstandardized slopes.
Discussion
In this volumetric MRI study of outpatient memory clinic patients, we examined the relationship between structural brain volume and reported NPS. We hypothesized that selected NPS would be associated with structural brain volumes in regions classically associated with behavior and emotion as seen in existing literature, but in a well-characterized heterogeneous sample of community-dwelling older patients (>65) seen in our memory clinic. We used the results of our systematic review of NPS in AD to generate an a priori list of brain regions for the most common and distressing NPS: agitation, apathy, and delusions. Our most important finding is that volumetric analysis of clinical quality, non-research protocol MRI scans closely mirrors results of research-quality analyses when investigating relationship of NPS with brain volume of specific behaviorally relevant structures in individuals with cognitive impairment (McLachlan, Reference McLachlan2018; Poulin, Reference Poulin2017; Tascone, Reference Tascone2017; Hu, Reference Hu2015). Other structural MRI studies including one by Hentschel et al. (Reference Hentschel2005) also took place in the clinic setting but did not focus on NPS. Moreover, we show consistent relationships between limbic lobe structures and prefrontal and frontal lobe structures and identified NPS as seen in the pre-existing literature.
We stratified analyses by MMSE range to reflect degree in order to examine the relationship between cognitive status, NPS, and brain volume in a heterogenous sample where evaluations and diagnoses by physicians from different specialties were unstandardized. While specific etiology of cognitive impairment was not considered in this analysis, i.e. diagnosis, we inferred cognitive impairment by subgrouping by MMSE scores that are commonly grouped and considered as mild, moderate, and severe impairment. This method yielded three groups with significantly differing MMSE, FAQ, and years of education. Reassuringly, FAQ scores approximately corresponded to MMSE scores where the most cognitively impaired group showed the greatest amount of functional impairment suggestive of a dementia syndrome and the least cognitively impaired group had the lowest FAQ scores suggestive of normal daily function. As such, these groups appear to have clinical characteristics consistent with cognition and daily function of individuals who are normal, mildly impaired, and in the dementia range as was initially intended in our subgrouping method. Additionally, it is important to also note that as a whole, the cohort had mild behavioral disturbance when considering the low total NPI-Q scores. The effect of global mild behavioral symptoms on brain structure and function is an area of emerging scientific inquiry (Gallagher et al., Reference Gallagher, Fischer and Iaboni2017; Ismail, Reference Ismail2017) but since our focus was on the association of structural anatomy with the presence of individual and specific symptoms of behavioral disturbance as seen on NPI-Q subdomains, we suggest this as an area of future investigation.
As the MRI scans were of clinical and not research quality, we were particularly keen to examine relationships between anatomical regions and clinical variables, in this case NPS symptoms. We chose agitation, apathy, and delusions because of the prevalence (Steinberg, Reference Steinberg2008; Peters, Reference Peters2012; Tschanz, Reference Tschanz2011) of these symptoms in cognitive disorders, particularly Alzheimer’s disease, as well as the distress these symptoms cause patients and their caregivers. Of particular interest is the significance of the cingulate cortex in each of these symptoms. Because the cingulate cortex occupies a large portion of the limbic lobe with rich reciprocal heteromodal interconnections between motor systems, the amygdala, the hypothalamus, and other structures, it is not surprising that the regions of the cingulate appear consistently in other neuroimaging studies of neuropsychiatric diseases.
The anterior cingulate in particular is considered an “executive” region which is further divided into subregions specific to emotion and affect as well as cognition. Results of our analysis show associations between the ACC and agitation and delusions, which certainly could be argued are at least partially under executive control. Additionally, the DLPFC was found to be associated with delusions, which is a finding that has been supported in other studies of NPS in AD (Rafii, Reference Rafii2014; Nakaaki, Reference Nakaaki2013; Koppel, Reference Koppel2012, Reference Koppel2018). The ACC however was also found to be associated with positive β values. One potential explanation for this is that increasing volume of the ACC may represent hyperconnectivity of the region which results in increased delusions. This is a finding that is seen in studies of delusions in other neuropsychiatric diseases such as schizophrenia where psychosis is a defining symptom. In schizophrenia research using functional neuroimaging such as fMRI, regional hyperconnectivity is thought to be a potential mechanism for psychotic symptom presentation (Bernard et al., Reference Bernard, Orr and Mittal2017; Cao, Reference Cao2018; Dandash, Reference Dandash2014; Fusar-Poli, Reference Fusar-Poli2011). Future research in the NPS of AD will benefit from applying similar functional neuroimaging techniques to examine relative brain connectivity in patients with NPS and AD.
Another significant function of the ACC is in initiation, motivation, and goal-directed behaviors. It would follow, then, that the ACC would also be associated in apathy. Instead, the posterior cingulum (PCC) and the medial frontal and medial temporal regions were found to be significant. While the PCC plays key roles in visuospatial cognition and memory with its rich interconnectedness with hippocampus and posterior parahippocampal gyri, posterior parietal cortex, and dorsal striatum, it is not typically associated with initiative and drive as these traits are traditionally associated with the amygdala and prefrontal cortex. Nonetheless, the larger medial frontal and medial temporal regions were found to be significantly associated suggesting limbic and frontal area involvement even if other expected substructures such as the hippocampus, amygdala, and insular cortex were not found to be significantly related. Of course, results of this study are based solely on structural volume and any assertion of brain activity or function is inferred. Nonetheless, the apparent importance of the ACC as a “behavioral hub” is supported by the results of this analysis.
While this analysis has yielded results in broad agreement with other studies of NPS and brain structure in cognitively impaired older individuals, there are several limitations. First, while having a multi-specialty clinic is generally considered a strength, physicians from neurology, psychiatry, and geriatrics did not have a standardized protocol for assessment, documentation, terminology, and diagnosis. Even though clinicians were subspecialists in dementia care, diagnostic terminology, among other assessment elements, varied widely. This limitation was the impetus for developing the grouping method using the MMSE for this paper. Moreover, though significant associations were found with the moderate MMSE subgroup in agitated patients, other significant anatomy-subgroup relationships did not seem to have a discernable pattern in either apathetic or delusional patients. Additionally, because more specific diagnoses were not made until subsequent visits, collecting longitudinal data would be important. Future research should also investigate the relationship between disease severity and anatomical changes. While this clinic and others would benefit from adopting a standard assessment protocol, future analyses from this cohort may use a blinded multi-rater consensus diagnosis method to better subgroup patients. Secondly, NPI-Q scores were cumulative and unfortunately did not include severity ratings by specific symptom but only total severity ratings. Having these additional data would likely add to the significance of the findings by allowing further subanalyses of symptom severity for each NPS, perhaps to aid in determining the predominant behavioral phenotype for more accurate grouping. Finally, given the exploratory nature of this research and that our goal was to compare clinical MRI findings with research-grade, we did not expect nor did we observe survival of correction for multiple comparisons. Future analyses focused on hypothesis testing will benefit from this research as a smaller set of neuroanatomic regions can be chosen thereby reducing the potential for Type I error from multiple comparisons. Even with these limitations, we believe that the results of this analysis provide evidence of concordance to other prior protocol-driven research studies and can serve as validation of clinical methods as well as a baseline for future studies performed under clinical conditions. Future research from our group will combine a high-volume fully automated imaging pipeline capable of analyzing regional volumetric, microstructural (diffusion tensor imaging), and functional (resting state functional MRI) sequences that will be combined with automated clinical data extraction methods from an electronic medical record system to deliver results for improved hypothesis testing.
Conflicts of interest
None.
Description of authors’ roles
M.A. Nowrangi designed the study, formulated the research question, supervised the data collection, performed the analysis, and wrote the manuscript. C. Marano designed the study, supervised the data collection, and contributed to the manuscript; H.I. Sair contributed to the data analysis and manuscript generation; K. Oishi supervised the data collection and analysis and generated the manuscript; S. Mori supervised the data collection and analysis; J. Outen contributed to the manuscript preparation and data analysis; J. Leoutsakos contributed to the data analysis and manuscript generation; C. Lyketsos designed the study, formulated the research question, supervised the data collection, and contributed to the manuscript; P.B. Rosenberg supervised the data collection and analysis and contributed to the manuscript.
Acknowledgement
The authors would like to thank the Ossoff family for their generous support as well as the Johns Hopkins Precision Medicine Center of Excellence in Alzheimer’s Disease for its support and guidance.