1. Introduction
Tracks are known to outperform wheels in terms of improved traction on steep hard and soft surfaces, and better obstacle negotiation [Reference Rasool1,Reference Wong and Huang2]. Tracked robots have been successfully demonstrated in many applications, including urban search and rescue [Reference Murphy3], automation of industrial processes [Reference Galati, Mantriota and Reina4], explosive ordnance disposal [Reference t. Grigore, Oncioiu, Priescu and Joiţa5], and precision agriculture [Reference Botta, Cavallone, Baglieri, Colucci, Tagliavini and Quaglia6]. Some innovative concepts have been proposed to further improve state-of-the-art mobility, for example, PackBot [Reference Mcbride, Longoria and Krotkov7], Quince [Reference Nagatani, Kiribayashi, Okada, Tadokoro, Nishimura, Yoshida, Koyanagi and Hada8], and Mothership [Reference Huff, Conyers and Voyles9]. Adoption of elastically mounted running gear elements has also been shown to have a positive impact on net traction force, vehicle vertical acceleration, and pressure distribution by improving the adaptation to terrain roughness [Reference Kim, Kim and Lee10,Reference Li, Zang, Shi, Lv and Lin11]. Nevertheless, new designs need to be investigated yet to push forward the limits of the next generation of tracked robots with the aim of improving riding properties that are tightly connected with the working effectiveness if a sensitive sensor is mounted on or manipulated by the robot.
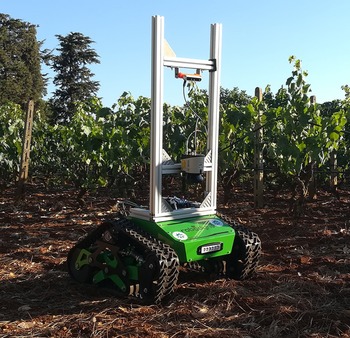
In this context, POLIBOT (POLItecnico of Bari’s roBOT), shown in Fig. 1 while operating in a commercial vineyard, represents a novel contribution. Highlights of the proposed robot refer to the use of an articulated suspension similar to a multi-leg insect that ensures high load capacity, vibration reduction, and negotiation of highly challenging terrains. It features a footprint of 1.5
 $\times$
1 m and weighs about 70 kg with a payload of up to 40 kg. The control and acquisition systems have been implemented under ROS (Robot Operating System). POLIBOT standard sensor suite includes sensors to measure the electrical currents drawn by the two drive motors, and a dual GPS system that works in conjunction with low-cost inertial measurement units (IMUs) providing position estimation with cm accuracy [Reference Galati, Mantriota and Reina12]. The aluminum frame attached to the top plate allows the robot to be equipped with various dedicated sensors, such as laser range finders and monitoring cameras [Reference Vulpi, Marani, Petitti, Reina and Milella13]. More details on POLIBOT design and its analytical modeling can be found in ref. [Reference Ugenti, Galati, Mantriota and Reina14], and they are not repeated here to avoid redundancy. Instead, this paper focuses on the development of the POLIBOT multibody (MB) model and its validation against the experimental prototype. While early parts were previously introduced in ref. [Reference Grazioso, Galati, Mantriota, Reina, Niola, Gasparetto, Quaglia and Carbone15], the novelties of this research refer to the comparison with the real robot in both static and dynamic tests and the performance evaluation on various challenging scenarios, including positive and negative obstacles, and stochastic uneven terrain.
The all-terrain tracked robot POLIBOT.

Taking advantage of the increasing availability of computational resources, numerical simulations have become an important tool for predicting the behavior of complex mechanical systems [Reference Balena, Mantriota and Reina16,Reference Blanco-Claraco, Leanza and Reina17]. Tracked robots are examples of flexible multibody system with challenges that include the presence of many friction contacts, track modeling, and track–terrain interaction. In this research, the POLIBOT digital twin is developed within MSC Adams [18] using the toolkit Adams Tracked Vehicle (ATV) [19] that is under testing and development at the Politecnico of Bari’s Robotic Mobility Lab. Following this approach, many system configurations can be evaluated from the early design phase and a wide number of operating conditions can be simulated with high fidelity without performing expensive and time-consuming field experiments.
The paper is organized as follows. Section 2 recalls basic principles of MB modeling and describes the POLIBOT model giving details of the single subcomponents that form the overall robot assembly. Next, Section 3 presents the model validation with the real prototype via static and dynamic tests. Next, Section 4 discusses the predictions obtained from the model for various challenging scenarios. Section 5 concludes the paper by drawing the main results and lessons learned.
2. Multibody modeling
In this work, the robot POLIBOT is considered as a multibody system. The position problem corresponds to solving the constraint equations:
 \begin{equation} \phi (q,t)=0 \end{equation}
where
 $q$
is the vector of generalized system coordinates and
 $t$
is the time. By differentiating Eq. (1), it is possible to obtain the velocity kinematic constraint:
 \begin{equation} \phi _q \dot{q}=0 \end{equation}
where
 $\phi _q$
is the Jacobian matrix of the constraint equations with respect to
 $q$
and
 $\dot{q}$
is the vector of generalized velocities. By taking the first derivative again, the acceleration kinematic equations are obtained:
 \begin{equation} \phi _q \ddot{q}=-\dot{\phi _q} \dot{q}=c \end{equation}
where
 $\ddot{q}$
is the vector of generalized accelerations. For a consistent time evolution of the modeled system, the genaralized coordinates
 $q$
must satisfy the kinematic Eqs. (1)–(3).
Dynamics must be included in the model by applying Newton’s law and by taking into account constraints, leading to the following set of differential equations:
 \begin{equation} M\ddot{q}+\phi _q^T\lambda = Q \end{equation}
where
 $M$
is the mass matrix,
 $Q$
is the vector of external forces, and
 $\lambda$
is the vector of Lagrangian multipliers. The objective of a multibody simulation software is to solve Eqs. (3) and (4) simultaneously. If
 $n$
and
 $m$
refer, respectively, to the dimension of the generalized coordinates and constraint equations, Eq. (4) represents a set of
 $n$
equations in
 $n + m$
variables. By adding the
 $m$
Eq. (3), the following system can be obtained and solved for simultaneous solution of the accelerations and Lagrange multipliers [Reference Jalon and Bayo20]:
 \begin{equation} \begin{bmatrix}{M} &&{\phi _q}^\top \\{\phi _q} &&{0} \end{bmatrix} \left [ \begin{array}{c} \ddot{q} \\ {\lambda } \end{array} \right ] = \left [ \begin{array}{c} \ Q \\ {c} \end{array} \right ] \end{equation}
2.1. POLIBOT digital twin
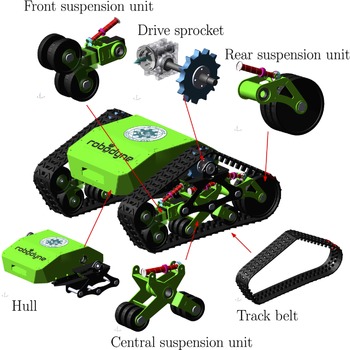
In this work, the multibody model of POLIBOT was built with a methodology based on templates, which is the standard design methodology of MSC Adams/ATV: the vehicle is considered as a set of interacting subsystems, and each subsystem is modeled independently and later integrated to form the assembly to simulate. Figure 2 shows the vehicle model that comprises six subsystems: the body, the drive sprocket, the suspension units (front, middle, and rear, each with one or two road wheels), and the track belt. The geometry of all the parts of the robot are imported into MSC Adams as Parasolid files extracted from 3D CAD elements. This strategy is preferred to using the elementary geometries provided by the ATV toolkit to improve fidelity.
The multibody model of POLIBOT.

The robot main body is represented by the subsystem hull, and its inertial properties are consistent with those of the real prototype. A hull property file provides the software with the coordinates of the lower and upper profiles of the body. To place the other subsystems (shown in Fig. 2) correctly in the final assembly with respect to the body, the hull template needs output communicators. The total mass of the tracked vehicle assembly and the position of the center of gravity are derived with static tests and compared against experimental data in Section 3.1. The powertrain engages with the track belts through shafts, gears, and sprockets on each side. A revolute joint connects each sprocket to the hull to achieve purely rotational relative motion about the drive axle. To impose motion, the user can provide to the powertrain subsystem either a prescribed angular velocity or torque.
Each of the four road wheels of the tracked vehicle is suspended to the robot chassis using a trailing arm suspension type. The templates of the central and front suspension units are generated especially to include features that are not available in the ATV default databases. The subsystem of the front suspension unit, shown on the top left corner of Fig. 2, is made up of four rigid bodies: two road wheels and two components that constitute the swing arm. The first part of the swing arm is attached to the robot body through a revolute joint, allowing it to rotate about the hinge point. This pivoting motion is resisted by the action of a spring-damper element designed to emulate the shock absorber used in the prototype between the chassis and the arm. The second rigid body forming the front trailing arm is connected to the first one through a translational joint that allows it to change the overall length of the arm and adjust the track belt tension to an optimal value for better traction performance, similar to the screw-nut tensioning unit of the actual robot. For this reason, the tensioner, which is an important entity of the ATV toolkit, is defined between the two sliding bodies that constitute the front trailing arm. The front suspension unit carries two road wheels that are connected via revolute joints to the terminal part of the swing arm.
The central suspension unit is shown at the bottom of Fig. 2. It comprises two swing arms that carry a road wheel each and that are connected to the hull through revolute joints. The relative rotation between the two swing arms is opposed by the action of another linear spring-damper force. In such way, when one wheel travels upward because of the terrain geometry, the other is pushed against the ground, with consequent high adaptability to uneven terrains and obstacles.
The POLIBOT prototype features rubber tracks reinforced with steel cables. In the model, based on the ATV toolkit design methodology, the single track is divided into 56 discrete segments, wrapped around the road wheels and the sprocket. Each one of these segments consists of a segment part and a box-shaped connector part that is linked to one another through a 6
 $\times$
6 force field element, modeled as a Timoshenko beam. The elastic and damping forces and torques at the segment interfaces, therefore, depend on the relative displacement and velocity of the local segment frames [Reference Madsen, Heyn and Negrut21], as well as on the coefficients in the stiffness and damping matrices; these are calculated by referring to the Young modulus and shear modulus of the rubber of which the track is made, that is,
 $E$
= 5.5 MPa and
 $G$
= 20 MPa, respectively, together with the dimensions of the cross section, namely 120 mm width and 9 mm height. A multiplier equal to 100 is applied to account for the stiffening along the longitudinal direction of the track due to the presence of the steel cables. The values obtained are summarized in Table I.
Properties of the rubber field used for the track segment connections.

As for the damping matrix, this is calculated as a fraction of the stiffness matrix. The damping coefficients reported in Table I correspond to a damping ratio equal to 0.01; such ratio is chosen by performing a drop simulation of the belt model alone and comparing its oscillations and final deformed shape with that of the real rubber track, as suggested in ref. [Reference Nicolini, Mocera and Soma22].
3. Model validation
The simulations to validate the multibody model and the comparison against experiments on the actual prototype are presented in this section. First, static tests are performed to evaluate the inertial properties of POLIBOT. Then, the dynamic response of the model in different tests is compared against the experimental data gathered in the field.
3.1. Static tests
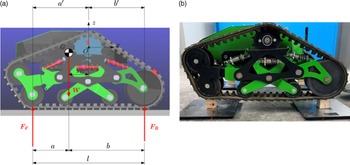
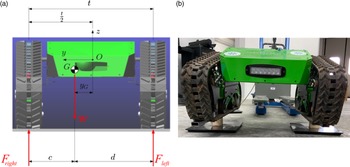
This section describes the procedure followed to identify the position of the center of gravity with respect to a reference system located at the center point of an imaginary line connecting the centers of the two sprockets, as indicated in Figs. 3 and 4.
Procedure for the determination of the x coordinate of the center of gravity: model (a) and real robot (b).

Procedure for the determination of the y coordinate of the center of gravity: model (a) and real robot (b).

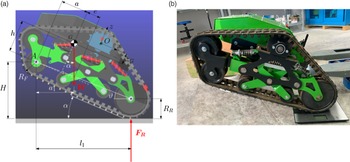
A first test is designed to estimate
 $x_G$
, which represents the x coordinate of the center of gravity, using the suspension and ground reaction method. Note that the procedure here described is usually applied to wheeled vehicles while being controversial for tracked vehicles, for which the ISO Standard 789-6 prescribes the use of decking and knife edges. The objective is to suspend the robot in such a way that only the four front and rear wheels are exchanging forces with the ground, to measure
 $F_F$
and
 $F_R$
, that indicate the fractions of the rover weight that loads the front and rear wheels, respectively, as shown in Fig. 3(a).
To achieve this result, after locking the suspension to avoid internal configuration variations, the rover is lifted onto two bars, with the front (left and right) wheels resting on the first bar and the rear wheels on the second one, to emulate the front and rear axle of a vehicle. Each bar is placed on a scale, and once
 $F_F$
and
 $F_R$
are known,
 $x_G$
can be estimated as follows:
 \begin{equation} x_G = b' - \frac{F_F\cdot l}{F_F + F_R} \end{equation}
where
 $W$
is the robot weight, and
 $b'$
and
 $l$
are geometric parameters as indicated in Fig. 3(a).
A similar procedure is implemented for the estimation of the y coordinate of the center of gravity,
 $y_G$
. The robot is settled onto two bars, but in this case, the bars are placed parallel and underneath each track, to measure
 $F_{\text{left}}$
and
 $F_{\text{right}}$
, that represent the fractions of the rover weight that loads the left and right tracks, respectively, as shown in Fig. 4(a). Each bar is placed on a scale, and once
 $F_{\text{left}}$
and
 $F_{\text{right}}$
are known,
 $y_G$
can be estimated as follows:
 \begin{equation} y_G = \left ( \frac{1}{2}- \frac{F_{\text{left}}}{F_{\text{left}} + F_{\text{right}}} \right ) t \end{equation}
where
 $t$
is the distance between the tracks, as shown in Fig. 4(a). A final procedure is designed to estimate
 $z_G$
, which represents the z coordinate of the center of gravity. With the suspension motion locked up, the robot front axle is jacked up so that the lower parts of the tracks are at an angle,
 $\alpha$
, with the horizontal. The rear wheels are positioned on scales, while the front axle is raised as shown in Fig. 5. Once the load on the rear wheels is measured,
 $z_G$
can be measured as follows:
 \begin{equation} z_G = R_F + \frac{\frac{F_r \cdot l_1}{\cos{\alpha }}-W\cdot a}{W \tan \alpha }-h_O \end{equation}
where
 $W$
is the rover weight previously measured,
 $F_R$
is the weight on the rear wheels with front elevated, and
 $h_O$
is the distance between the center of the sprocket and the bottom part of the track, while
 $a$
and
 $l_1$
are geometric parameters, as indicated in Fig. 5(a).
Procedure for the determination of the z coordinate of the center of gravity: model (a) and real robot (b).

The procedures described in this section have been applied to POLIBOT prototype, leading to the results shown in the second column of Table II. Also, the overall robot weight is 97 kg. The resulting y coordinate is not equal to 0, implying a slight asymmetry of the system with respect to the x–z plane. However, 8 mm correspond to only 1.3% of the distance between the tracks, and it could be justified with manufacturing tolerances and inaccuracy of the measurements of the scales.
Empirically estimated and simulated position of the center of gravity of POLIBOT.

Similar tests are now performed on the multibody model of POLIBOT as shown in Figs. 3(b), 4(b), and 5(b). Note that each subsystem has been designed to closely match the prototype counterpart in terms of geometry and materials. This modeling effort leads to the results shown in the third column of Table II. As expected, the simulated y coordinate of the center of gravity is zero, as the model is perfectly symmetric. The x and y coordinates differ by 7% and 1%, respectively, between the empirical and simulated values. The overall mass of the modeled rover is 97 kg, which exactly matches the actual weight of the prototype.
To complete the set of inertial properties, the multibody model is used to compute the mass inertia tensor. These values are not validated against experimental estimations because of the difficulty of measuring moments of inertia. However, as illustrated in Fig. 2, special care has been devoted to importing into MSC Adams the Parasolid files of the real CAD geometries and assigning them to the corresponding rigid parts of the different subsystems: this is not only for visualization purposes but also, most importantly, as a way to place the parts, together with their material and density, in the correct relative position between each other. Consequently, not only the model mass and position of the center of gravity are, as experimentally observed, close to those of the real prototype, but also the mass inertia tensor is expected to be by only a few percentage points separated from the true one. The simulated moments of inertia are shown in Table III.
Empirically estimated and simulated position of the center of gravity of POLIBOT.

The results presented in this section demonstrate that the inertial properties of the modeled robot are satisfactory, and the validation can move to the next phase with dynamic tests.
3.2. Dynamic tests
Field tests are conducted to validate the dynamics of the multibody model of POLIBOT. The prototype was fitted with a sensor frame that mounted GPS receivers, an IMU, and stereo cameras, as shown in Fig. 1. Sensory data are recorded and stored by the robot. During field tests, the robot was teleoperated to move across different types of surfaces. It is commanded by means of PWM signals that modulate the torque delivered by the two electric motors (one per each sprocket). The actual rotational speed of the motors is then measured during the tests with the use of encoders. The measured rotational speeds are finally provided as input to the multibody model for the simulation, while the rest of the data gathered is used for validation purposes. It should be noted that the virtual shock absorbers of the digital twin are set to replicate the exact properties of the real devices. Therefore, the linear stiffness coefficient is set to 12 N/mm, while the linear damping coefficient is equal to 0.8 Ns/mm. The preloads of the front, middle, and rear shock absorbers are, respectively, 180, 130, and 0 N.
3.2.1. Rigid strip track
The first surface considered for validation is a track of rigid strips, shown in Fig. 6. It was chosen to evaluate the vertical dynamic response of the robot. The simulation is run on a hard soil that matches the geometry of the actual strips, which are of different heights, ranging between 65 and 125 mm. The strips are 60 mm wide (in the direction of motion), and the space between two consecutive strips is 100 mm. Figure 6 describes the geometry of the first five strips. In the case of hard soil simulation, the forces that arise from the contact between the track segments and the soil are calculated according to a penalty-based method as:
 \begin{equation} F_n=K\cdot \delta ^e-\text{STEP}(0,0,\delta _{\text{max}},c_{\text{max}} )\cdot \dot{\delta } \end{equation}
where
 $K$
is the stiffness modeling the elasticity of the surfaces of contact,
 $\delta$
represents the penetration between the colliding bodies, and
 $e$
is a positive real value denoting the force exponent. The second addend of the right-hand side of Eq. (9) accounts for the dissipation of energy that is a function of penetration velocity
 $\dot{\delta }$
; the step function is defined as follows:
 \begin{equation} \text{STEP}(0,0,\delta _{\text{max}},c_{\text{max}} ) = \begin{cases} 0 & \text{if } \delta \leq 0 \\ c_{\text{max}}\left (\dfrac{\delta }{\delta _{\text{max}}} \right )^2\left ( 3-\dfrac{2\delta }{\delta _{\text{max}}} \right ) & \text{if } 0 \lt \delta \lt \delta _{\text{max}} \\ c_{\text{max}} & \text{if } \delta \geq \delta _{\text{max}} \end{cases} \end{equation}
and serves to smoothly ramp up the damping coefficient from zero, when the penetration is zero, to
 $c_{\text{max}}$
when the penetration reaches the boundary value
 $\delta _{\text{max}}$
, thus preventing the damping force from being discontinuous at the onset of the contact. A high stiffness
 $K$
for the contact between the track segments and the ground allows excessive interpenetration to be avoided between the road and the robot but at the same time can lead to integrator convergence issues. This parameter usually ranges from 200 N/mm up to
 $2.0\times 10^8$
N/mm: a value
 $K = 2.0\times 10^5$
N/mm is chosen as a satisfactory trade-off between accuracy and simulation time. It is advisable for the force exponent to be different from 1.0, preferably higher than 1.5:
 $e = 2.0$
is set to have a sufficiently smooth function that is with a continuous first-order derivative. The damping coefficient is assumed to be equal to one percent of the stiffness coefficient, that is,
 $c_{\text{max}} = 2.0\times 10^3$
Ns/mm, while the reasonable value
 $\delta _{\text{max}} =1$
mm is assumed for the penetration depth at which full damping is applied.
Track of strips used for dynamic validation of the model: detail of the first five strips with dimensions in millimeters.

For the tangential interaction between the track segments and the ground, a modified Coulomb friction model [Reference Vasileiou, Smyrli, Drogosis and Papadopoulos23] is adopted that requires to specify the static and the dynamic friction coefficients,
 $\mu _s$
and
 $\mu _d$
, together with the stiction and friction transition velocities,
 $v_s$
and
 $v_d$
. The static friction coefficient is set to 0.9, while the dynamic one is equal to 0.7. These values have been shown to minimize the error between experimental testing and numerical simulation, thus confirming the expected high adherence of the rubber track on dry concrete and asphalt on which the test campaign was conducted. To avoid integrator difficulties, the stiction transition velocity should preferably be higher than the integrator error used for the solution, while the friction transition velocity should be higher than five times the error. As reducing both parameters shows to have negligible impact on the results in the face of a considerable increase in computation effort, the default values
 $v_s$
= 0.1 m/s and
 $v_d$
= 0.5 m/s are adopted.
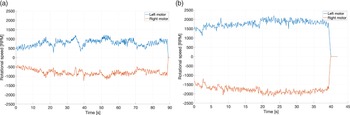
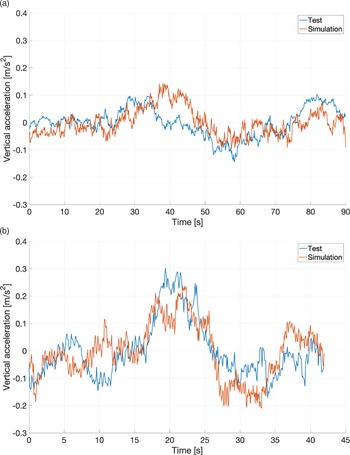
The results of the simulation are compared against the corresponding field test and discussed in this section. Figure 7 shows the angular velocities of the motors measured by the encoders, while POLIBOT was moving over the track of rigid strips. The test was repeated twice at two different speeds (0.1 and 0.2 m/s). The results are presented in terms of measured and simulated vertical acceleration in Fig. 8. It can be noted that the simulated vertical acceleration is qualitatively similar to the real one for both speeds. Quantitatively, the root mean square (RMS) of the simulated and experimental vertical accelerations is shown in Fig. 9. In the low-speed case, the simulated acceleration has an RMS of 0.049 m/s
 $^2$
, against a measured value of 0.052 m/s
 $^2$
, with an error of 5.7%. In the high-speed case, the RMS of the simulated vertical acceleration is 0.100 m/s
 $^2$
, while the measured value is 0.103 m/s
 $^2$
, with an error of only 3%.
Angular velocities measured by the encoders of the two motors, while POLIBOT is moving over the track of rigid strips at 0.1 m/s (a) and 0.2 m/s (b).

Vertical acceleration measured and simulated while POLIBOT is moving over the track of rigid strips at 0.1 m/s (a) and 0.2 m/s (b).

Comparison of root mean square of simulated and experimental vertical accelerations of POLIBOT while moving over the track of rigid strips.

3.2.2. Asphalt track
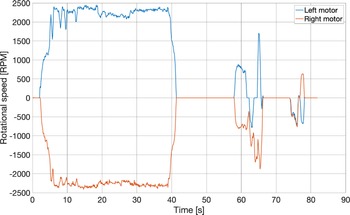
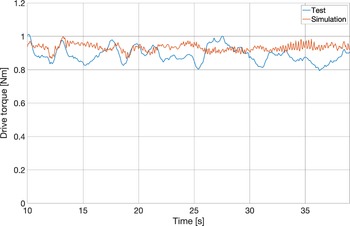
The second test considered for validation is a maneuver on asphalt. It should be noted that in practice, the motion primitives of POLIBOT are limited to straight-line driving and turn-on-the-spot steering. This choice was made considering the large amount of slippage incurred by the robot during steering that makes its control extremely difficult for general turning maneuvers. Therefore, the test maneuver consists of a straight-line movement followed by two 90-degree turns. Due to the nature of the terrain traversed, it was chosen to run the simulation of the model on flat, hard soil. Figure 10 shows the angular velocities of the motors measured by the encoders during the test. The POLIBOT prototype is not fitted with a load cell to measure the drive torque of the two motors. However, for validation purposes, the sum of the two driving torques during the straight-line maneuver is estimated from the measured overall battery drain current as follows:
 \begin{equation} T_{\text{sum}} = \eta \frac{C \cdot V}{\omega _{\text{mean}}} \end{equation}
where
 $C$
is the measured overall battery drain current,
 $V$
is the battery voltage,
 $\omega _{\text{mean}}$
is the average between left and right motor speeds, and
 $\eta$
is the average motor efficiency provided by the manufacturer. This estimated overall torque is compared against the sum of the simulated right and left motor torques in Fig. 11, showing good agreement with an RMS error of 0.0684 Nm and an RMS percentage error of 8.02%.
Angular velocities measured by the encoders of the two motors while POLIBOT is moving on asphalt.

Comparison between estimated and simulated overall motor torque during straight line.

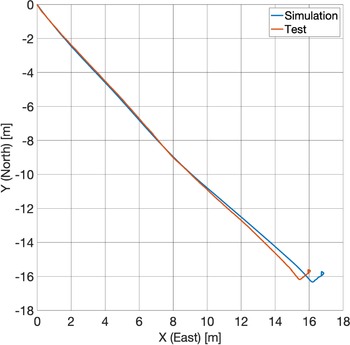
The corresponding trajectory, as measured by the GPS, is shown by the red line in Fig. 12, and it is compared against the simulated trajectory, in blue. The initial absolute heading is measured by the IMU, and it is also provided as input to the model. The overall distance covered by the robot during the test on asphalt, taken from the origin of the frame of Fig. 12, is
 $d_{\text{mea}}$
= 23.88 m. The percentage deviation of the simulation from the measured data, in terms of final position, is calculated as:
 \begin{equation} E = 100 \frac{d}{d_{\text{mea}}} \end{equation}
where
 $d$
is the distance between the final position of the real and the simulated path. Similarly, the following metric is adopted to evaluate the average local position relative percentage error between the real and the simulated robot:
 \begin{equation} E_p = 100\sqrt{\frac{1}{n_t}\sum _{k=1}^{n_t}\frac{|r_{\text{mea},k}-r_{\text{sim},k}|^2}{|r_{\text{mea},k}|^2}} \end{equation}
where
 $r_{\text{mea},k}$
is the measured position vector at time step
 $k$
,
 $r_{\text{sim},k}$
is the simulated position vector at time step
 $k$
,
 $n_t$
is the number of time steps, and
 $|\cdot |$
represents the magnitude of the corresponding vector.
Comparison between measured and simulated path followed by the robot during the validation test on asphalt.

The final metric considered for validation is the RMS error of the simulation from the measured data in terms of absolute heading of the robot, calculated as:
 \begin{equation} E_{\psi } = \sqrt{\frac{1}{n_t}\sum _{k=1}^{n_t}{\left ( \psi _{\text{mea},k}-\psi _{\text{sim},k} \right ) ^2}} \end{equation}
where
 $\psi _{\text{mea}, k}$
is
 $k$
-th absolute heading angle measured by the real robot and
 $\psi _{\text{sim}, k}$
is the corresponding simulated value. The resulting value for the final position deviation is
 $E$
= 3.25%, while the average local position relative error is
 $E_p$
= 6.23%. The heading deviation is
 $E_{\psi }$
= 2.30
 $^\circ$
.
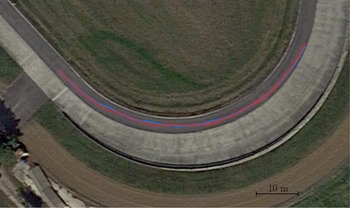
Finally, a curved path on asphalt is considered where POLIBOT is commanded to follow a circular path of 30 m radius with a travel speed of about 0.65 m/s. The experimental path as obtained from the GPS is overlaid over the Google map of the test track in Fig. 13 as a dashed red line. Again, the experimental angular speed of the two drive sprockets is used as input to the multibody model. The corresponding simulated path is marked with a solid blue line. As seen from this figure, the experimental and virtual paths are in good agreement with an average local position relative error and heading RMS error, respectively, of
 $E_p= 7.41\%$
over 65 m of total travel distance and
 $E_{\psi }= 5.66^{\circ }$
.
Comparison between measured (dashed red line) and simulated path (solid blue line) followed by the robot during the validation test on a curved path. GPS coordinates of the test site (DMS format): 44
 $^{\circ }$
57’ 24.5988” N, 7
 $^{\circ }$
33’ 25.956” E).

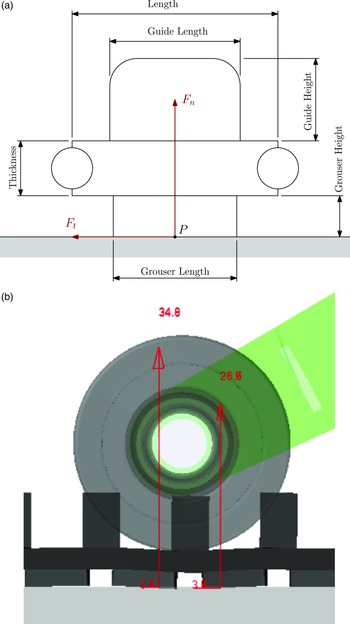
As a final remark, Fig. 14 clarifies how the contact forces are estimated in the MB model. For a given integration step, forces are calculated at each contact point. Individual contributions distributed over the contact area are then summed up to compute the net normal and tangential force originated by the contact event, as shown in Fig. 14.
Contact forces between track belt elements and ground: (a) schematic of a single-track belt segment and (b) calculation example of contact forces (expressed in N) under the left bogie wheel.

The results presented in this section demonstrate that the behavior of POLIBOT can be replicated by the multibody model with a good level of accuracy. This terminates the validation phase of the model, which can now be used to simulate challenging scenarios, avoiding wear of the real POLIBOT and costly and time-consuming field experiments.
4. Simulation of highly challenging environments
In this section, the validated multibody model is used to simulate four challenging environments and to test the effectiveness of the innovative suspension of POLIBOT. In the challenging scenarios shown in Table IV, the robot will try to negotiate a sinusoidal bump (Section 4.1), overcome a ditch (Section 4.2), fall from a step (Section 4.3), and traverse uneven terrain (Section 4.4)
Environments considered for testing the multibody model.

Each environment is simulated in half-vehicle mode to take advantage of the longitudinal symmetry and reduce the computational time.
For each scenario, the simulation is repeated in two conditions: one in which the robot is not suspended and the road wheels are fixed with respect to the chassis (locked suspension case), and the second, in contrast, with the passive suspension regularly in operation. To make a fair comparison between the two cases of activated and deactivated suspension, the dynamic simulations are preceded by a static analysis to evaluate the tensioner setup length that achieves an initial track tension of 150 N, which is considered optimal for traction and similar to the real initial track tension of the prototype.
4.1. Sinusoidal bump
It is simulated the negotiation of a sinusoidal bump whose profile is defined as:
 \begin{equation} z(x)=\frac{H}{2}\left [1+\text{cos}\left (2\pi \frac{x-x_0}{W}\right )\right ] \end{equation}
where
 $H$
= 35 mm and
 $W$
= 70 mm refer, respectively, to the width and height of the obstacle, and
 $x_O$
locates the position of the center of the obstruction along the direction of travel
 $x$
. The 3D geometry of the bump is provided to the software through a road data file (.rdf) that contains the points and nodes of the road profile (see Fig. 15).
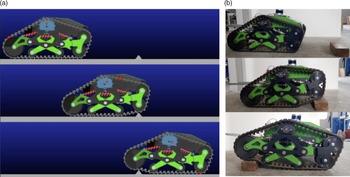
Bump negotiation: (a) simulated POLIBOT and (b) real prototype.

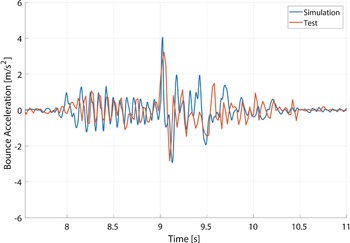
As an initial test, the results obtained from the real robot and the multibody model are compared as shown in Fig. 16 considering a constant speed of 0.25 m/s. The agreement of the two curves is fairly good. When looking at the acceleration RMS values, the relative error results of 4.9%, further attesting to the validation of the digital twin.
Comparison between measured and simulated bounce response for the bump negotiation test with a travel speed of 0.25 m/s.

Afterward, a simulation is performed with the vehicle that moves at a constant velocity of 0.55 m/s, corresponding to an imposed angular velocity to the sprocket of 376 deg/s. The simulation starts with the robot and the obstacle separated by 900 mm of flat road; the impact happens after about 1.5 s and the vehicle starts its climb.
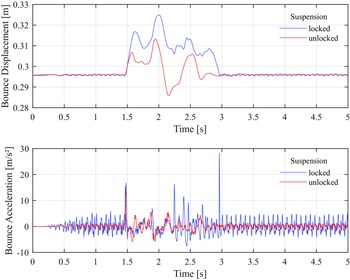
Figure 17 depicts the displacement and acceleration of the hull in the bounce (vertical) direction for the unlocked and locked cases. In Table V, it can be clearly seen that, when the suspension is locked, the vehicle experiences higher bounce vibrations, as highlighted by the acceleration RMS values of 2.67 and 1.36 m/s
 $^2$
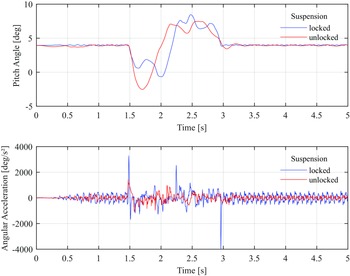
for the configurations with locked and active suspension, respectively. In Fig. 18, the pitch motion is analyzed, from which we see that the chassis experiences significantly reduced angular acceleration when the suspension system is unlocked; the peak-to-peak and RMS values are 2.52E + 03 deg/s
 $^2$
and 211.80 deg/s
 $^2$
, respectively, as opposed to 7.27E + 03 deg/s
 $^2$
and 385.73 deg/s
 $^2$
obtained from the ride simulation with locked suspension (see Table V).
Results obtained from the bump negotiation simulation: (top) bounce displacement and (bottom) bounce acceleration.

Results obtained from the bump negotiation simulation.

AA = angular acceleration; AV = angular velocity; BA = bounce acceleration; BV = bounce velocity.
Results obtained from the bump negotiation simulation: (top) pitch angle and (bottom) angular acceleration.

4.2. Ditch
In this section, a negative obstacle (i.e., a ditch) is considered. The geometry of the ditch is shown in Fig. 19. The height of the ditch is chosen to match the radius of the first road wheel, while its length is shorter than the longitudinal wheelbase of the robot. In this way, the robot must start climbing out of the ditch, while the last road wheel is still on top of the first edge. In the simulated scenario, the robot is moving from left to right with a speed of 0.1 m/s.
Geometry of the ditch with dimension in millimeters.

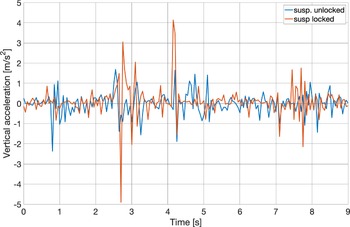
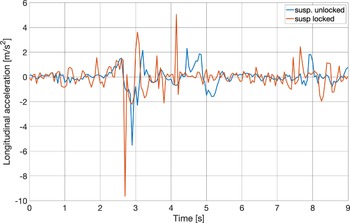
The results of the simulation are shown in Figs. 20 and 21 in terms of vertical and longitudinal acceleration, respectively. Although the accelerations show a similar pattern in both cases of unlocked and locked suspension, the locked case presents bigger spikes, which reflect on the peak-to-peak RMS values, as shown in Table VI. When the suspension is active, the peak-to-peak value of the vertical acceleration is 55% lower than the locked case (4.055 against 9.040 m/s
 $^2$
), while the RMS is 30% lower (0.559 against 0.799 m/s
 $^2$
). Similarly, the peak-to-peak value of the longitudinal acceleration is 47% lower (7.830 against 14.690 m/s
 $^2$
), while the is 32% lower (0.772 against 1.137 m/s
 $^2$
).
Vertical acceleration and negotiation of a ditch.

Longitudinal acceleration and negotiation of a ditch.

Results obtained from the ditch negotiation simulation.

LA = longitudinal acceleration; VA = vertical acceleration.
4.3. Falling from a step
The scenario considered in this subsection is a fall from a step. The geometry of the step is shown in Fig. 22. The height of the step is chosen to match the diameter of the first road wheel. In the simulation, the robot is moving from left to right with a speed of 0.5 m/s.
Geometry of the step with dimension in millimeters.

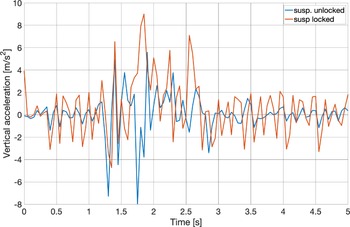
The results of the simulation are shown in Fig. 23, in terms of vertical acceleration, and in Table VII, in terms of peak-to-peak and RMS values. When the suspension is active, the peak-to-peak value of the vertical acceleration is 25% lower than the locked case (8.294 against 11.074 m/s
 $^2$
), while the RMS is 32% lower (1.756 against 2.600 m/s
 $^2$
).
Results obtained from the step simulation.

VA = vertical acceleration.
Vertical acceleration and falling from a step.

4.4. Stochastic uneven
The last scenario considered for testing the multibody model is the negotiation of a stochastic uneven surface modeled according to International Organization for Standardization [24] as an ISO F-profile, corresponding to a very poor surface profile with an RMS of 0.0383 m [Reference Reina, Leanza and Messina25]. The surface is shown in Fig. 24. In the simulation, the robot moves from left to right with a speed of 0.5 m/s.
Representation of the stochastic uneven surface, ISO F-profile.

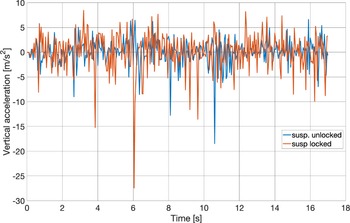
The results of the simulation are shown in Fig. 25 in terms of vertical acceleration and in Table VIII in terms of peak-to-peak and RMS values. When the suspension is active, the peak-to-peak value of the vertical acceleration is 16% lower than the locked case (30.166 against 35.901 m/s
 $^2$
), while the RMS is 30% lower (2.609 against 3.753 m/s
 $^2$
).
Results obtained from the stochastic uneven simulation.

VA = vertical acceleration.
Vertical acceleration and stochastic uneven ISO F-profile.

5. Conclusions
This paper presented the multibody model of the tracked robot POLIBOT. The performance of the suspension in various challenging scenarios was evaluated with both active and locked modes. The multibody model was designed using MSC Adams and its ATV toolkit. Specific templates were developed for the middle and front units of the innovative passive suspension implemented on the prototype of POLIBOT. The simulation results proved that the suspension system is capable to mitigate the vibrations of the chassis in response to various surfaces. In case of bump negotiation, the RMS value of the bounce (vertical) acceleration and pitch acceleration are reduced by 49% and 45%, respectively. While overcoming a ditch, the RMS of the vertical acceleration and longitudinal acceleration are reduced by 30% and 32%, respectively. In the case of the robot falling from a step, the RMS of the vertical acceleration is 32% lower than in the locked suspension case. Finally, also for the test on the irregular surface with an ISO F-profile, the suspension performs well, with a reduction of 30% in the RMS of vertical acceleration. Experimental tests and simulations have been performed on hard terrain. This is one limitation of the proposed research. Future efforts will be devoted to extend the analysis to deformable and loose soils drawing on Terramechanics theory. As additional developments, the authors will focus on the fine-tuning of the model parameters, with the objective to replicate more closely the data gathered from the real prototype during tests in the field and in the laboratory. In addition, an investigation of novel suspension architectures can be carried out thanks to the novel multibody model.
Author contributions
All authors have contributed equally to this work.
Financial support
The financial support of the projects: Agricultural Interoperability and Analysis System, H2020 (Grant No. 857125), and giving Smell sense To Agricultural Robotics, ERA-NET COFUND ICT AGRI-FOOD (Grant No. 45207), is gratefully acknowledged.
Competing interests
The authors declare no competing interest exist.
Ethical approval
Not applicable.
Acknowledgments
The authors are grateful to Daniele Catelani of MSC Software for all the help and suggestions in modeling multibody systems with MSC Adams software. The Institute of Sciences and Technologies for Sustainable Energy and Mobility (STEMS) – National Research Council of Italy (CNR) is also gratefully acknowledged for the experimental validation of POLIBOT, part of which was performed at the Candiolo test track.