INTRODUCTION
The bambara groundnut (Vigna subterranea) is an indigenous African grain legume crop that is currently gaining recognition for its important socio-economic role, especially in semi-arid Africa. It is suited to low input farming systems, and constitutes not only a significant source of protein but also provides a supplementary income for the many subsistence female farmers who grow the bulk of the crop (Hampson et al. Reference Hampson, Azam-Ali, Sesay, Mukwaya and Azam-Ali2000; Linnemann and Azam-Ali, Reference Linnemann, Azam-Ali and Williams1993; Sesay et al. Reference Sesay, Kunene and Earnshaw1999). Bambara groundnut landraces have been shown to yield well both in field plots (Johnson Reference Johnson1968, Sesay et al. Reference Sesay, Edje and Magagula2004) and in controlled environments. For example, Collinson et al. (Reference Collinson, Azam-Ali, Chavula and Hodson1996) reported pod yields of up to 4.1 t ha−1 in experimental glasshouses in the UK, and Sesay et al. (Reference Sesay, Edje and Magagula2004) obtained seed yields of 2.6 t ha−1 in field trials in Swaziland. However, observations in Swaziland (Sesay et al. Reference Sesay, Kunene and Earnshaw1999) and elsewhere (Linnemann and Azam-Ali, Reference Linnemann, Azam-Ali and Williams1993) suggest that bambara groundnut production by subsistence farmers is characterized by low and unpredictable yields. There is a general lack of field experimental evidence on which to base reliable extension recommendations or to aid research planning. Harris and Azam-Ali (Reference Harris and Azam-Ali1993) ascribed the low yields to year-to-year variations in planting dates. For example, in Swaziland bambara groundnut is usually grown as a secondary food crop and is often planted after the staple food crop, maize, and other cash crops have been sown. Thus, for a given farmer, time of planting varies from year to year, ranging from October to January (Sesay et al. Reference Sesay, Kunene and Earnshaw1999). Within this wide range of planting dates environmental factors, such as daylength, temperature and rainfall may change markedly, thus variously limiting the time available for growth, reproductive development and yield formation.
Studies in controlled environments (Brink, Reference Brink1997, Reference Brink1999; Linnemann, Reference Linnemann1991, Reference Linnemann1993) and the field environment (Harris and Azam-Ali, Reference Harris and Azam-Ali1993) have established the central roles of daylength and temperature in the control of reproductive development in bambara groundnut. Furthermore, as it is grown widely in regions where both protracted and/or terminal drought stress are common, its growth and yield are likely also to be limited by water availability. Notwithstanding the reported favourable drought-tolerance status of the crop (Babiker, Reference Babiker1989), its productivity has been shown to be adversely affected by soil moisture stress (Azam-Ali et al. Reference Azam-Ali, Sesay, Karikari, Massawe, Aguilar-Manjarrez, Bannayan and Hampson2001; Collinson et al. Reference Collinson, Azam-Ali, Chavula and Hodson1996, Reference Collinson, Sibuga, Tarimo and Azam-Ali2000).
Thus the objective of this study was to determine the influence of sowing date and the associated variation in environmental factors on the development and yield of bambara groundnut in a sub-tropical region.
MATERIALS AND METHODS
Field experiments were conducted in the 1998/99 and 1999/2000 cropping seasons at the Department of Crop Production Research Farm at the Luyengo campus of the University of Swaziland. Luyengo is located in the Middleveld agro-ecological region of Swaziland (26°41′S, 31°12′E, 750 m asl). The Middleveld is the major agro-ecological region for bambara groundnut cultivation in Swaziland (Sesay et al. Reference Sesay, Kunene and Earnshaw1999). The soil at the experimental site is the Malkerns series deep red loam (Murdoch and Baillie, Reference Murdoch and Baillie1966).
In the 1998/99 experiment six sowing dates, 15 September, 15 October, 16 November and 15 December 1998, and 15 January and 16 February, 1999, were compared in a randomized complete block design with four replications in order to determine the influence of sowing date on the growth, development and yield of a local bambara groundnut landrace with maroon-coloured seeds. This landrace was subsequently named Uniswa red. The choice of sowing dates was based on the results of an earlier survey, which had shown that in Swaziland time of sowing for bambara groundnut varies from year to year, and for a given farmer it could range from October to January (Sesay et al. Reference Sesay, Kunene and Earnshaw1999). Each plot comprised six rows, 0.6 m apart and 6 m long with 0.15 m between plants. Two seeds were sown per station, and the seedlings were thinned to the desired population (11 plants m−2) at 26 days after sowing (DAS). Plots were weeded by hand, as necessary, but no pesticides or fertilizer were applied, simulating a farmer's situation (Sesay et al. Reference Sesay, Kunene and Earnshaw1999). Earthing-up was done after 100% flowering. The crop was rain-fed and no supplementary irrigation was given. Seedling emergence (first true leaf visible) counts were made along two entire rows per plot, marked immediately after sowing. Emerged seedlings were counted until 26 DAS. Twelve randomly selected plants were tagged at emergence for developmental measurements. The number of days to flowering was recorded as the date each of the tagged plants had at least one open flower. The date of 50% flowering was determined from the daily observations. The total number of leaves (three leaflets fully expanded) for each of the 12 tagged plants was recorded twice weekly (every three and four days) from thinning until maturity. Plant height and canopy width were determined by averaging the distance from the ground level to the top of the plant canopy and the widest length across the row, respectively, at three spots in each plot at 85 DAS. Total dry matter production was determined at maturity from a sample of five plants per plot. Plants were oven dried at 80 °C for 48 h before weighing. For pod yield, plants were harvested from an undisturbed net plot area of 4.8 m2 at maturity. The number of plants harvested was recorded for each plot, and the number of pods per plant was determined from a sample of five randomly selected harvested plants per plot. Pods were air-dried and weighed. Pods were then shelled and the 100-seed mass was determined on 100 random seeds per plot
In 1999/2000 two local landraces were planted on six different dates. The experimental design was a single split plot with the six sowing dates in the main plots and the two landraces in the subplots, replicated four times. The sowing dates were: 13 October, 3 November, 24 November and 15 December 1999, and 5 January and 26 January 2000. The landraces were Uniswa red and a cream-seeded local landrace. All cultural practices were the same as in 1998/99, except that a basal application of P in the form of single superphosphate (11 kg ha−1) was made at planting. Each plot was divided into two 3-m sections, with one section used as the sampling area and the other as harvest area. Seedling emergence and flowering were recorded as in 1998/99. Starting 10 days after 50% flowering and at five-day intervals, five plants per plot were dug up to determine the onset of podding. Yield and yield components were recorded as in 1998/99. Harvest index was computed, from a sample of five plants per plot at maturity, as the proportion of seed weight to total above-ground dry matter. In both seasons, maturity was estimated from visual observations of the onset of senescence characterized by the yellowing of leaves.
Environmental factors
Meteorological data were kindly provided by the National Meteorological Services, Ministry of Public Works and Transport (Swaziland). Means were calculated from daily values. For each sowing date, mean daylength and mean daily maximum, mean and minimum air temperatures were calculated for the following phenophases: sowing to 50% flowering, flowering to 50% podding (1999/2000 season) and flowering to maturity (reproductive period).
The duration of each of these phases was measured in calendar days and in thermal time (°C d) which was calculated by subtracting the base temperature (10 °C) (Collinson et al. Reference Collinson, Azam-Ali, Chavula and Hodson1996; Harris and Azam-Ali, Reference Harris and Azam-Ali1993) from the mean daily temperature and summing for the particular developmental stage. Also, the rate of development during these phases was calculated as 1/d, where d is the duration, in days, of each respective developmental phase. Linear and multiple regression analyses were used to relate rate of development and yield to the respective environmental factors.
In the 1999/2000 experiment, soil moisture was determined at each planting date and weekly thereafter, at 0–15 cm depth using the gravimetric method, calculated in g g−1 oven-dry soil. The soil moisture obtained at each week's sampling was regarded as the amount carried over from the previous period. These weekly soil moisture data were summed from planting to 50% flowering and planting to 50% podding for each sowing date treatment. Also, total rainfall (obtained from daily rainfall records), from planting to 50% flowering and 50% podding, was determined. This gave the amount of rain that was available to each crop during its cycle. Weekly averages were also determined. Linear regression equations and correlation coefficients of pod yield on rainfall and soil moisture were used to study the relations between rainfall, soil moisture and yield at the two growth stages.
Statistical analyses
Data obtained from each cropping season were analysed separately. Analysis of variance, correlations, regression analysis and other statistical procedures were performed on the data using STATISTIX 8 for windows (Analytical Software, Tallahassee, Florida. USA). The effect of sowing date on final percentage emergence was tested after transformation of the data to the square root scale. Covariance analysis was applied to the yield data, using the number of plants harvested as the covariate. Associations among characters were examined by simple correlation analysis.
RESULTS
Environmental factors
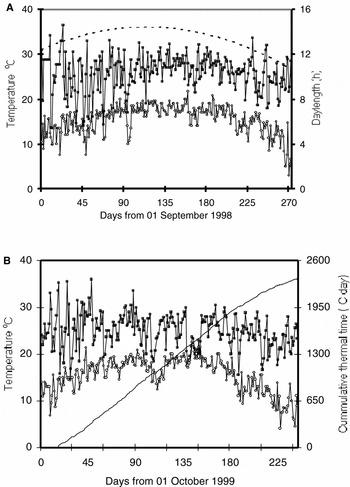
Temperature, daylength and rainfall changes during the study period are shown in Figures 1 and 2. In the 1998/99 growing season average monthly maximum and minimum air temperatures ranged from 23.2 °C in October 1998 to 27.9 °C in January 1999, and from 17.9 °C in January 1999 to 10.7 °C in May 1999, respectively. The corresponding values for the 1999/2000 season were 26.5 °C in December 1999 to 22.7 °C in May 2000, and 19.4 °C in February 2000 to 9.5 °C in May 2000, respectively. Clearly, there was a reduction in air temperature late in both seasons (Figure 1). In addition, minimum temperatures were low early in the season (September and October in 1998/99, and October in 1999/2000), ranging between 4.5 and 13.8 °C. Thus the rate of accumulation of thermal time over the growing season was slow early in the season, and much more so during the latter part of the season (Figure 1). Daylength varied between 14.7 h (in December) and 11.3 h at the end of the growing season (in May).
Variation in environmental factors at Luyengo, Swaziland, over two growing seasons: daily maximum (■) and minimum (o) temperature, daylength (- - -) and accumulated thermal time using a base temperature of 10°C (—).

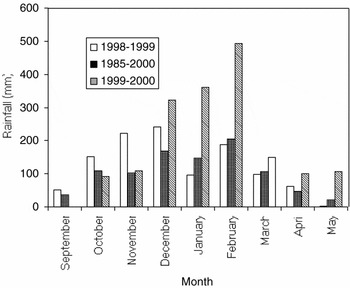
There was a substantial difference in rainfall intensity and distribution between the two seasons. The total rainfall received during the 1999/2000 growing season was 1748 mm, 636 mm (57%) higher than the total rainfall for the 1998/99 season and 805 mm (85%) greater than the long-term average (Figure 2). In 1999/2000, plants were subjected to rainfall of high intensity and consequently to varying periods of flooding at different developmental stages. Rainfall distribution was closer to normal in 1998/99 than in 1999/2000.
Variation in monthly rainfall during the 1998/99 and 1999/2000 growing seasons and the long term average at Luyengo, Swaziland.

Seedling emergence
Although the rate of seedling emergence varied both within and between seasons (data not shown), final seedling emergence, calculated from square root transformation of the final percentage emergence (number of seedlings emerged within the recording period/number of seeds sown × 100) was not significantly affected by sowing date in either experiment. The figures, expressed in the transformed scale, ranged from 9.2 to 9.4 (mean = 9.3, s.e. = 0.12, n = 24) in 1998/99, and 8.4 to 8.9 (mean = 8.7, s.e. = 0.12, n = 48) in 1999/2000. The back-transformed means were: 87% and 76% for 1998/99 and 1999/2000, respectively. The lower final seedling emergence in 1999/2000 was attributable to the effects of excessive moisture during germination, caused by the heavy rainfall, on the seeds of the cream-seeded landraces. A relationship between flooding tolerance and seed coat colour has been reported in a number of crop species (Hou and Thseng, Reference Hou and Thseng1991), with light-coloured seeds exhibiting low tolerance.
Phenological development
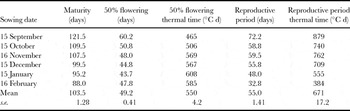
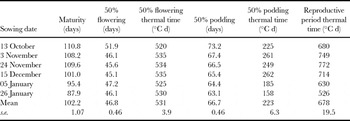
Sowing date significantly (p < 0.01) influenced crop development, expressed in either calendar days or thermal time (Tables 1 and 2). The number of days from sowing to maturity declined significantly (p < 0.01) with delays in sowing, ranging from 121.5 for September sowing to 88 for February sowing in 1998/99, and from 111 for October sowing to 88 for 26 January sowing in 1999/2000. The duration from sowing to 50% flowering in both seasons, and from sowing to podding (the onset of pod growth) in 1999/2000, also varied with delay in sowing date. However, the reduction in crop duration occurred predominantly post-flowering. There was a consistent and highly significant (p < 0.01) reduction in the length of the reproductive period with delay in sowing after November (Tables 1 and 2).
Phenological development of bambara groundnut sown at six dates at Luyengo, Swaziland, 1998/99 cropping season.

Phenological development of bambara groundnut sown at six dates at Luyengo, Swaziland, 1999/2000 cropping season.

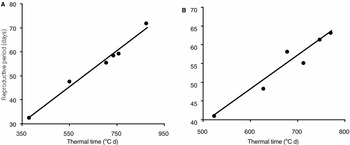
Crop duration in terms of thermal time for the three phenological phases (sowing to flowering, flowering to podding, reproductive phase) is also presented in Tables 1 and 2. The mean thermal times required for the sowing to flowering phase and for the reproductive phase, across sowing dates, in 1998/99 were 550 and 671 °C d, respectively. In 1999/2000 the sowing to flowering, flowering to podding and reproductive phases had mean thermal times of 531, 223 and 678 °C d, respectively. The most variable phase was the reproductive period in both seasons, followed by the flowering to podding period in 1999/2000. Thermal times for the reproductive periods ranged from 384 °C d (February sowing) to 879 °C d (September sowing) in 1998/99, and from 526 °C d (26 January sowing) to 772 °C d (24 November sowing), in 1999/2000. However, in both seasons there was a consistent and significant (p < 0.01) decline in thermal time with delay in sowing after November. This strongly influenced the duration of the reproductive period in 1998/99 as well as in 1999/2000 (Figure 3).
Relationship between reproductive period and thermal time accumulated during the reproductive period for bambara groundnut, in Swaziland, A 1998/99; B. 1999/2000. Equations of fitted lines: A: y = 4.3341 + 0.0748 (s.e. = 0.003) x, r 2 = 0.98, p < 0.01; B: y = −6.0994 + 0.0905 (s.e. = 0.0116)x, r 2 = 0.94, p < 0.01.

Development rates
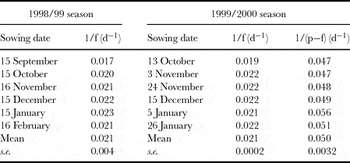
The rate of progress towards flowering (1/f, where f = number of days from sowing to 50% flowering) and from flowering to podding (1/(p–f), where (p–f) = number of days from 50% flowering to 50% podding) varied significantly (p < 0.01) with sowing date (Table 3). The rate of progress from sowing to flowering varied from 0.017 to 0.023 d−1, and from 0.019 to 0.022 d−1 in 1998/99 and 1999/2000, respectively.
Influence of sowing date on rates (1/day) of progress from sowing to flowering (1/f) with f being the number of days from sowing to 50% flowering) (1998/99 and 1999/2000 cropping seasons) and from flowering to podding (1/(p−f)) with (p−f) being the number of days from 50% flowering to 50% podding (1999/2000 season) for bambara groundnut grown at different dates at Luyengo, Swaziland.

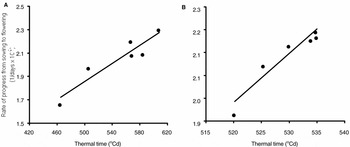
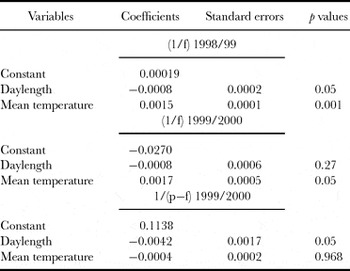
A highly significant and linear relationship was observed between the rate of progress towards flowering and mean daily temperature (y = 0.0019 + 0.0015 (s.e. = 0.00011)x, r 2 = 0.88, p < 0.01), increasing with increases in the mean air temperature, or decreasing with delays in sowing (data not shown). However, a similar, but even stronger relationship was observed between thermal time and rate of development from sowing to flowering (Figure 4). Furthermore, the standard partial regression coefficients for mean air temperature (derived from regression analysis to determine the relative contribution of temperature and daylength in explaining the variation in rates of development to flowering) were substantially higher than those for daylength for both seasons (Table 4). The standard errors of the regression coefficients were large, probably suggesting that the sampling errors involved in estimating the occurrence of phenological stages were large relative to the actual variation.
Relationship between rate of progress from sowing to flowering and thermal time, A: 1998/99, B: 1999/2000. Equations of fitted lines: A. y = −0.0764 + 0.0039 (s.e. = 0.007) x, r 2 = 0.88, p < 0.01; B. y = −6.9743 + 0.0172 (s.e. = 0.0003) x, r 2 = 0.91, p < 0.01.

Standard partial regression coefficients for regression of rates of progress from sowing to flowering (1/f) and rate of progress from flowering to podding (1/p−f) on mean temperature and mean daylength for bambara groundnut grown at different dates at Luyengo, Swaziland, 1998/99 and 1999/2000 cropping seasons.

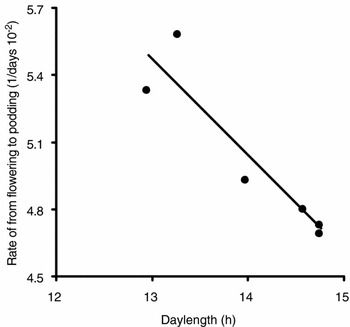
On the other hand, the rate of development from flowering to podding in 1999/2000 tended to increase with delay in sowing, ranging from 0.047 d−1 (13 October and 3 November sowings) to 0.056 d−1 (5 January sowing). Daylength had a significant and linear relationship with the rate of progress from flowering to podding (Figure 5). The rate decreased with increase in daylength from 12 to 15 h, or increased with delay in sowing, suggesting that the onset of podding was daylength-sensitive. Also, the standard partial regression coefficient for daylength was substantially higher than that for temperature (Table 4).
Relationship between rate of progress from flowering to podding and daylength between flowering and podding, for bambara groundnut in Swaziland, 1999/2000 cropping season. Equation of fitted line: y = 11.063 – 0.4298 (s.e. = 0.086) x, r 2 = 0.86, p < 0.01.

Morphological development
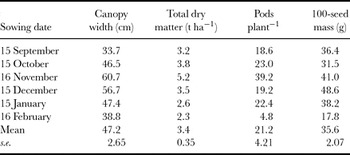
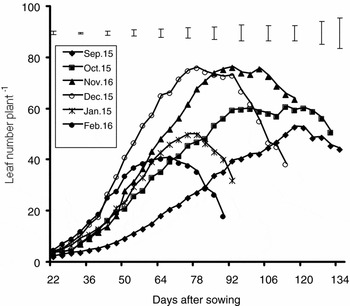
Varying the time of sowing had additional consequences. Plant size, as represented by canopy width (Table 5) and leaf number per plant (Figure 6), was also significantly influenced by sowing date, and the differences corresponded with the variations in pod yield and dry matter production. Maximum leaf number per plant ranged from 41 for February sowing to 77 for November sowing, with a mean of 60 (s.e. = 7.3) in 1998/99. Figure 6 shows that the mean number of fully expanded leaves per plant followed a sigmoidal plot against time after sowing for all treatments.
Growth and yield parameters of bambara groundnut sown at six dates at Luyengo, Swaziland, 1998/99 cropping season.

Cumulative leaf number per plant against days after sowing for a bambara groundnut landrace sown at six dates at Luyengo, Swaziland, 1998/99. Vertical bars denote standard error of the mean.

Yield, dry matter production and yield components
The responses of the two landraces in the 1999/2000 cropping season were essentially similar; we therefore present only data relating to the main treatment effects.
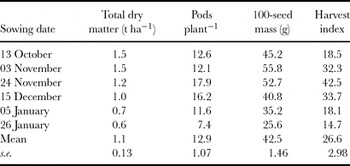
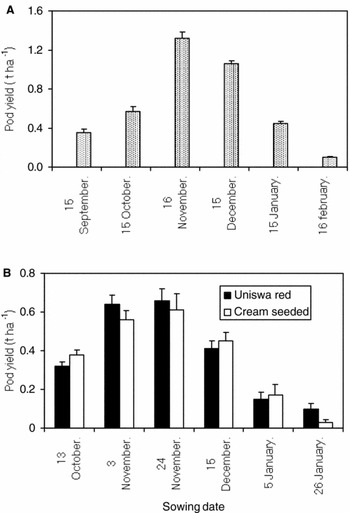
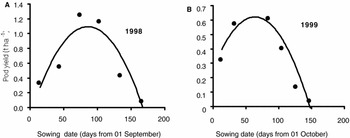
Sowing date significantly (p < 0.01) influenced pod yield and dry matter production in both experiments, and for both landraces used in the study (Figure 7; Tables 5 and 6). The maximum pod and dry matter yields were obtained with November sowing. Sowing as early as September, or as late as mid-January, reduced pod yield by 72–75%. The response of pod yield to sowing date was well described by the relationships shown in Figure 8.
Growth and yield parameters of bambara groundnut sown at six dates at Luyengo, Swaziland, 1999/2000 cropping season.

Pod yield of bambara groundnut sown at six dates at Luyengo, Swaziland, (A) 1998/99 and (B) 1999/2000. Bars indicate standard error of the mean.

Influence of sowing date on pod yield of bambara groundnut in Swaziland: A, 1998/99; and B, 1999/2000. Equations of fitted lines: A: y = −0.111 + 0.0281 (s.e. = 0.0084) x – 0.000164 (s.e. = 0.00004) x 2; r 2 = 0.82, p < 0.05. B: y = 0.265 + 0.0112 (s.e. = 0.0035) x – 0.000088 (s.e. = 0.000022) x 2, r 2 = 0.90, p < 0.05; where y is pod yield in t ha−1, and x the number of days after 01 September for 1998/99 and after 01 October for 1999/2000.

Pod yields and total above-ground dry matter production were substantially greater in 1998/99 than in 1999/2000 (Figure 7, Tables 5 and 6). This largely reflects the unfavourable growing conditions caused by the heavy rainfall and the non-application of pesticides to control insects and diseases in 1999/2000. Although scoring for disease incidence was not carried out a number of diseases were noted. The most serious was Ascochyta spot and blight, caused by Phoma exigua var. exigua. This disease caused chlorosis followed by blighting of the leaves.
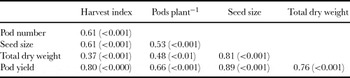
The differences in pod yield between sowing dates corresponded to differences in the number of pods per plant, seed size and harvest index, each of which also varied significantly (p < 0.01) with sowing date in both seasons (Tables 5 and 6). These parameters were also significantly and positively correlated with pod yield (Table 7).
Pearson correlation coefficient for pod yield, total dry weight (excluding roots), number of pods per plant, seed size and harvest index, as influenced by sowing date in bambara groundnut, in Swaziland, 1999/2000 cropping season. (p values are given in parentheses).

Rainfall, soil moisture and pod yield
Relations between rainfall, soil moisture and pod yield were studied at two specific developmental stages, 50% flowering and 50% podding, in 1999/2000. This season was exceptionally wet (Figure 2), and no significant relationships were obtained between pod yield and soil moisture, and between pod yield and rainfall.
DISCUSSION
In Swaziland, as in many other locations in Africa, rainfall is the primary climatic factor determining when crops are sown. The onset of the rains may vary between late September and early November (Mushala, Reference Mushala1992). Thus the normal sowing time for most annual crops is between October and November, during which period the rains would invariably have arrived. However, bambara groundnut is planted by farmers anytime from October to as late as January.
An important aspect of crop adaptation and productivity is the way reproductive development is influenced by environmental factors, especially temperature and daylength (Roberts and Summerfield, Reference Roberts, Summerfield and Atherton1987; Squire, Reference Squire1990). In this study both temperature and daylength varied with sowing date, and mean daily air temperatures declined consistently late in the season. The thermal totals accumulated from sowing to flowering were more varied in 1998/99 than in 1999/2000. Also, the thermal times for the reproductive period varied substantially between the cropping seasons. This response reflects the differences between the two seasons in mean air temperatures. For example, the ranges in mean air temperature from sowing to flowering, across sowing dates, were 19.0–22.7 °C and 20.5–22.7 °C, for 1998/99 and 1999/2000, respectively. The variability in thermal times within a season could partly be attributable to the difficulties involved in determining the precise timing of maturity and podding in the field, due to the wide range in the rates of senescence among plants in a plot, because of the heterogeneity of bambara groundnut landraces and the subterranean nature of the pods.
In the bambara groundnut, depending on the landrace, flowering and/or podding may be delayed or even prevented by daylengths longer than the optimum (Azam-Ali et al., Reference Azam-Ali, Sesay, Karikari, Massawe, Aguilar-Manjarrez, Bannayan and Hampson2001; Brink, Reference Brink1997, Reference Brink1999; Harris and Azam-Ali, Reference Harris and Azam-Ali1993; Linnemann, Reference Linnemann1991, Reference Linnemann1993). For the landraces used in this study, the onset of flowering appeared to be influenced mainly by temperature, based on the strong linear relationship observed between thermal time and rate of development from sowing to flowering. In addition, the relative contribution of temperature and daylength in explaining variation in development rate is reflected in the relative sizes of the respective standard partial regression coefficients (Mayers et al. Reference Mayers, Lawn and Byth1991). In this study, the coefficients for mean air temperature were about twice those for daylength. The onset of podding, however, had a significant and negative linear relationship with daylength and the standard partial regression coefficient for daylength was substantially higher than that for temperature. These results are in agreement with earlier findings (Brink, Reference Brink1997; Harris and Azam-Ali, Reference Harris and Azam-Ali1993). Harris and Azam-Ali (Reference Harris and Azam-Ali1993), using a genotype from Zimbabwe, reported that pod development was fastest at daylengths shorter than 12 h and slowed as daylength increased. From experiments conducted in a semi-controlled environment, Brink (Reference Brink1997) reported that flowering in three bambara groundnut selections was influenced by temperature, and not by photoperiod, but the onset of podding was influenced by both temperature and photoperiod. The exact mechanism by which daylength controls pod development in bambara groundnut is yet to be fully clarified, although Linnemann (Reference Linnemann1991) demonstrated that embryo development was independent of daylength until 18 days after flowering when growth was terminated under long days.
The results presented indicate a strong effect of sowing date not only on development rates but also on the pod yield and dry matter production. The highest pod yields and total dry matter production were achieved consistently for the November sowings. Earlier sowing and successive delays in sowing from November caused significant yield reductions. The variation in pod yield across sowing dates was closely associated with variation in pod number per plant, seed size, harvest index and dry matter production. The reduction in the number of pods per plant with delay in sowing date is attributable either to the reduction in dry matter production and partitioning into pods, as reflected in the decline in harvest indices, or to a decline in the ability of the plants to initiate enough pods to utilize the carbon assimilates available. The reduction in dry matter production was a consequence of the effect of sowing date on leaf production, canopy development and the substantial reduction in the reproductive period, as sowing was delayed beyond November. These findings are consistent with those of studies conducted elsewhere where delayed sowing reduced yields through reductions in plant size, pod number, seed mass and duration of pod filling (Collinson et al. Reference Collinson, Sibuga, Tarimo and Azam-Ali2000; Harris and Azam-Ali, Reference Harris and Azam-Ali1993; Marcellos and Constable, Reference Marcellos and Constable1986; Neal and McVetty, Reference Neal and McVetty1984). The average length of the reproductive period for the November sowings was 17 d longer than that for the January sowings in 1999/2000. In 1998/99, the corresponding difference was 12 d. The duration of the reproductive period has a major impact on the productivity of bambara groundnut since pod-filling is dependent more on partitioning of assimilates from current photosynthesis than on remobilization of stored assimilates from vegetative organs (Brink, Reference Brink1999; Norman and Chongo, Reference Norman and Chongo1992; Sesay et al. Reference Sesay, Edje and Magagula2004). Thus, the yield of this crop would be especially sensitive to adverse environmental factors during the reproductive period. The reduction in the length of this period with delays in sowing is attributable to leaf senescence, which occurred earlier and more rapidly in the later sowings, reflecting the effect of declining temperatures during the latter part of the season, as indicated by the strong linear and positive relationship between the reproductive period and thermal time. Furthermore, the declining temperatures would have reduced leaf production and leaf size, and thus, dry matter production, resulting in fewer pods, smaller seeds and reduced yield. Thus, sowing in November would appear to provide the bambara groundnut plants with the opportunity to balance efficiently the time available between the generation of an adequate source capacity and the maximum partitioning of assimilates from current photosynthesis to economic yield.
Earlier sowing (September and October) also resulted in significantly lower pod yields than the November sowings. Early-sown plants experienced low soil moisture and low temperatures early in the season and low temperatures late in their growth cycle. The unfavourable conditions early in the season may have resulted in slow early growth and could have had persistent detrimental effects, resulting in smaller plants, lower leaf and dry matter production than in November-sown plants, resulting in reduced pod production and reduced yield for September- and October-sown plants.
In determining the relation between yield and soil moisture available to the crop at different growth stages, it was assumed that the yield of bambara groundnut, planted at different times in a semi-tropical region, on the same site and soil, and with the same management, would vary between planting dates largely because of the amount of rainfall and available soil moisture. Although positive and significant relations between grain yield and both soil moisture and total rainfall have been reported in the literature (Enyi, Reference Enyi1973; Kamara and Godfrey-Sam-Aggrey, Reference Kamara and Godfrey-Sam-Aggrey1979) no significant relationship was obtained between pod yield and soil moisture or between pod yield and rainfall in this study. The 1999/2000 cropping season was exceptionally wet, with rain falling mainly from December to February. Clearly, it is unlikely that available moisture was critical in determining yields in this season, once good crop establishment had been achieved.
In considering the implications of the results of this study, it should be recognized that the number of landraces tested was limited. Nonetheless, some general observations are possible. Sowing date strongly influences yields of photosensitive bambara groundnut genotypes in Swaziland through the effect of temperature and daylength on phenological and morphological development. The results substantiate the view (Azam-Ali et al. Reference Azam-Ali, Sesay, Karikari, Massawe, Aguilar-Manjarrez, Bannayan and Hampson2001) that the inter- and intra-annual variations in pod yield of bambara groundnut often observed by farmers may be associated with the year-to-year variation in planting date. As a practical recommendation, the results of this study suggest that the optimum time for planting bambara groundnut in Swaziland is November. This ensures a high level of expression of the yield potential of the crop, since the rains are most likely to have arrived and the crop is able to complete its development before the onset of low temperatures, assuming other factors are not limiting. This point implies that a relatively narrow range of economically useful sowing dates exists for bambara groundnut in Swaziland, for which the crop has to compete with staple food crops. A potential approach to this problem is varying planting density and spacing according to planting date, with higher densities being used in later plantings to achieve a particular canopy size (Harris and Azam-Ali, Reference Harris and Azam-Ali1993). However, due to the adverse growing conditions, particularly the decline in temperature when sowing is delayed beyond November in Swaziland, this management approach is not likely to produce the desired yield results. Thus, it would require an increase in the commercial value of the crop to develop it beyond its present status as a secondary food crop in order to create the incentives for farmers to adopt the necessary management practices that would stabilize and optimize the yield and increase production of the crop in Swaziland.
The pattern of response of bambara groundnut observed in this study may be expected to occur in other locations within the southern African region, but with some qualifications. Growing the same landraces at low latitudes, in which there is a smaller magnitude and seasonal range of daylengths, would be expected to reduce the size of the response to sowing date, and podding and maturity would occur comparatively earlier. On the other hand, at higher latitudes the response to sowing date could be expected to be greater, with podding and maturity occurring later than we have observed in Swaziland. However, since the results indicate substantial sensitivity to temperature, and also suggested that the critical daylength for the period from flowering to podding decreased at higher temperatures in bambara groundnut (Brink, Reference Brink1997; Linnemann and Craufurd, Reference Linnemann and Craufurd1994), temperature may be expected to modify these general response patterns in certain environments.
Acknowledgements
We would like to express our thanks to the Research Board of the University of Swaziland for financial support of the second season of experiments. The present study was conducted in an effort to generate agronomic information on the crop as a prelude to an international and multidisciplinary research project. Details are given in the Bambara Groundnut Project Final Report (European Union Framework Programme 5, No. ICA4-CT-2000-30002, 2004).