1. INTRODUCTION
Intense electron-beam accelerators (IEBA) based on the Blumlein line (Friedman et al., Reference Friedman, Limpaecher and Sirchis1988; Phelps et al., Reference Phelps, Franklin, Homeyer, Nerem and Overett1990; Liu et al., Reference Liu, Li, Zhang, Li and Wang2006) is widely used in a great variety of applications such as in lasers, high power microwave generators (HPMG) (Clark et al., Reference Clark, Mardar and Bacon1988), and X-ray generation (Coogan et al., Reference Coogan, Davanloo and Collins1990) and so on. At present, the increase of power and repetitive rate and the duration of the output pulse (Liu et al., Reference Liu, Yin, Ge, Zhan, Cheng, Feng, Shu, Zhang and Wang2007; Yatsui et al., Reference Yatsui, Shimiya, Masugata, Shigeta and Shibata2005) are the important development trend for an accelerator, but improving electron-beam quality is also important for the requirement of applications. Especially in the application of the high power microwave generators, the ideal pulse voltage is the flat-top rectangular pulse with fast rise-time and fall-time, and the plateau-time should be long enough, because the typical HPMG can operate at the highest of efficiency in this pulse voltage (Robert & Edl, Reference Robert and Edl2001). According to the traditional view, the main switch of the IEBA (Martin et al., Reference Martin, Guenther and Kristiansen1996); stray inductance and stray capacitance of the load are the main reasons which affect the rise-time and fall-time (Katsuki, Reference Katsuki, Takano, Namihira and Akiyama2001). In the paper by Liu et al. (Reference Liu, Cheng, Qian, Ge, Zhang and Wang2009), the designed condition of SSBL for the output ideal plateau voltage pulse at the matching load has been discussed. The effect of the rise-time and the fall-time of diode voltage on other factors have not been investigated by others. So in this paper, we will discuss the factors that affect the rise-time, fall-time, and plateau-time of the voltage waveform of the IEBA, especially the transition section that is between the main switch and middle cylinder of BPFL. According to the wave propagation theory along the BPFL, formulas for calculating the voltage at the load are deduced. The effect of the traveling time of the transition section on the rise-time, plateau-time and fall-time of the voltage at the load is analyzed. The PSpice soft is used to simulate the output voltage waveform of IEBA at the load to verify the analysis of wave propagation theory. At last, a couple of contrastive experiments are performed on two kinds of IEBA based on the SSBL with water dielectric. The experimental results agree with the theoretical and simulated results. The work in this paper is helpful to investigate and design IEBA based on SSBL for generating ideal square pulse voltage.
2. THEORETICAL ANALYSES
2.1. The Construction of the IEBA
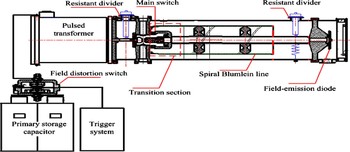
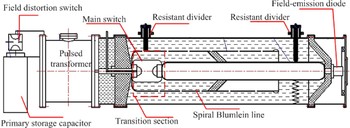
The SSBL consists of primary storage capacitors, field distortion switch with trigger system, high voltage pulse transformer, main switch, SSBL with water dielectric, resistant divider, and field-emission diode, which are shown in Figure 1.
(Color online) Diagram of the IEBA.

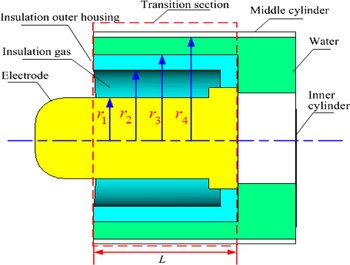
For the transition section we discuss in this paper, it is made up of the electrode holder of the main switch, the outer housing of the main switch, and the middle cylinder of the spiral Blumlein line, which is shown in Figure 1. In order to describe the concrete structure of the transition section, Figure 2 is the diagram of the transition section, it includes electrode, insulation gas which is filled in the switch, insulation outer housing of the switch, the water which works as the dielectric of the BPFL. In Figure 2, r 1, r 2, r 3, and r 4 are the radius of the electrode of the main switch, the inner radius of the outer housing, the outer radius of the outer housing and the radius of the middle cylinder, respectively. Clearly it could be seen that the transition section is a pulse transmission line.
(Color online) Diagram of the transition section.

2.2. The Analysis of the Wave Propagation along the SSBL
2.2.1. Equivalent Circuit of the BPFL
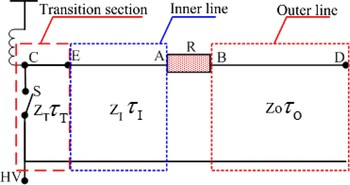
In case of the designed SSBL, the SSBL consists of three coaxial cylindrical lines filled with de-ionized water as dielectric. The PFL formed by the inner cylinder and the strip spiral middle cylinder are usually called inner line, its transmission time is τI and the wave impedance is Z I. If the PFL are formed by the strip spiral middle cylinder and the outer cylinder, they are called outer line, its transmission time and wave impedance are τO and Z O, respectively. Also, the transition section is a pulse transmission line with a wave impedance Z T and transmission time τT. For the IEBA, the load R is placed between the inner cylinder and the outer cylinder, and the main switch connects the inner cylinder and middle cylinder, the middle cylinder and the outer cylinder is not connected. So during the BPFL discharge into the load, the equivalent circuit of the BPFL is shown in the Figure 3. In Figure 3, S is the main switch, CE is the transition section, EA is the inner line, BD is the outer line, and R is the load.
(Color online) Equivalent circuit of the BPFL discharge into the load.

When the BPFL is charged to a voltage V Input, once the main switch S has closed, the BPFL cannot stay in equilibrium since the BPFL elementary capacitors adjacent to the load R start discharging. Here, we discuss the wave propagation along the BPFL after the S has closed. At first, a voltage wave entries the transition section, and transmits along the transition section, when it reaches the E, a reflected voltage wave and transmitted voltage wave start propagating, the coefficient of reflection and transmission are α1 and β1, respectively. At the same time, the reflected voltage wave propagates from the E end of the C; the transmitted voltage wave propagates from the E end of the A, when the reflected voltage wave arrives at the C, but the switch is closed, so the coefficient of reflection at the C is −1. Also when the transmitted voltage wave reaches the A, there will be another reflected and transmitted voltage wave, the reflected voltage wave starts propagating from the A end of the E, and the transmitted voltage wave starts propagating from the A end of the D, the coefficient of reflection and transmission are α2 and β2, respectively.
When the reflected voltage wave is taken into account, it propagates along the inner line and end at the E, once it reaches the E, the reflected and transmitted voltage wave start at the E, the coefficient of reflection and transmission are α4 and β4.
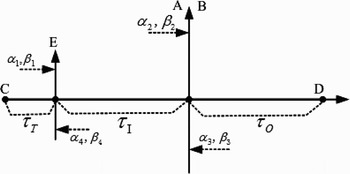
In addition, when the transmitted voltage wave which occurs at the A reaches the D, the middle cylinder and the outer cylinder is not connected. So the coefficient of the reflection at D is +1. And then, the reflected voltage wave that is reflected from the D propagates along the outer line and end at the B. when it reaches the B, reflected and transmitted voltage wave start at the B, the coefficient of reflection and transmission are α3 and β3. For α1, β1, α2, β2, α3, β3, α4, β4 they are:
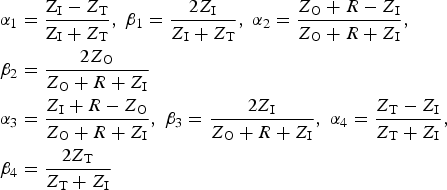
Figure 4 clearly shows the reflection and transmission at the E, A, B, and D.
The reflection and transmission at the E, A, B, and D.

2.2.2. Wave Propagation
When the BPFL is charged to a voltage V Input (<0), once the main switch S has closed, the BPFL start discharging to the load, t = 0, the voltage at the C is (−V Input), and the voltage wave (−V Input) propagates from the C to the E. When t = τT, the voltage wave reaches the E, and a reflected voltage wave and transmitted voltage wave start propagating, the reflected voltage wave propagates toward the C, the transmitted voltage wave propagates toward E. τT is usually small, so the reflected voltage wave which is from E arrives at C quickly, and there is also reflection at C, then the reflected voltage wave propagates from the C end of the E, the same process happens as the first time. After reflection and transmission at the E for many times, when t = τT + τI, the first transmitted voltage wave that is from E arrives at A, and then there is transmitted voltage wave arriving at A every 2τT. In other words, when time is τT ≤ t ≤ τT + τI, reflection and transmission happen many times at E, and when time is τT + τI ≤ t ≤ τT + 3τI, reflection and transmission happen many times at A.
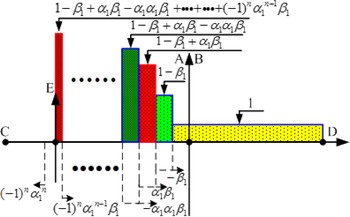
When τT ≤ t ≤ τT + τI, and after the n times reflection and transmission at E, the voltage wave along the BPFL is shown in Figure 5 and the coefficient value of the V Input. So, when τT ≤ t ≤ τT + τI, the voltage on the load is:

(Color online) τT ≤ t ≤ τT + τI the wave propagation.

When t = τT + τI, the transmitted voltage wave which is from the E at the first transmission reaches the load, so the voltage on the load is:

When t = 2τT + τI, the transmitted voltage wave which is from the E at the second transmission reaches the load, so the voltage on the load is:

When t = 3τT + τI, the transmitted voltage wave which is from the E at the third transmission reaches the load, so the voltage on the load is:

Of course, when  , the voltage on the load is:
![\eqalign{U_{\rm n} &= U_{{\rm n} - 1} + \lsqb \lpar \!-\!1\rpar ^n \alpha_1^{n - 1} \beta_1 + \lpar \!-\!1\rpar ^n \alpha_1^{n - 1} \beta_1 \alpha_2 \cr &\quad + \lpar \!-\!1\rpar ^{n - 1} \alpha_1^{n - 1} \beta_1 \beta_2] V_{\rm Input} \cr}](https://static.cambridge.org/binary/version/id/urn:cambridge.org:id:binary:20151022040714489-0722:S0263034609990103_eqn6.gif?pub-status=live)
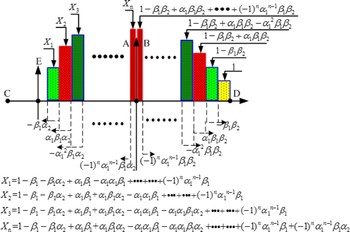
And then, t = τT + 2τI, the reflected voltage wave which is formed at the load A at the first arrives at the E, also the reflection and transmission happen at E, and every 2τT there are voltage wave arriving at E. At the same times, thanks to τT ≪ τI, and typical τI/2τT > 20, so when τT + τI ≤ t ≤ τT + 2τI, (−1)n α1n−1 ≪ 0, the wave propagation along the BPFL as shown in Figure 6, and the voltage on the load is:
(Color online) τT + τI ≤ t ≤ τT + 2τI the wave propagation.

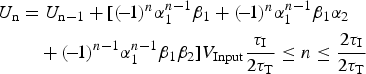
In fact, now (−1)nα1n−1 ≪ 0, the voltage on the load is a constant. U n = U n−1, and then the reflected voltage wave which is formed at the load A arrives at the E, also the reflection and transmission happen at E. if we suppose τI < τO, when t = τT + 2τI, the transmitted voltage wave which is formed at the load A at first has not arrived at D, but the reflected voltage wave has arrived at E. so when t = τT + 3τI, the reflected voltage wave which is from the E arrives at the load A, but after the time 2(τO − τI), voltage which is from the outer line will arrive at the load B. So when time τT + 3τI < t < τT + 3τI + 2(τO − τI), the voltage on the load is:

where U m=1 = U n_max + [(−β1α2α4) + (−β1α2α4)(α2 − β2)]V Input, U n_max is the maximum of Eq. (7), and 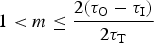 . And when t = τT + τI + 2τO, voltage which is from the outer line will arrive at the load B. So when time τT + τI + 2τO ≤ t ≤ τT + τI + 3τO, the voltage on the load is:

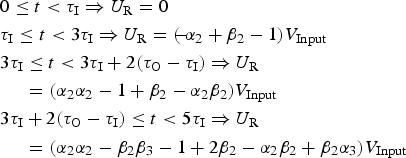
where U p=1 = U m_max+[(−β1β2β3)−(−β1β2α3−β1β2)] V Input, U m_max is the maximum of Eq. (8), and 1 < p ≤ τO/2τT. Through the analysis of the wave propagation above, the parameter of the BPFL and the transition section, the voltage on the load can be attained easily from the Eqs (6)–(9).
2.2.3. Wave Propagation with no Transition Section
In the above, the wave propagation along the BPFL, and transition section has been analyzed. If there is no transition section, the wave propagation along the BPFL is much simple and there is no reflection and transmission at the E. So the voltage on the load is:
2.3. Calculation of the Voltage on the Load
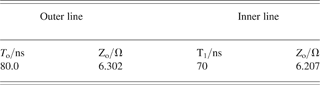
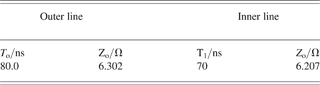
For the IEBA, the main electrical parameters of the BPFL are shown in Table 1. For the transition section, it is shown in Figure 2, the total inductance of the outer line is:
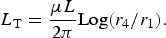
where μ = 4π × 10−7 is the permeability of the dielectric insulation inside the transition section, L is the length of the transition section. Also the capacity of the transition section is
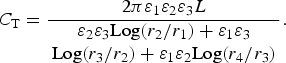
where ɛ1, ɛ2, ɛ3 are the permittivity of the gas which is filled in the switch, the outer housing of the switch, and the dielectric insulation of the SSBL, respectively. ɛ1 = 8.85 × 10⁻¹², ɛ2 = 2.3×8.85 × 10−12, ɛ3 = 81 × 8.85 × 10−12.
From Eqs (11) and (12), the characteristic impedance of the transition section is given by:

Also, from Eqs (11) and (12), the traveling time of the voltage wave along the transition section is:

For the transition section, the geometric parameters are L = 25 cm, r 1 = 8.0 cm, r 2 = 13.5 cm, r 3 = 16.5 cm, and r 4 = 20.0 cm. Substituting these geometric parameters into Eqs (13) and (14), the characteristic impedance and traveling time of the transition section are Z = 45 Ω, τT = 1 ns. Then, if we substituting these electrical parameters of the BPFL and transition section into the Eqs (6)–(10), the voltage waveform can be obtained at matching load (R = Z O + Z I).
Figure 7 shows the voltage wave at the matching load. It clearly shows that the voltage wave is a square pulse if there is no transition section, and the voltage waveform is distorted if there is transition section. When τT = 0.5 ns, the rise-time, the plateau-time, and the fall-time of the wave form are T r = 22 ns, T p = 122 ns, T f = 26 ns, respectively. And when τT = 1 ns, T r = 36 ns, T p = 112 ns, T f = 52 ns. It means that the rise-time and fall-time of the waveform increase with the increment of traveling time of the transition section, and the plateau-time of the waveform decreases with the increase of the traveling time of the transition section. So, in order to decrease the rise-time, to decrease the fall-time, and to increase the plateau-time of the wave form, decreasing the traveling time of the transition section is needed.
(Color online) Theoretical voltage wave at the matching load.

3. PSPICE SIMULATION ANALYSES
3.1. Model of the Simulation
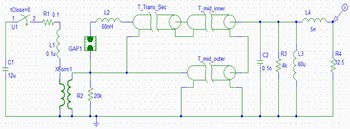
The construction of the IEBA is schematically shown in Figure 1. It is made up of primary storage capacitors, field distortion switch with trigger system, high voltage pulse transformer, main switch, SSBL with water dielectric, resistant divider, and field-emission diode. The PSpice Circuit analysis is used to model the IEBA (Fig. 8 shows schematically the circuit model).
(Color online) PSpice Circuit Schematic used to Model the IEBA.

As shown in Figure 8C1 is the primary energy-storage capacitance, and R1 and L1 are the resistance and inductance of primary winding circuit, high voltage pulse transformer and the main switch are modeled and indicated by XForm1 and GAP1 in the circuit, respectively. L2 is the inductance of the main switch, T_mid_inner and T_mid_outer are connected in parallel to simulate the BPFL, T_Trans_Sec is the transition section. R2 and R3 are the resistors of the resistant divider in Figure 1; L3 is the inductor that connects the inner cylinder of the BPFL to the ground. R4 is the load of the IEBA. The whole circuit is connected with components built in PSpice component storage or modeled by the authors according to the performance of the device. In the circuit, the operation voltage of the IEBA is controlled by the main switch, GAP1.
3.2. Simulation Results
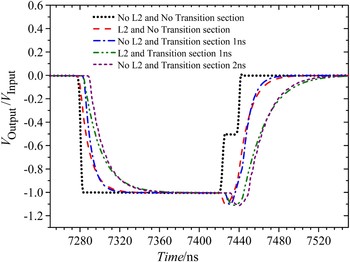
Figure 9 shows the PSpice simulation result of the voltage waveform at the matching load. It clearly shows that the inductance of the main switch affects the rise-time of the voltage waveform. If there is no transition section, and the main switch is ideal, in other words, L2 = 0, the voltage waveform is a square pulse. But if L2 = 0 and τT ≠ 0, the voltage waveform is not a square pulse, this means that the traveling time of the transition section has effect on the voltage waveform, and when τT = 1 ns, L2 = 0, or τT = 0, L2 = 60 nH, the rise-time, plateau-time, and fall-time of the voltage waveform are 38 ns, 115 ns, and 50 ns, respectively. However when τT = 1 ns, L2 = 60 nH, or τT = 2 ns, L2 = 0, the rise-time, plateau-time, and fall-time of the voltage waveform are 55 ns, 95 ns, and 80 ns, respectively. So a conclusion can be drawn that the main switch affects the rise-time, plateau-time, and fall-time of the voltage waveform. Also the traveling time of the transition section has a great effect on the voltage waveform.
(Color online) PSpice simulation results of the voltage wave at the matching load.

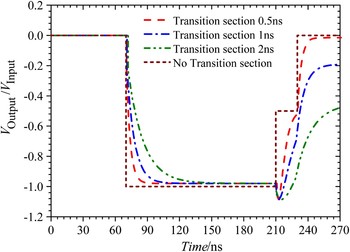
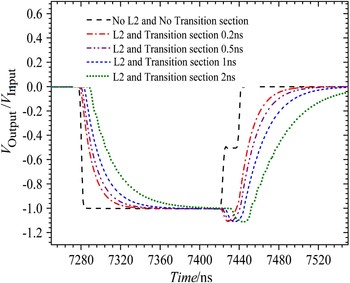
In order to further understand the effect of the transition section on the matching load, we keep L2 at 60 nH and then change the traveling time of the transition section. The voltage waveform at the matching load is shown in Figure 10. The simulation results clearly show that the rise-time and fall-time of the voltage waveform increase with the increment of the traveling time of the transition section, and the plateau-time of the voltage waveform decreases with the increment of the traveling time of the transition section. When τT is 2 ns and L2 = 60 nH, the plateau-time is only 30% of the ideal condition (τT = 0, L2 = 0), the distortion of the voltage waveform is serious. So in order to generate ideal square pulse, the traveling time of the transition section and the inductance of the main switch should be decreased. In fact, once the main switch is designed, the inductance of the switch is unchanged, so the traveling time of transition section is a determined factor that affects voltage waveform of the IEBA at the load. So, in order to decrease the rise-time, to decrease the fall-time, and to increase the plateau-time of the wave form, decreasing the traveling time of the transition section is need. The simulation results agree with the theoretical analysis absolutely.
(Color online) PSpice simulation results of the voltage wave at the matching load.

4. EXPERIMENTAL RESULTS
In order to further identify the correctness of the theoretical analysis and simulation results, a couple of contrast experiments are performed using two kinds of IEBA based on the SSBL with water dielectric. The structure of the first IEBA (IEBA-A) which has been introduced in Figure 1; the traveling time of the transition section is 1 ns and the electrical parameters are shown in Table 1. The structure of other IEBA (IEBA-B) (Liu, Reference Liu2008) is shown in Figure 11; the traveling time of the transition section is 0.5 ns, the wave impedance and transmission time of the outer line and inner line are 5.12 Ω, 75 ns, and 5.13 Ω, 80 ns, respectively. The inductance of the main switch of the two IEBA is approximately equal, about 60 nH. During the experiments, the two IEBA work in the same condition and the operating process of the IEBA is as follows: while the charging voltage of the primary storage capacitor increased to a certain value, the field distortion switch was triggered by a trigger pulse and closed, and then the primary storage capacitor discharges to the primary winding of the pulsed transformer. Consequently, the pulsed transformer starts to charge the BPFL. Once the charging voltage of the BPFL reaches the breakdown value of the main switch, the BPFL discharged to the field-emission diode, and the high current electron beam will be generated readily in field-emission diode. In ours experiments, we just want to get the output voltage on the load, so two large power matching load with a resistance of 12.5 Ω and 10.2 Ω are used instead of the field-emission diodes of IEBA-A and IEBA-B, respectively. And a resistant divider is used to measure the voltage at the matching load.
(Color online) Diagram of the IEBA-B used in the experiment.

The main electrical parameter of the BPFL
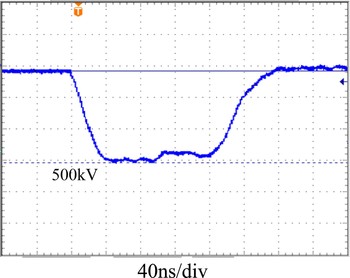
For the IEBA-A, the voltage waveform at the matching load is shown in Figure 12, the peak voltage is 500 kV, the rise-time of the waveform is 60 ns, the duration of the pulse plateau is 100 ns, and the fall-time of the waveform is 90 ns.
(Color online) The typical output voltage waveform of the IEBA-A.

The voltage waveform at the matching load of the IEBA-B is shown in Figure 13, the peak voltage is also 500 kV, the rise-time of the waveform is 40 ns, the duration of the pulse plateau is 120 ns, and the fall-time of the waveform is 80 ns.
(Color online) The typical output voltage waveform of the IEBA-B.

From the experiment results, it clearly follows that when the wave traveling time of the transition section is shorter; the rise-time of the IEBA is much shorter. So this contrast experiment confirms the correctness of the theoretical analysis and the simulation. When the wave traveling time of transition section is decreased, a shorter rise-time and longer pulse plateau output voltage waveform can be obtained at the matching load of IEBA.
5. DISCUSSION AND CONCLUSIONS
Through the analysis of theoretical calculation, PSpice simulation and experiment, some basic results can be got. During the theoretical calculation, the inductance of the switch is neglected (L2 = 0), when τT = 0.5 ns, the T r = 22 ns, T p = 122 ns, and T f = 26 ns, and when τT = 1 ns, the T r = 36 ns, T p = 112 ns, and T f = 52 ns (Fig. 7), these show that the traveling time of the transition section has a great effect on the waveform of the IEBA. Also the PSpice simulation results show that, when τT = 1 ns and L2 = 0, the T r = 38 ns, T p = 115 ns, and T f = 60 ns (Fig. 9), this agrees with the theoretical calculation. And then the inductance of the switch is taken into account (L2 = 60 nH) during the PSpice simulation, if the τT = 1 ns, the results are T r = 55 ns, T p = 95 ns, and T f = 80 ns, if τT = 0.5 ns, the results of T r = 40 ns, T p = 1000 ns, and T f = 70 ns (Fig. 10) are obtained. At last, the experiments results show that if L2 = 60 nH and τT = 1 ns, the T r = 60 ns, T p = 1000 ns, and T f = 90 ns (Fig. 12), if L2 = 60 nH and τT = 0.5 ns, the T r = 40 ns, T p = 120 ns, and T f = 80 ns, there results confirm the correctness of PSpice simulation and further proves that the traveling time of the transition section is one of the important factors which affect the rise-time, plateau-time and fall-time of the waveform of IEBA.
Through the theoretical analysis, simulation results, and experiments results above, some conclusions can be lead to the following: (1) The rise-time, plateau and fall-time of the voltage waveform is related to wave traveling time of the transition section. (2) The transition section is one of the most important factors which affect the pulse rise-time, the plateau-time, and the fall-time of the IEBA, rise-time and fall-time of the waveform increase with the increase of traveling time of the transition section, and the plateau-time of the waveform decreases with the increase of the traveling time of the transition section. So, in order to decrease the rise-time, to decrease the fall-time, and to increase the plateau-time of the wave form, decreasing the traveling time of the transition section is need. So, in order to get an ideal square pulse voltage waveform at the load and to improve the electron beam quality of such an accelerator, the wave traveling time of the transition section should be designed shortly as far as possible.
ACKNOWLEDGMENTS
The authors gratefully acknowledge the support from the National Natural Science Foundation of China under Grand No. 10675168. The authors also acknowledge the generous support by J.H. Yang and H.W. Yang for their valuable suggestion, and they thank L.R. Xu, J.H. Feng, and J.C. Wen for their assistance in the assembly and testing of accelerator.