I. INTRODUCTION
Additive manufacturing (AM), a layer-based manufacturing process, has emerged as a promising fabrication technology embraced by different industries for numerous applications. Powder-bed electron beam additive manufacturing (EBAM), using an electron beam to melt and fuse powder, is one of a few AM technologies for direct digital manufacturing of metal products. Reference Murr, Esquivel, Quinones, Gaytan, Lopez, Martinez, Medina, Hernandez, Martinez, Martinez, Stafford, Brown, Hoppe, Meyers, Lindhe and Wicker1 (There is also a wire-fed EBAM technology, commonly known as electron beam freeform fabrication (EBF Reference Zäh and Lutzmann3 ). For the sake of simple terminology, EBAM will be used throughout this paper, referring to the powder-bed EBAM process.) Because of several unique advantages such as a high energy efficiency, a rapid scan speed, and a moderate operation cost, EBAM has attracted ever increasing interest from aerospace, military, and biomedical industries.
Research subjects in EBAM have spread across a wide spectrum ranging from material and microstructural characterization, Reference Murr, Esquivel, Quinones, Gaytan, Lopez, Martinez, Medina, Hernandez, Martinez, Martinez, Stafford, Brown, Hoppe, Meyers, Lindhe and Wicker1,Reference Gong, Chou and Mears2 process modeling and simulation, Reference Zäh and Lutzmann3–Reference Gong, Cheng, Price, Chou, Durbetaki and Donnell5 process metrology, Reference Price, Cooper, Chou, Bourell, Crawford, Seepersad, Beaman and Marcus6 and to geometric attributes. Reference Koike, Martinez, Guo, Chahine, Kovacevic and Okabe7 Even with many potential benefits over conventional manufacturing technologies, EBAM still exhibits several challenges such as part accuracy and property variations. Cooke and Soons Reference Cooke, Soons and Bourell8 studied the geometric accuracy of EBAM parts. It is observed that the dimensional and form errors of EBAM parts are significantly larger than those of typical machined parts.
Ti–6Al–4V is one of the most commonly used alloys in EBAM. Microstructures of Ti–6Al–4V parts produced by EBAM contain a mixture of phases such as α (hexagonal closed packed, HCP), β (body centered cubic, BCC), and α′ martensite (HCP). Columnar-shaped prior β structures formed during initial solidification were observed, which is a result of very high temperature gradients along the build direction. Reference Al-Bermani, Blackmore, Zhang and Todd9,Reference Safdar, Wei, Snis and Lai10 Antonysamy et al. Reference Antonysamy, Meyer and Prangnell11 studied the prior β grain texture of EBAM components and reported that the columnar structure shows strong fiber textures of <001> β, which is normal to the deposited powder layers. On the other hand, Safdar et al. Reference Safdar, Wei, Snis and Lai10 reported typical Widmanstätten (α + β) inside of prior β grains. Moreover, Facchini et al. Reference Facchini, Magalini, Robotti and Molinari12 investigated Ti–6Al–4V microstructures in EBAM and showed that the main constituent in EBAM-made Ti–6Al–4V is α with only a small fraction of β. In addition, Christensen et al. Reference Christensen, Kircher, Lippincott and Gilbert13 compared the EBAM microstructures to counterparts from a casting process. For the cast part, a coarse acicular (α + β) and thick prior β grain boundaries can be observed, while the microstructure of the EBAM part consisted of fine acicular (α + β) and thin prior β grain boundaries. The thickness of the α-lath is around 1.4–2.1 µm for different EBAM samples. Reference Murr, Esquivel, Quinones, Gaytan, Lopez, Martinez, Medina, Hernandez, Martinez, Martinez, Stafford, Brown, Hoppe, Meyers, Lindhe and Wicker1 Due to high cooling rates during the solidification, α′-martensitic platelets also exist in EBAM parts, which may contribute to increased strength and hardness, but lower ductility. Reference Murr, Gaytan, Medina, Martinez, Martinez, Hernandez, Machado, Ramirez and Wicker14,Reference Gong, Anderson, Chou and Leu15 In summary, Ti–6Al–4V parts from EBAM show a fine Widmanstätten (α + β) microstructure combined with α′, which can be expected by the thermal characteristics of the EBAM process, i.e., very rapid cooling.
The microstructures of EBAM Ti–6Al–4V also vary with the process conditions. It has been reported that EBAM process parameters may have significant effects on the part quality. Reference Murr, Gaytan, Medina, Martinez, Hernandez, Martinez, Lopez, Wicker, Collins and Bourell16,Reference Bontha, Klingbeil, Kobryn and Fraser17 Murr et al. Reference Murr, Gaytan, Medina, Martinez, Hernandez, Martinez, Lopez, Wicker, Collins and Bourell16 reported that variations during the melting stage including the beam current and the scan speed affect EBAM built defects such as porosity, which may be related to the microstructure-property variations in the final product. Reference Murr, Quinones, Gaytan, Lopez, Rodela, Martinez, Hernandez, Martinez, Medina and Wicker18 The electron beam scanning speed is one of the critical parameters in the EBAM process. Reference Zäh and Lutzmann3 Jamshidinia et al. Reference Jamshidinia, Kong, Kovacevic, Durbetaki and Donnell19 applied a finite element model to study heat distributions in EBAM using Ti–6Al–4V powder. It was reported that the cooling rate at 1000 mm/s scanning speed is about 170,800 °C/s, versus about 15,300 °C/s and 1300 °C/s for the beam speed of 500 mm/s and 100 mm/s, respectively. Although various aspects in EBAM were investigated and reported, there has been little systematic study of the relationship between the beam speed and the microstructure of the EBAM parts.
The objective of this experimental study is to better understand the microstructural variations, in terms of phases and characteristic length, affected by the beam scanning speed in Ti–6Al–4V from EBAM. A commercial EBAM system was used to fabricate samples with different beam speeds during the same build cycles for microstructural analysis. Moreover, a thermal imager was applied to acquire process temperatures during the build process. The intent is to correlate part microstructures with process thermal characteristics.
II. EXPERIMENTAL PROCEDURE
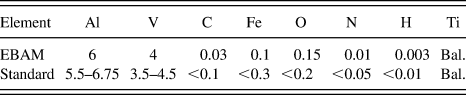
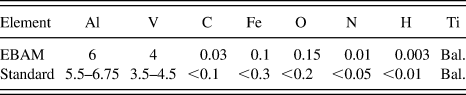
An Arcam S12 EBAM machine (Arcam, Sweden) at NASA's Marshall Space Flight Center (Huntsville, AL) was used to fabricate samples, which were simple blocks (60 mm long, 5.5 mm wide, and 25 mm high) modeled from CAD software. Fine pre-alloyed Ti–6Al–4V powder, with a diameter primarily in the range between 45 and 100 µm, was used as feedstock materials; the composition of Ti–6Al–4V powder used is shown in Table I. The layer thickness was 70 µm. The EBAM process involves powder spreading, preheating, as well as contour and hatch melting. During the melting stages, an electron beam moves across the powder-layer surface tracing the cross-section boundary of the part and then raster-scans through the inside of the contour.
Chemical analysis for Ti–6Al–4V powder in wt.%. Reference Gong, Chou and Mears2
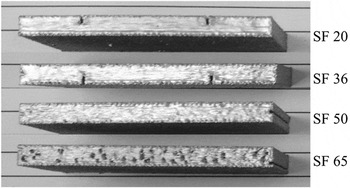
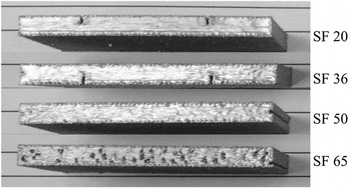
Electron beam scanning in an EBAM system is controlled by magnetic deflection coils, which enables very high scanning speeds, e.g., 15 m/s. For Arcam EBAM systems, the speed function (SF) is a process parameter setting related to the actual beam scanning speed. Reference Mahale20 In this study, four different SFs were tested (20, 36, 50, and 65) to investigate the beam speed effects on build part microstructures. Figure 1 shows the EBAM-fabricated samples processed with the corresponding SF. It is noted that the scanning speed affects the surface defects such as porosity. Pores are very prevalent at the final build surface of the sample using SF 65.
EBAM parts built with different SFs.
A LumaSense MCS640 near-infrared (NIR) camera (LumaSense Technologies, Santa Clara, CA) was used for temperature measurements during the EBAM experiments. The NIR camera has a spectral range of 0.78–1.08 µm and a 640 × 480 pixel uncooled focal plane array sensor. The image capturing system has a maximum frame rate of 60 Hz and a detectable temperature range of 600–3000 °C. The NIR camera was mounted on a tripod and positioned to look downward through the EBAM machine's viewport onto the build platform. The emissivity of Ti–6Al–4V at high temperatures and the liquid state is not known, and thus, the emissivity setting of the NIR camera was assigned as 0.35. The details of the camera setting and setup with the EBAM system can be found in a previous study. Reference Price, Cooper, Chou, Bourell, Crawford, Seepersad, Beaman and Marcus6 For the current study, the acquired thermal images were analyzed to obtain the average temperature profiles around the beam location and to estimate the melt pool sizes for each SF case and at the same build height of 24.43 mm. Moreover, the thermal videos acquired were used to calculate the actual beam speed values during the melting stage, by evaluating the molten pool movement between consecutive frames. It was found that the beam speed is related to both the SF and the build height, using the relationships found, a regression equation for the beam speed is shown in Eq. (1).
 $$v = \left( { - 0.7343h + 28.554} \right){\rm{SF}}\quad,$$
where v is the translational beam speed in mm/s, h is the build height in mm, and SF is the speed function index. The beam speeds calculated using the equation were compared to the experimental data and were found to match closely, with a maximum error of 6.6%.
Fabricated Ti–6AL–4V samples were prepared for microstructural observations using standard metallographic procedures including sectioning, mounting, grinding with SiC papers up to the grit size of 1000, and then polished using diamond suspension down to 0.5 µm. Specimens were cut from near the top surface of the build parts for analysis. Specimens of different cross-sections (scanning surface: Z-plane, build side surface: X-plane) were prepared to examine the anisotropic conditions in microstructures. To reveal the microstructures, polished specimens were then etched with a hydrofluoric acid-based solution: 1 mL hydrofluoric acid (50 wt.%) and 3 mL nitric acid (60 wt.%) in 7 mL distilled water. Reference Murr, Gaytan, Medina, Martinez, Hernandez, Martinez, Lopez, Wicker, Collins and Bourell16 The etched metallographic samples were examined using a Leitz optical microscope (OM; Leitz Microscope, Germany) and a Philips XL-30 scanning electron microscope (SEM; Philips, Netherlands). To quantify the size of columnar β, equiaxed β, and α-lath, a measurement method from the literature (Wang et al. Reference Wang, Zeng, Shao, Zhao and Zhou21 ) was applied.
III. RESULTS AND DISCUSSION
A. Typical microstructures
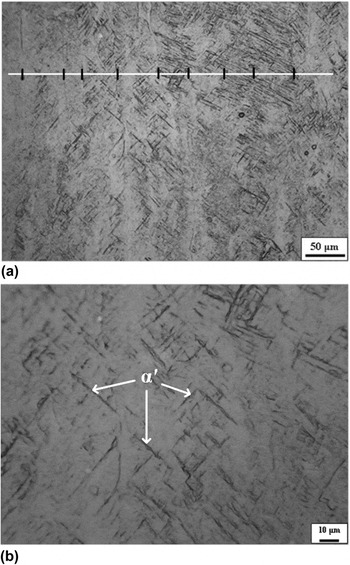
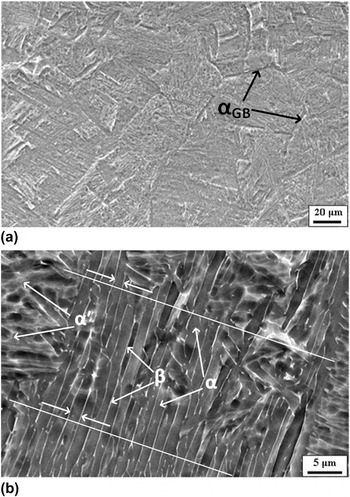
Figure 2 shows a typical microstructure from the X-plane (side surface) of an EBAM sample at SF 36. It is obvious that prior β grains grew along the build direction and across the built-layers in the sample. The solidification of Ti–6Al–4V alloy involves two steps: liquid to primary solid phase of β and solid phase transformation, β to α or α′, depending on the cooling rate. The nucleation and growth of columnar grains of prior β take place during initial rapid solidification before the temperature drops to the β-transus temperature (about 980 °C). The columnar prior β grains are typically associated with high-energy materials processing, and upon rapid cooling from the melt, the growing grains align themselves with the steepest temperature gradients Reference Kelly22 and result in a columnar-shaped morphology. Reference Wu, Liang, Mei, Mitchell, Goodwin and Voice23 According to the study of Antonysamy et al., Reference Antonysamy, Meyer and Prangnell11 in EBAM, the nucleation of β grains occurred heterogeneously from the boundary layers at the build plate or the part surfaces. The authors also studied the prior β-grain texture of EBAM components and the columnar structure shows strong fiber texture of <001> β along the build direction, which may be attributed to the elongated shape of the moving molten pool.
Microstructure of X-plane (side surface) specimen from an EBAM sample (SF 36): (a) low magnification showing columnar width analysis, and (b) high magnification image.
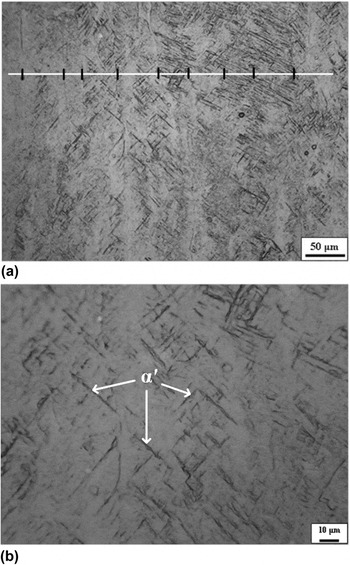
Another feature in typical EBAM Ti–6Al–4V microstructures is the martensitic phase, α′, which appears as plates, as can be seen in Fig. 2. The α′ is transformed from the β phase due to a very high cooling rate. According to the study of Ahmed and Rack, Reference Ahmed and Rack24 for Ti–6Al–4V, a cooling rate of more than 410 °C/s, from the single β to the (α + β) region, will induce α′ formations. In addition, to trigger the formation of martensite, the temperature must be lower than the martensite starting temperature (M S) of 575 °C. Reference Kelly22 Other researchers, however, reported the M S as 650 °C and the martensite finishing temperature as 400 °C. Reference Elmer, Palmer, Babu, Zhang and Debroy25 The α′ phase is commonly observed in Ti–6Al–4V alloy subject to rapid solidifications such as selective laser melting Reference Baufeld, Brandl and van der Biest26 and electron beam welding. Reference Lu, Shi, Lei and Li27
The width of the columnar prior β grains was measured in this study. Figure 2(a) illustrates an example of the width measurements. The image was overlaid with straight lines which are normal to the boundaries of the columnar structures, and the intersections of the lines with grain boundaries were examined and used for the width estimate. Different images from different specimen areas were measured to obtain statistical data. The average width of the columnar structure is about 41.6 µm for this case (SF 36). This result is smaller than the columnar width reported by Al-Bermani et al., Reference Al-Bermani, Blackmore, Zhang and Todd9 75–150 µm.
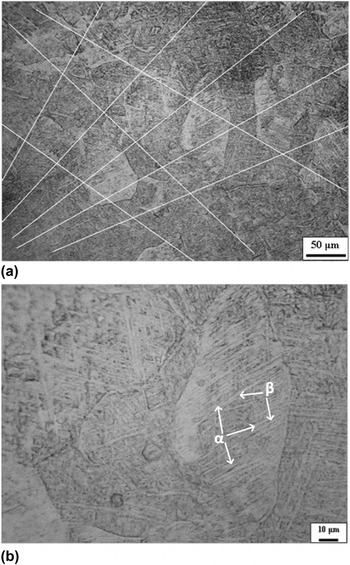
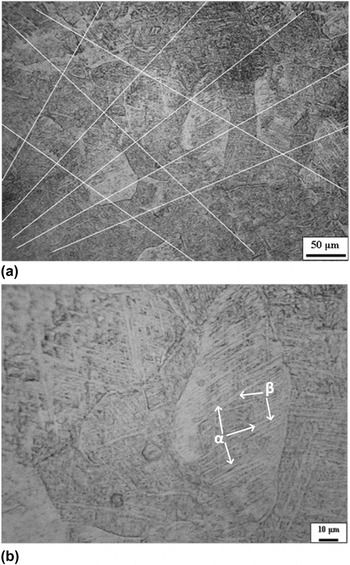
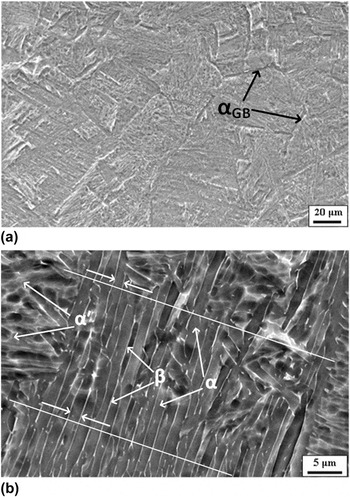
Figures 3 and 4 illustrate a typical microstructure of the Z-plane (scanning surface) specimen, also from the SF 36 sample. Different from the microstructure from the X-plane (Fig. 2), equiaxed grains are noted. Hence, it can be concluded that the prior β grains are of a rod shape. Similar equiaxed grains at the scanning surface have also been reported for Ti–6Al–4V alloy Reference Al-Bermani, Blackmore, Zhang and Todd9 and other alloys Reference Amato, Hernandez, Murr, Martinez, Gaytan, Shindo and Collins28,Reference Murr, Gaytan, Ceylan, Martinez, Martinez, Hernandez, Machado, Ramirez, Medin, Collins and Wicker29 by other researchers. Figures 3(b) and 4 show higher magnification images of the Z-plane specimen from OM and SEM, respectively; both α and β phases can be identified. Upon cooling from the β-transus temperature, the initial α that nucleates is the so-called “grain boundary” α (αGB) because of its location on a β boundary. Eventually, the β boundaries will be replaced by αGB in a continuous fashion, Reference Kelly22 as can be noted from Fig. 4(a). In addition, fine Widmanstätten (α + β) structures are shown inside of equiaxed grains, indicating a rapid cooling rate in EBAM. Widmanstätten (α + β) is a typical microstructure in Ti–6Al–4V parts produced by EBAM, as can be clearly identified from high magnification images, Figs. 3(b) and 4(b). In solid phase transformation, the prior β columnar grains are transformed into fine α laths. The (α + β) structure is formed by diffusion controlled solid phase transformation, during which V diffuses into β while Al diffuses into α. Reference Safdar, Wei, Snis and Lai10 Further, the classical α-lath structure is surrounded by a very small amount of β in the α boundaries. This result is similar to the studies from Safdar et al. Reference Safdar, Wei, Snis and Lai10 and Murr et al. Reference Murr, Gaytan, Medina, Martinez, Martinez, Hernandez, Machado, Ramirez and Wicker14 Compared with the wrought or cast Ti–6Al–4V, EBAM Ti–6Al–4V parts show a finer α phase. Al-Bermani et al. Reference Al-Bermani, Blackmore, Zhang and Todd9 also reported that fine α laths have no preferred texture which is different from strong texturing of prior β grains.
Microstructure of Z-plane (scanning surface) specimen from an EBAM sample (SF 36): (a) low magnification showing grain size analysis, and (b) high magnification image.
Scanning electron micrographs from Z-plane of an EBAM sample: (a) 1000 × image, and (b) 5000 × image showing α-lath analysis.
Similar to the measurement method for the columnar width, intersections of the lines with prior β grain boundaries were marked and used for the grain size estimate. The microstructural image was overlaid with several random lines, as shown in Fig. 3(a). From the measurements, the size of the equiaxed grains is estimated as 50.1 µm in this case (SF 36 sample).
The width of α laths was also quantitatively analyzed using SEM images, with an example shown in Fig. 4(b). The average thickness of α laths is 1.1 µm for this particular sample (SF 36).
B. Beam speed effects
1. Thermal characteristics
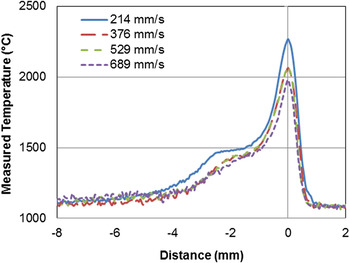
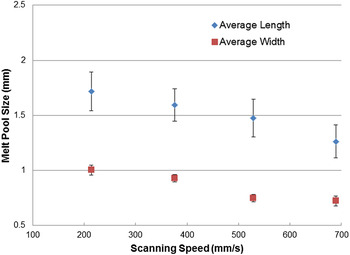
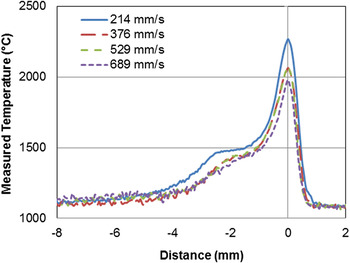
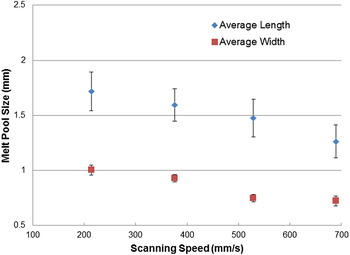
The estimated beam speed values using the method described above were 214, 376, 529, and 689 mm/s for SF 20, 36, 50, and 65, respectively. It needs to point out that the reported speed values above were at the build height of 24.43 mm, close to the end of the build. Using MATLAB software, the acquired thermal images (temperature contours) were processed to obtain temperature profiles along the beam scanning path. Multiple frames were processed and analyzed to obtain statistical data for plots. Temperature profiles from different beam speed values are shown in Fig. 5. The case of 214 mm/s (lowest speed) has the highest maximum temperatures and noticeably higher temperatures in general. On the other hand, beam speeds of 376 mm/s and 529 mm/s (SF 36 and SF 50) have close temperature distributions and 689 mm/s (SF 65) has slightly lower temperatures compared with SF 36 and SF 50. In the temperature profiles, a near-zero slope (low cooling rate) area can be identified as the liquidus–solidus transition. It also needs to point out that because of assumed Ti–6Al–4V emissivity (0.35), the transition zone is deviated from the theoretical liquidus temperature of Ti–6Al–4V (1655 °C). However, the identified liquidus temperature (T L) is still valid for melt pool size estimates, e.g., the distance between 2 locations with T L as the melt pool length. The average molten pool dimensions as well as standard deviations for each speed beam were calculated at the build height of 24.43 mm, shown in Fig. 6. The melt pool length and width are in the range of 1.25–1.75 mm, and 0.75–1 mm, respectively. The melt pool result also shows noticeable variations, probably because both the process and measurements are sensitive to changes in the system and environment. However, the trend clearly shows that both the molten pool length and width decrease with the increase of the beam speed, also the SF.
Average temperature profiles from different beam speeds at build height of 24.43 mm.
Melt pool size versus beam scanning speed at build height of 24.43 mm.
2. Microstructures
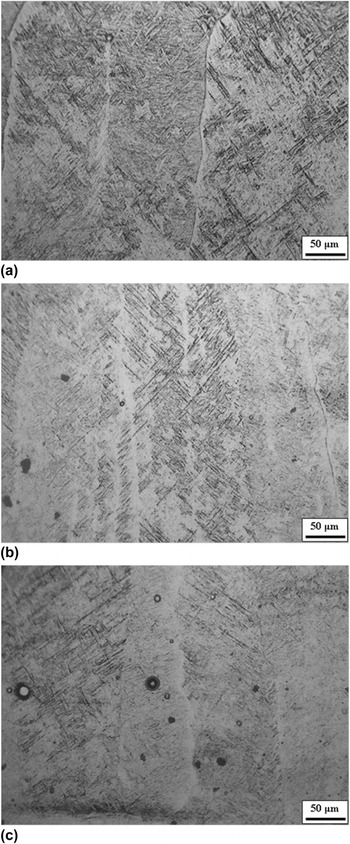
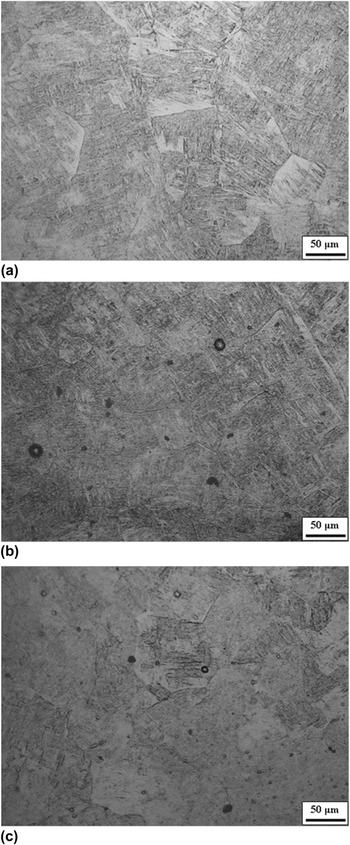
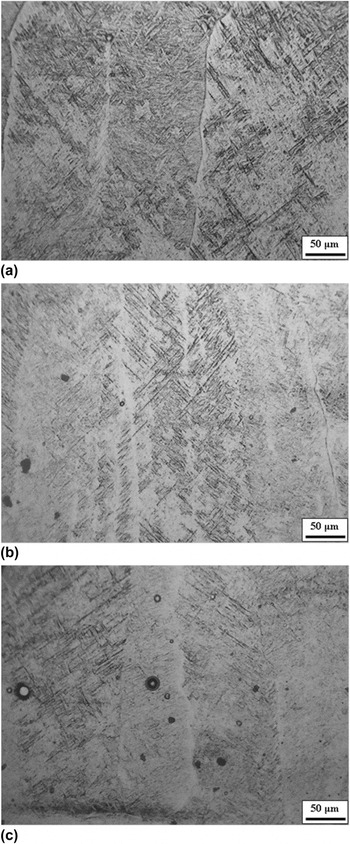
The influence of the beam speed to the microstructures from the X-plane specimen is shown in Fig. 7. Generally, the width of columnar structures decreases with the increase of the beam scanning speed, e.g., 109.7 µm at 214 mm/s versus 37.1 µm at 529 mm/s, shown in Table II. However, the exception is the SF 65 case, in which the width of columnar structures is slightly larger than that of SF 50. For a given beam power, increasing the scanning speed would increase the cooling rate and the thermal gradient, which should result in smaller columnar β grains. Reference Bontha, Klingbeil, Kobryn and Fraser17 Gockel and Beuth Reference Gockel, Beuth and Bourell30 also reported that increasing the scanning speed will have a greater tendency to form columnar grain structures. Additionally, Wu et al. Reference Wu, Liang, Mei, Mitchell, Goodwin and Voice23 also investigated the beam speed effect on the grain morphology in laser AM of Ti–6Al–4V. With a higher scan speed, more nuclei can be generated due to more rapid cooling with finer grains in a long and narrow columnar morphology.
OM microstructures from X-plane specimens: (a) SF 20, (b) SF 50, and (c) SF 65.
Measured characteristic sizes from samples with various SFs.

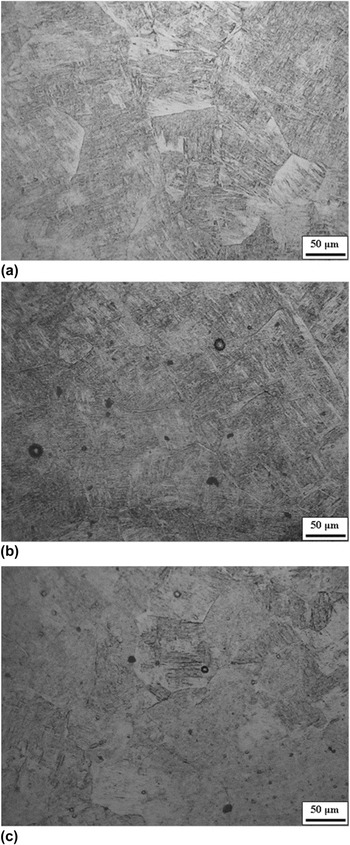
Figure 8 shows the microstructures from OM for the Z-plane specimens, which are characterized by equiaxed grains for all SF values tested. The measured sizes of equiaxed grains are also listed in Table II. The SF 20 sample (lowest beam speed, 214 mm/s) has the largest grain size of 85.2 μm, while the grain sizes of the specimens from SF 36, SF 50, and SF 65 are similar, all less than 50 μm. Gil et al. Reference Gil, Ginebra, Manero and Planell31 studied the effects of the cooling rate on the grain size in Ti–6Al–4V and observed that the grain size is generally smaller at a faster cooling rate; however, further increasing over a certain cooling rate would not further reduce the grain size.
OM microstructures from Z-plane specimens: (a) SF 20, (b) SF 50, and (c) SF 65.
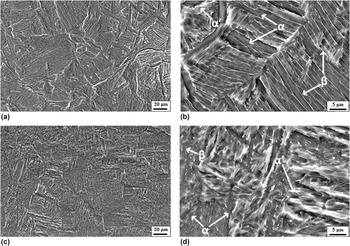
From this study, it is also noted that the SF 65 sample shows a larger percentage of α′, as evident in SEM micrographs from the Z-plane specimens (Fig. 9). During cooling, the transformation of equiaxed β grains that exist at high temperatures produces the Widmanstätten (α + β) structure. The αGB is also found to form along the grain boundaries of prior β grains. Because a higher cooling rate will result in increased martensite, as expected, more α′ is observed in the samples with a higher beam speed (SF 65), as shown in Fig. 9.
SEM micrograph from Z-plane specimens: (a, b) SF 20 and (c, d) SF 50.
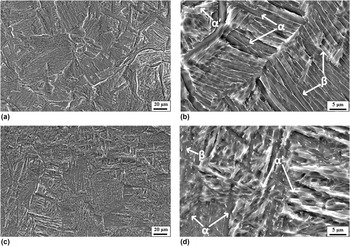
The microstructures from SEM micrographs (Fig. 9) exhibit the morphology of αGB and primary-α colony. It was reported that the size of α-laths ranges from 0.5 to 5 µm depending on different process conditions. Reference Al-Bermani, Blackmore, Zhang and Todd9,Reference Xi, Bermingham, Wang and Dargusch32 The cooling rate is the key factor to control the dimension of α laths, when Ti–6Al–4V alloy is cooled down from the β-transus temperature. Reference Bontha, Klingbeil, Kobryn and Fraser17,Reference Gockel, Beuth and Bourell30 The average thickness of the α-lath from different SFs is listed in Table II. The SF 20 sample has the α-lath thickness of 1.5 µm, while the α-lath thickness is about 1.0 µm for other SF cases. Murr et al. Reference Murr, Quinones, Gaytan, Lopez, Rodela, Martinez, Hernandez, Martinez, Medina and Wicker18 reported that the thickness of the α-lath is about 1.4–2.1 µm for EBAM-made Ti–6Al–4V parts. It is evident that a higher cooling rate (associated with SF 36, 50, and 65) results in a smaller lath size. At a higher cooling rate, a greater undercooling may lead to the formation of more α nuclei and result in smaller α-laths. The experimental results, however, indicated that the α-lath size does not decrease further even with a higher cooling rate increased from a beam speed of 376 to 689 mm/s. This may be attributed to that the size of α-lath is also affected by the size of prior β grains. Reference Safdar33 The α phase grows in a lamellar fashion inside of β grains, so the final α-lath size is also limited by the prior β grain size. Thus, the smaller the prior β columnar structure, the finer the α-lath during the subsequent solid-state transformation. Noted from Table II, the size of prior β grains is similar between the beam speed of 376 and 689 mm/s, implying that the size of prior β grains could be a factor that influences the α-lath size, which is very close for the beam speed ranging from 376 to 689 mm/s.
IV. CONCLUSIONS
Powder-bed EBAM is one of the metal AM technologies that are capable of making full density metallic components, especially of advantage to complex geometries and/or structures. However, the EBAM process is sensitive to the process parameters, which may cause variations in build part quality. In this study, the effects of the beam scanning speed on Ti–6Al–4V microstructures from EBAM were experimentally studied. Four levels of beam scanning speeds were tested in building EBAM samples, which were subsequently used to prepare metallographic specimens for observations and analysis. During the experiment, an NIR thermal imager was also used to acquire build surface temperature distributions, which was used for the melt tool size estimate. The major findings are summarized as follows.
-
(i) The X-plane (side surface) specimens show columnar prior β grains with martensitic structures. The measured width of columnar grains is in the range of about 40–110 µm for the beam speeds tested in this study. With the increase of the beam scanning speed, the width of the columnar grains tends to be smaller because of a higher cooling rate during solidification.
-
(ii) The Z-plane (scanning surface) specimens show equiaxed grains, in the range of 50–85 µm. The grain size from the lowest-speed sample (SF 20 case) is much larger than that of samples from higher beam speed cases. The microstructure inside of equiaxed grains is Widmanstätten (α + β).
-
(iii) In addition, increasing the scanning speed from 214 to 376 mm/s will result in finer α-laths. However, further increasing the beam speed, e.g., to 689 mm/s, will not further reduce the α-lath size.
-
(iv) From this study, a SF between SF 36 and SF 50 may result in fine microstructures without severe surface pores in the EBAM Ti–6Al–4V parts.
ACKNOWLEDGMENTS
This research is supported by NASA (award No. NNX11AM11A). Steven Price provided the temperature measurement results. XG also acknowledges AL EPSCoR GRSP for the financial support.