





Introduction
Climate change is transforming ecological and epidemiological systems by altering the environment and influencing interactions among organisms with consequences for human health (Rocque et al., Reference Rocque, Beaudoin, Ndjaboue, Cameron, Poirier-bergeron, Poulin-rheault, Fallon, Tricco and Witteman2021) and ecosystem functioning (Parmesan, Reference Parmesan2006). Changing global temperatures have affected the frequency and severity of disease outbreaks (Anikeeva et al., Reference Anikeeva, Hansen, Varghese, Borg, Zhang, Xiang and Bi2024), influenced host immunity (Catalán et al., Reference Catalán, Wozniak, Niemeyer, Kalergis and Bozinovic2012) and resulted in higher disease severity (Habibullah et al., Reference Habibullah, Din, Tan and Zahid2022). Indeed, host–parasite relationships may be particularly vulnerable to temperature changes (Gehman et al., Reference Gehman, Hall and Byers2018) as temperature can influence host–pathogen interactions in numerous and complex ways. For example, changing mean temperature can directly alter parasite development (Thomas et al., Reference Thomas, Ravishankaran, Justin, Asokan, Kalsingh, Mathai, Valecha, Montgomery, Thomas and Eapen2018), transmission (Shocket et al., Reference Shocket, Magnante, Duffy, Cáceres and Hall2019) and environmental persistence (Goedknegt et al., Reference Goedknegt, Welsh, Drent and Thieltges2015). Temperature can also act indirectly by influencing host behaviour (Batres and Perrett, Reference Batres and Perrett2020), immunity (Catalán et al., Reference Catalán, Wozniak, Niemeyer, Kalergis and Bozinovic2012) or modification of physical barriers in the host (Fedorka et al., Reference Fedorka, Copeland and Winterhalter2013). Moreover, temperature can drive shifts in host and parasite population trajectories over time, potentially altering outbreak dynamics (Auld and Brand, Reference Auld and Brand2017), population stability (Bruijning et al., Reference Bruijning, Fossen, Jongejans, Vanvelk, Raeymaekers, Govaert, Brans, Einum and De Meester2022) and long-term persistence (Gehman et al., Reference Gehman, Hall and Byers2018). Not only do rising global temperatures affect many aspects of host–pathogen interactions simultaneously, but they can also have opposing effects on different traits (McCartan et al., Reference McCartan, Piggott, DiCarlo and Luijckx2024). Beyond the impact of changes in rising mean temperatures, thermal variability represents an additional and critical dimension of climate change that can shape host–parasite interactions.
Climate change not only raises mean global temperatures but also increases the frequency, intensity and unpredictability of extreme temperature events such as heatwaves and cold snaps (Leahy et al., Reference Leahy, Gonzalez, Hickey, Kiely, Allen, Nowbakht and Pasik2021). Such extreme temperature events can have pronounced effects on host–pathogen systems, as both heatwaves and cold snaps may challenge the physiological limits of hosts and parasites (Kunze et al., Reference Kunze, Luijckx, Jackson and Donohue2022). For example, cold snaps can increase disease burden up to 5-fold or decrease it by 3-fold, depending on the baseline temperature (McCartan et al., Reference McCartan, Piggott, DiCarlo and Luijckx2024). Moreover, these temperature anomalies can destabilize population dynamics (Ragonese et al., Reference Ragonese, Sarkar, Hall and Altizer2024), alter epidemic cycles (Cheng et al., Reference Cheng, Bambrick, Yakob, Devine, Frentiu, Toan, Thai, Xu and Hu2020), or, in some cases, cause population crashes or regime shifts (Devkota, Reference Devkota2021). Yet, despite growing evidence of their ecological significance, the role of anomalous temperature events in shaping disease dynamics at the population level remains underexplored (Ragonese et al., Reference Ragonese, Sarkar, Hall and Altizer2024), especially in systems where temperature variability interacts nonlinearly with parasite transmission and host resilience.
Here, we examined the effect of heatwaves and cold snaps on disease dynamics in experimental populations of Daphnia magna infected with its microsporidian microparasite Ordospora colligata (a unicellular gut pathogen) across a broad temperature range. This study was based on previous work using the same host–pathogen system (Kunze et al., Reference Kunze, Luijckx, Jackson and Donohue2022; McCartan et al., Reference McCartan, Piggott, DiCarlo and Luijckx2024, Reference McCartan, O’keeffe, Zhang and Luijckx2025), which studied the effects of extreme weather events at an individual level. These studies found that even minor shifts in temperature lead to increased parasite performance, as suggested by the Thermal Variability Hypothesis (Rohr and Raffel, Reference Rohr and Raffel2010). Declines in performance under extreme thermal stress were also observed when temperatures exceeded their physiological limits, a pattern described by the Thermal Stress Hypothesis (Paull et al., Reference Paull, Raffel, LaFonte and Johnson2015). Moreover, these studies also showed differential thermal sensitivity of Daphnia and Ordospora, such that mismatches in performance optima favoured either the host or the parasite depending on environmental conditions, which conforms to the Thermal Mismatch Hypothesis (Cohen et al., Reference Cohen, Venesky, Sauer, Civitello, McMahon, Roznik and Rohr2017). These results indicate that temperature can profoundly and unpredictably alter infection outcomes at the individual level. These physiological and interaction-level responses can scale up to influence epidemic trajectories (Auld and Brand, Reference Auld and Brand2017), drive changes in host density (Ebert et al., Reference Ebert, Lipsitch and Mangin2000) and shift host–parasite distribution (Gsell et al., Reference Gsell, Biere, de Boer, de Bruijn, Eichhorn, Frenken, Geisen, van der Jeugd, Mason-jones, Meisner, Thakur, van Donk, Zwart and Van de Waal2023). Yet, how extreme temperature events influence disease dynamics at the population level relative to constant thermal conditions remains poorly understood despite their clear individual-level effects.
Materials and methods
Study system
Daphnia magna is a freshwater crustacean found across the Northern Hemisphere and is a key species in many aquatic ecosystems (Sarnelle, Reference Sarnelle2005). This is a popular model system for environmentally transmitted diseases (Kirk et al., Reference Kirk, Luijckx, Stanic and Krkošek2019); for example, due to their fast generation times, well-known ecology (Ebert, Reference Ebert2022) and parthenogenic life cycle (Ebert, Reference Ebert2005). Ordospora colligata is a microsporidian microparasite infecting D. magna and is horizontally transmitted to the host via filter feeding (Pombert et al., Reference Pombert, Haag, Beidas, Ebert, Keeling and Boothroyd2015). The parasite invades the upper gut epithelium, forming intracellular clusters of 32–64 spores, which burst and are shed into the water via feces (Ebert, Reference Ebert2005). Moreover, Daphnia have a wider thermal range of 6–33.3 °C compared to Ordospora’s narrower range of 11.8–29.7 °C (Kirk et al., Reference Kirk, Jones, Peacock, Phillips, Molnár, Krkošek and Luijckx2018), which may cause temperature shifts that disproportionately affect one of the antagonists. Here, D. magna genotype Fi-OER-3-3 and O. colligata isolate 3 were used, originally sampled from Tvärminne, Finland, and both have been maintained in laboratory cultures for at least 10 years.
Experiment design
To determine whether extreme weather can alter disease dynamics in the Daphnia–Ordospora system, a factorial experimental design was used, testing 2 temperature regimes (constant and pulse) at 4 baseline temperatures (14, 17, 20 and 23 °C). A fully factorial design was infeasible due to the limitations of manpower and space in the laboratory. The baseline treatments were chosen in line with previous individual-level experiments by McCartan et al. (Reference McCartan, Piggott, DiCarlo and Luijckx2024) and McCartan et al. (Reference McCartan, O’keeffe, Zhang and Luijckx2025). All pulse treatments occurred 8 weeks after the experiment began (Figure 1). Temperature pulses either consisted of a heatwave or a cold snap, depending on the baseline temperature, with lower temperatures experiencing a heatwave (14 and 17 °C) and higher temperatures a cold snap treatment (20 and 23 °C). A heatwave treatment increased the temperature by +6 °C for 10 days, while a cold snap decreased by –6 °C for 10 days relative to the baseline temperature. The pulse of ±6 °C was chosen as it reflects the limits of naturally occurring fluctuations in the rockpools inhabited by Daphnia (Jocque et al., Reference Jocque, Vanschoenwinkel and Brendonck2010). Moreover, the 10-day pulse duration was chosen to allow population-level demographic responses to emerge while remaining representative of acute thermal extremes. Other studies using similar Daphnia sp. have also employed similar pulse durations (Xiao and Wang, Reference Xiao and Wang2025; Backenstose et al., Reference Backenstose, Nalesnik, Bui, Ciubotariu, Searle and Christie2026). While this study explores thermal pulses pushing the temperature towards the thermal optima for the host and parasite, the opposite could also have been examined, where thermal pulses push the temperature away, causing extreme conditions for the host and parasite, which is also a natural, plausible scenario.
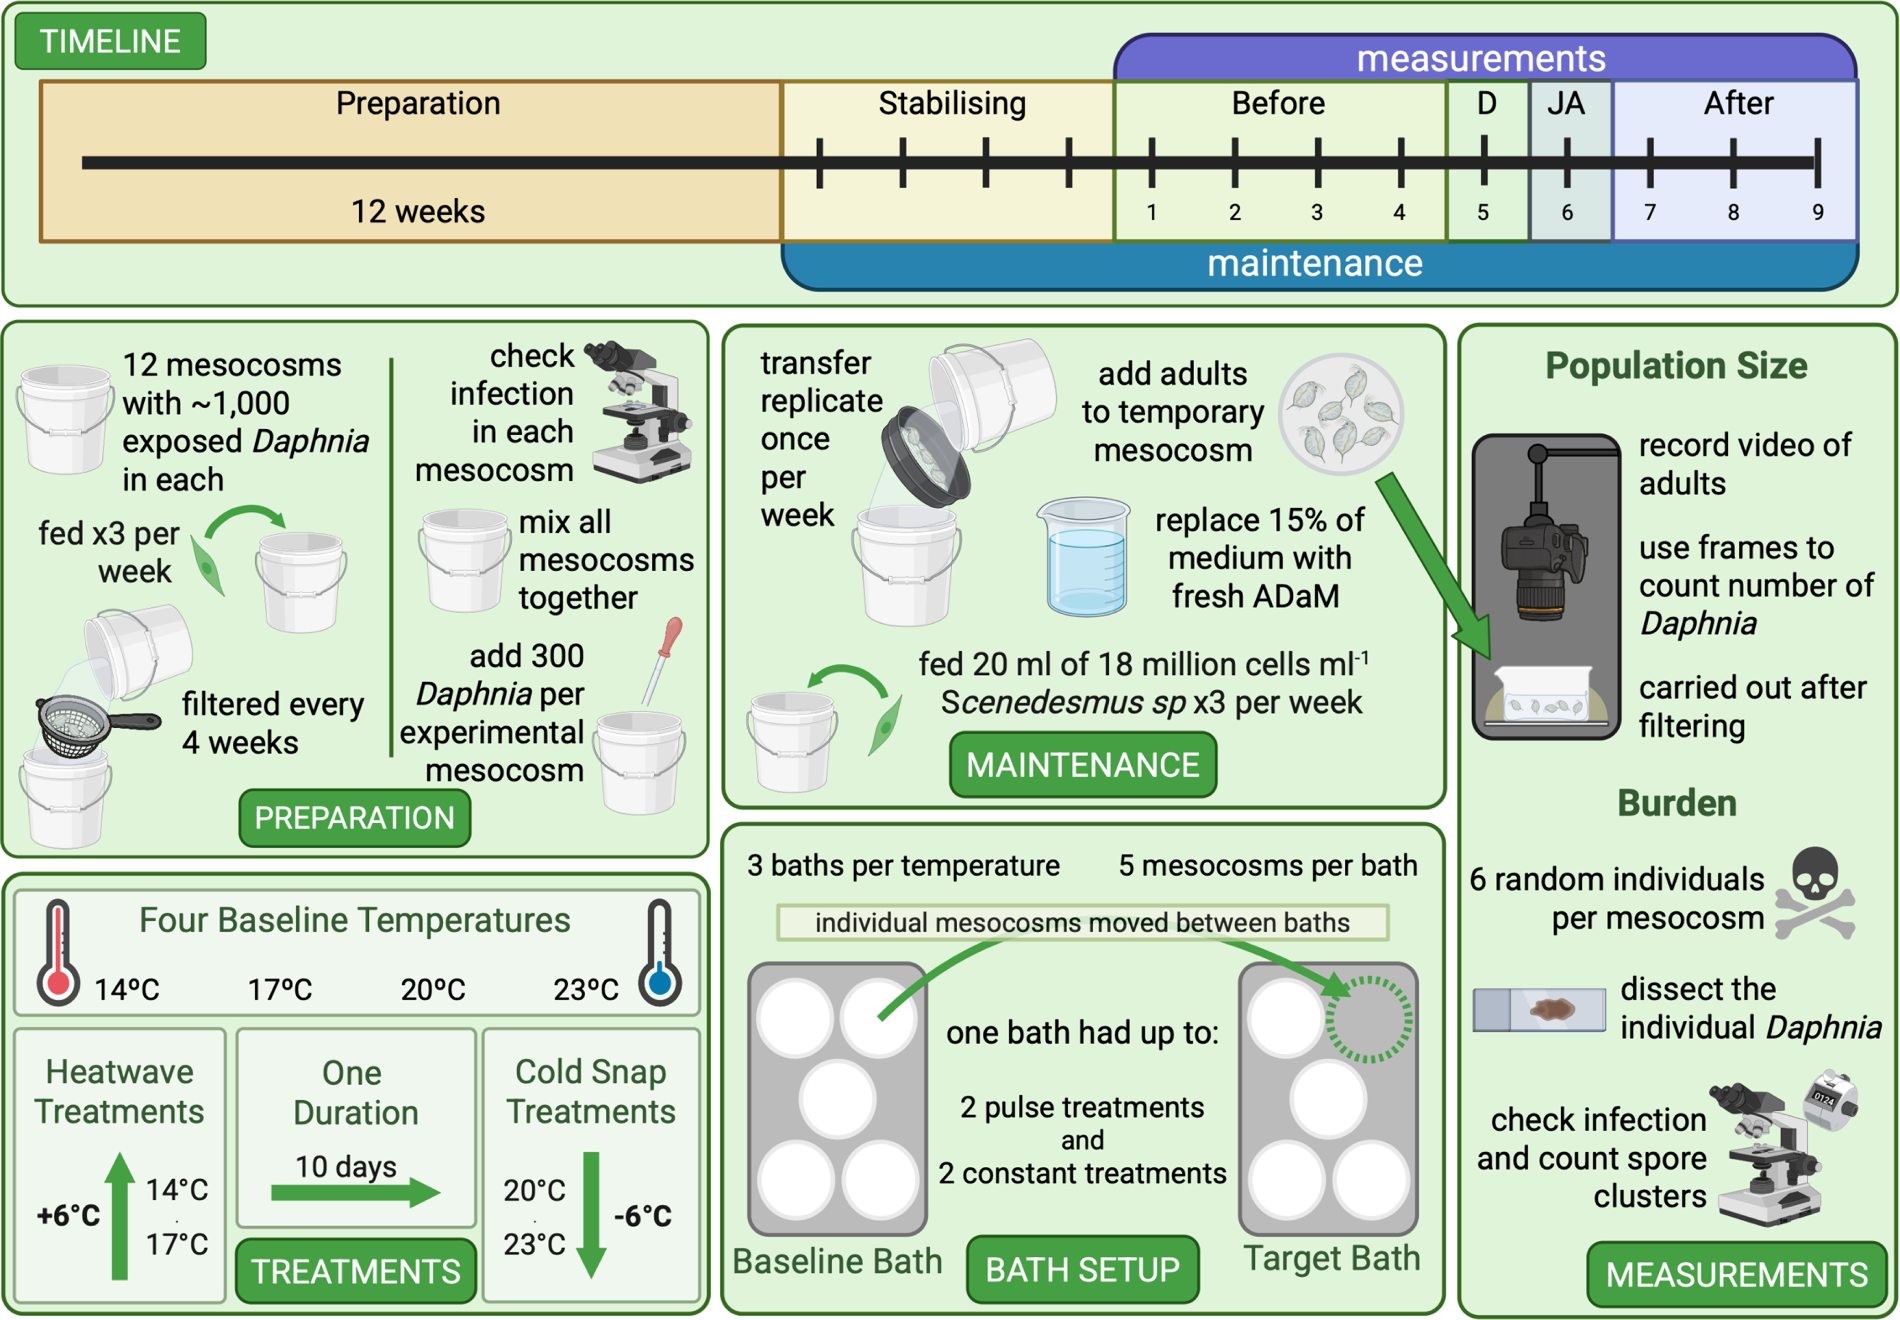
Experimental setup. Showing the timeline of the experiment, including the preparation and experimental setup, treatments, maintenance and measurements. Figure created on BioRender.com.

Figure 1 Long description
TIMELINE; illustrates the timeline with twelve weeks of preparation, four weeks of stabilising, and nine weeks of measurements. The pulse treatment began on week four, and measurements for during (D) the heatwave occurred in week five. All pulse treatments ended after 10 days, so the counts occurring in week six were just after the pulse treatment (JA). PREPARATION; preparation started twelve weeks prior to exposure when ∼ 1,000 exposed Daphnia were added to 2 L mesocosms, the week before the experiment began, all mesocosms were checked for infections and then mixed together. From this mix, 300 Daphnia of varying sizes were added to an experimental mesocosm. Replicate one began on day one, and then the next replicate began the day after to stagger maintenance and measurements. TREATMENTS; eight treatments were included in the experiment (four baseline temperatures • two heatwaves • two cold snaps), and all baseline temperatures also had constant controls. Each treatment had five replicates. BATH SETUP; each temperature had three baths, and each bath held five mesocosms. A bath contained up to two pulse treatments and two constant treatments. To simulate a pulse treatment mesocosms were moved between baths and then returned to the baseline bath when the pulse treatment was finished. MAINTENANCE; maintenance was carried out once a week when the Daphnia were filtered to remove debris and 15% of the medium was changed for fresh medium. MEASUREMENTS; adults Daphnia were separated from the rest of the population by sieving into a temporary mesocosm and two videos were taken for population size analysis. On the same day, six Daphnia from the mesocosm were dissected to check for infection.
When the mesocosms were transferred between baths for the pulse treatment, the temperature within the mesocosms would reach the target temperature within an hour. Such a gradual transition is consistent with the rapid thermal dynamics observed in shallow rock pools, where water temperature can change markedly over the course of hours because of their small volume (Jocque et al., Reference Jocque, Vanschoenwinkel and Brendonck2010). Once the pulse concluded, it was returned to its original baseline temperature. In total, there were 8 treatments (2 temperature regimes × 4 baseline temperatures), each with 5 replicates, for a total of 40 populations (Figure 1). Following other work which successfully detected differences between populations of Daphnia, 5 replicates per treatment were used (Van Doorslaer et al., Reference Van Doorslaer, Stoks, Swillen, Feuchtmayr, Atkinson, Moss and De Meester2010; Krichel et al., Reference Krichel, Kirk, Pencer, Hönig, Wadhawan and Krkošek2023). Every replicate started with a population of 300 Daphnia, kept in a 5 L mesocosm (filled with 2 L of Artificial Daphnia Medium (ADaM; Klüttgen et al., Reference Klüttgen, Dülmer, Engels and Ratte1994)), in which infection was well established. Temperature was manipulated by placing each of the mesocosms into temperature-controlled water baths. There were 3 baths per baseline temperature, and treatments were spread between baths.
Temperature-controlled water baths
To maintain a constant temperature within each bath, the 12 water baths were regulated with an aquarium chiller (Hailea HC-150A, DC300 or DC750), a heater (EHEIM JÄGER 300 W), pumps (Micro-Jet Oxy and Oase Optimax 500) and a programmable controller (Inkbird ITC-308 or ITC-310T). Temperatures in each bath were continuously monitored daily using a HOBO logger (HOBO UA-001-08). While pumps ensured a uniform temperature distribution, mesocosms were also rotated clockwise daily to negate any temperature variation within the baths. To simulate temperature pulses (i.e. heatwaves or cold snaps), population mesocosms were moved between designated baths, while the baths were maintained at a constant baseline temperature.
Daphnia preparation
To prepare for the experiment, 12 large populations of Daphnia (∼12 000 animals) exposed to Ordospora were set up 12 weeks prior to the beginning of the experiment. Each of these populations was fed Scenedesmus sp. algae ad libitum, and debris was removed using a filter once a month. Right before the beginning of the experiment, the presence of the pathogen was verified in each population. Then, all animals were pooled and mixed to ensure uniform exposure across populations before redistribution. To set up each of the 40 experimental populations, 300 Daphnia of different developmental stages were added to a 5 L mesocosm with 2 L of ADaM and fed 360 million algae. The replicates were staggered, so all replicate-1 populations began on day 1 (i.e. 8 populations), then all replicate-2 populations began on day 2, and so on. Populations were maintained for 4 weeks after initialization to stabilize before measurements of burden and population size were taken.
Population maintenance
To maintain healthy populations and ensure consistent environmental conditions across treatments, mesocosms were maintained every 7 days. Before filtering a population, any large debris was removed from the mesocosm manually using a pipette. The population was sifted twice, once through a 1320 µm mesh to catch all adults and larger debris, then through a fine mesh (200 µm) to separate adults and juveniles. Fifteen per cent of the original medium was replaced with fresh ADaM (i.e. 300 mL of fresh ADaM, 1700 mL of original ADaM) (Figure 1). This medium was then used to gently wash the adult Daphnia away from the mesh into a temporary mesocosm while keeping the remaining debris caught in the mesh. When measurements were completed, the adult Daphnia were added back in with the remaining population. Feeding occurred 3 times a week when mesocosms received 20 mL of 18 million algae mL−1.
Measurement of population size and parasite fitness
To test population size in response to temperature and pulse treatments, measurements of population size and parasite fitness were conducted weekly after populations were stabilized. Immediately after filtration over the 1320 µm mesh during maintenance, the population sizes of the adult females were recorded. A Canon 2000D camera was mounted on a tripod with the lens positioned 15 cm above a 2 L semi-transparent container. A flat light box was placed beneath the container to illuminate individuals from below and increase contrast. Adult Daphnia from the temporary mesocosm were transferred to the container, and the camera zoom was adjusted to fill the frame (Figure 1). Two 4 second videos were recorded per set of adults. After recording, all Daphnia were returned to their mesocosm and placed back in the water bath. All videos were analysed for population counts using the R package ‘trackdem’ (Bruijning et al., Reference Bruijning, Visser, Hallmann and Jongejans2018). This package works by subtracting moving particles from the background. The package uses images captured from a video, which were extracted using the application ‘ffmpeg’ in the computer terminal. Two frames per second were captured from the 4-s videos. The channel used was blue, and the average threshold used was −0.12. Any remaining Daphnia that the software did not detect were manually counted.
To measure parasite proliferation, on the same day, population size was quantified; 6 adult Daphnia of varying sizes per mesocosm were sampled. Infection prevalence (i.e. presence or absence of spores) and burden (i.e. the number of spore clusters in the host) of O. colligata were recorded. If infected, spore clusters (each cluster holding up to 64 individual spores) were counted using bright-field or phase-contrast microscopy (with 400× magnification). Any males (n = 1) or inconclusive infections (n = 6) were omitted from the analysis. After 9 time points (weeks) of data collection, the experiment concluded.
Data analysis
Analysis was performed using R version 4.4.1 (R Core Team, 2024). The response variables were burden (i.e. the number of Ordospora spore clusters, including zeros for uninfected exposed individuals) and population size (i.e. the mean count of adults from population videos). For both models, pulse treatments were compared to constant treatments, and ‘period’ was a factor which included the different time points in the experiment: before pulse (weeks 1–4), during pulse (week 5), just after pulse (week 6) and after pulse (weeks 7–9). This structure allowed for an extended before-after-control-impact design to compare temporal responses between pulse and constant treatments (Underwood, Reference Underwood1994). ‘Mesocosm’ was included as a random effect to account for batch-specific variability; the remaining variables were fixed effects. Models were run separately for each baseline temperature (14, 17, 20 and 23 °C), with each model comparing the pulse treatment to its matched constant at the same baseline temperature. This approach avoided missing-cells design issues and allowed temperature-specific inference. A generalized linear mixed model (GLMM) with a negative binomial link function was fitted to all burden and population size models using the ‘glmmTMB’ package (Brooks et al., Reference Brooks, Kristensen, van Benthem, Magnusson, Berg, Nielsen, Skaug, Maechler and Bolker2017) to account for overdispersion in count data and batch-specific effects. An analysis of deviance (type II Wald chi-square test) was then used to investigate the significance of the predictor variables. Custom contrasts were created with the ‘emmeans’ package (Lenth, Reference Lenth2022) to compare treatments in both burden and population size. For this, ‘emm’ models were created from each temperature-specific model. Each constant period was compared to the corresponding pulse period, and each pulse period was compared to the ‘before’ pulse period. The contrast P-values were adjusted using the ‘Benjamini–Hochberg’ method for multiple comparisons (Benjamini and Hochberg, Reference Benjamini and Hochberg1995).
To observe density dependence, only the constant treatments were used to remove any variation which may have arisen in the pulse treatments. The mean of each population size per mesocosm per week was used to account for differences in sample size between burden counts (6 per mesocosm per week) and population size (2 counts per mesocosm per week). The mean was then pasted back into the dataset for each burden count. Overall density dependence was modelled using temperature, with a quadratic polynomial to account for curvilinearity, and was centred to avoid convergence issues. The response variable was burden, and the fixed effects were adults (mean), week and temperature, with a random effect of mesocosm. Temperature-specific density dependence models were then fitted using a generalised linear model GLM with a negative binomial distribution, as mixed models failed to converge, likely due to near-zero between-bucket variance when data were aggregated to weekly means.
The population-level results were then compared to individual-level findings from previous papers by McCartan et al. (Reference McCartan, Piggott, DiCarlo and Luijckx2024) and McCartan et al. (Reference McCartan, O’keeffe, Zhang and Luijckx2025). Data that were comparable to the population-level results were extrapolated from both datasets. Specifically, for heatwave data, the data taken were from the baseline temperatures of 14 and 17 °C, where constant temperature data and heatwave treatments occurred on day 0 (day of infection) and lasted for 6 days with an amplitude of +6 °C. For cold snaps, the data taken were from the baseline temperatures of 20 and 23 °C. Here, constant temperature data were also used, and the cold snaps lasted for 6 days with an amplitude of −6 °C. A custom contrast was then created, where pulse and constant treatments were compared to each other within the same experiment. The contrast P-values were adjusted using the ‘Benjamini–Hochberg’ method for multiple comparisons.
Results
Parasite fitness is influenced by temperature and type of pulse treatment
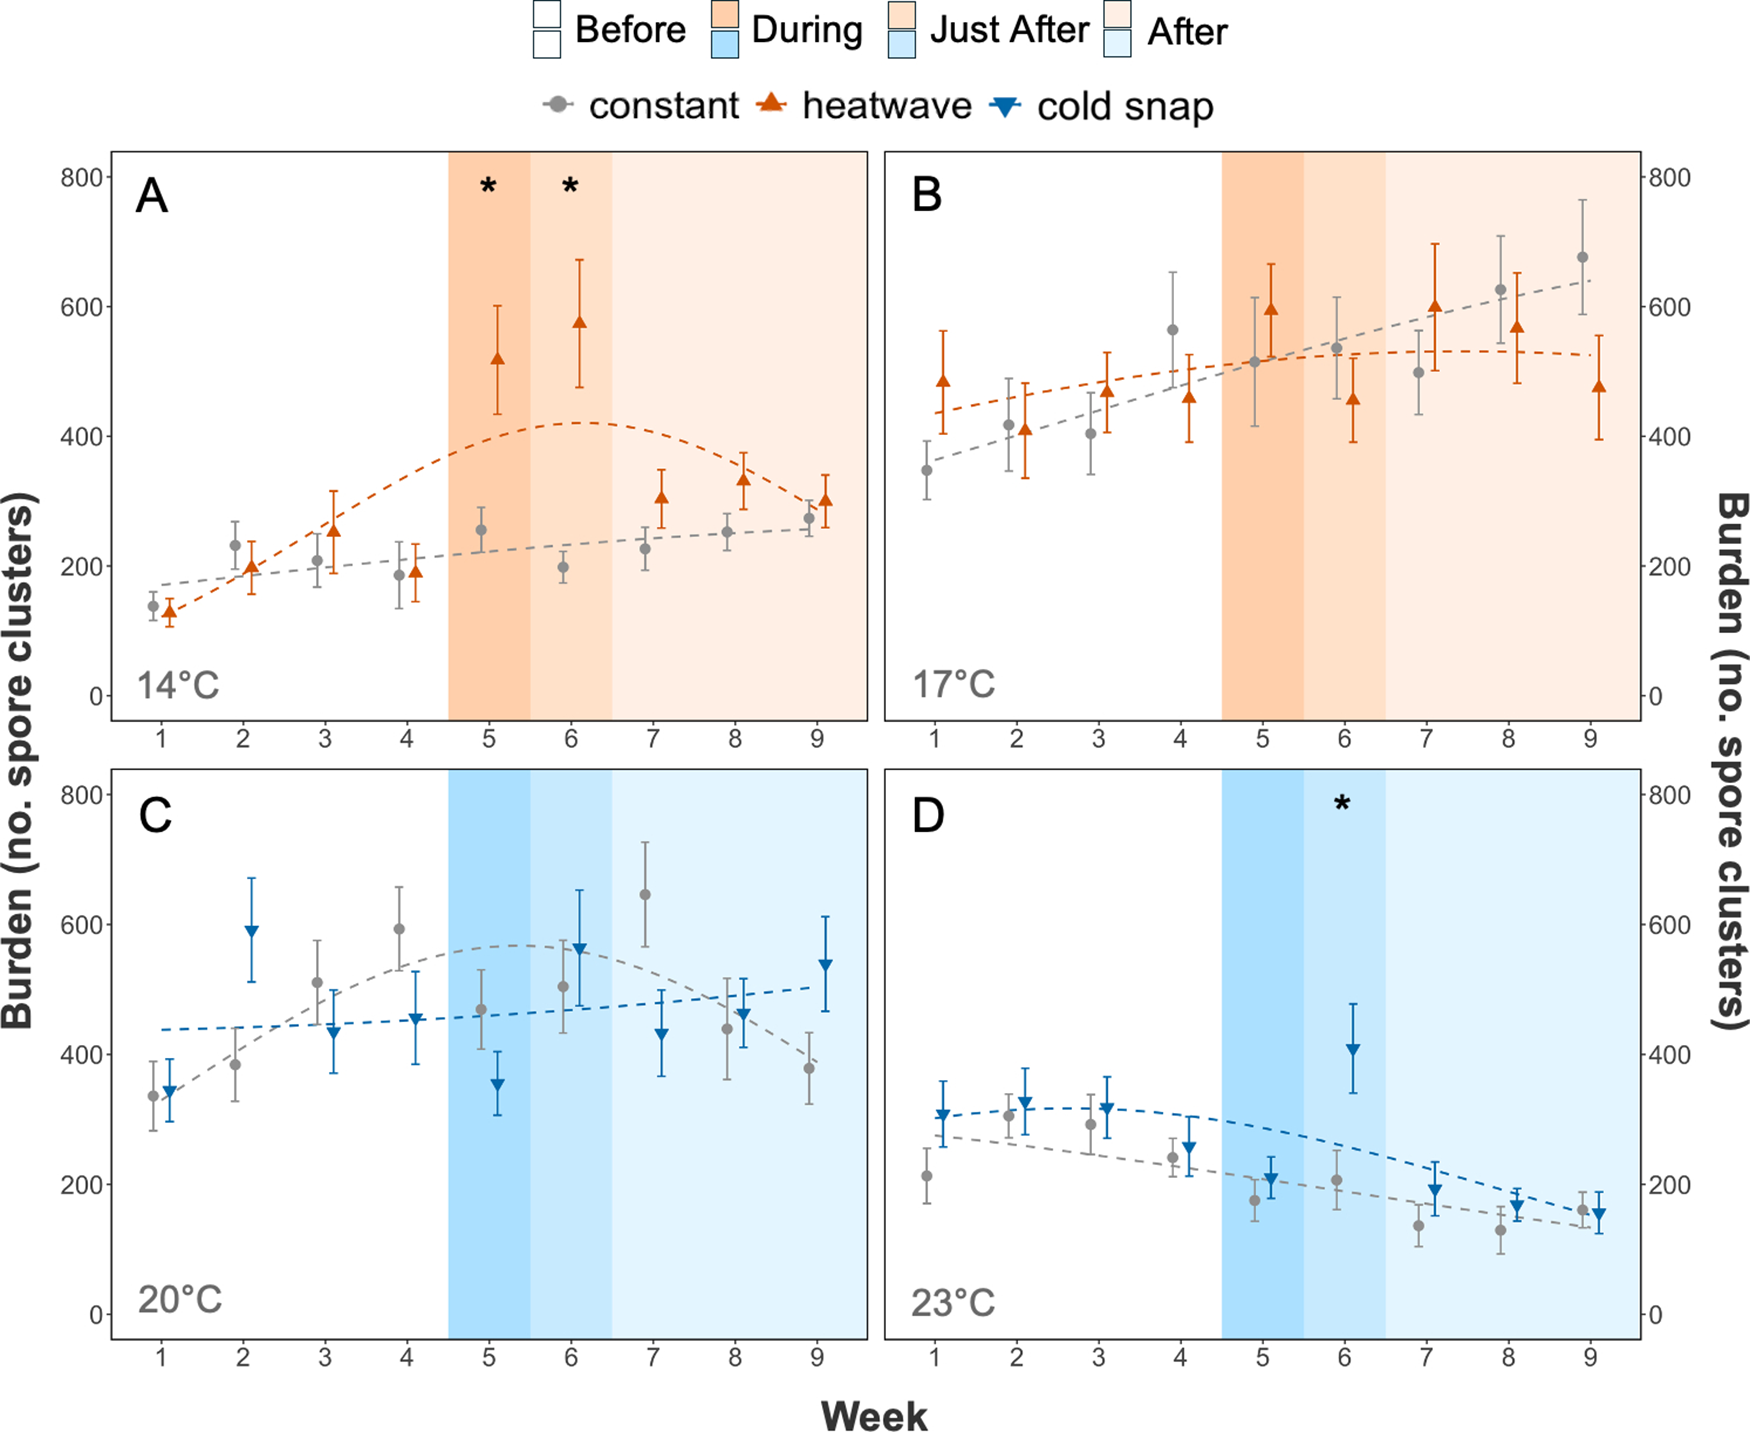
The prevalence of infection was nearly 100% in all Daphnia populations, while burden differed between treatments. Extreme temperature variation (i.e. a pulse treatment) altered proliferation by up to 2.9-fold, depending on the baseline temperature and the timing relative to the event (Figure 2). Specifically, the mean burden of the heatwave treatment was higher during a heatwave and remained higher for 1 week after, at a baseline temperature of 14 °C (Figure 2A) (518 vs 256 and 574 vs 198 spore clusters, respectively, emmean, z(inf) = −0.66, P = 0.022, and emmean, z(inf) = −0.82, P = 0.008, see Table S3 for P-values of all custom contrasts). Therefore, at low baseline temperatures, there is a short-term increase in burden (14 °C, Type II Wald χ 2(3) = 10.657, P = 0.014, Table 1A, Figure 2). That extreme temperature can influence the outcome of parasite fitness is also relevant to cold snaps, as the burden increased just after the cold snap occurred (week 6) at a baseline temperature of 23 °C (409 vs 207 spore clusters) (Figure 2D) (emmean, z(inf) = −1.526, P < 0.001, see Table S3). Thus, at higher baseline temperatures, a cold snap also results in a short-term effect on burden (23 °C, Type II Wald χ 2(3) = 11.082, P = 0.011, Table 1D, Figure 2). However, at baseline temperatures of 17 and 20 °C, extreme temperature events did not alter the burden in the populations during any period (no contrasts were significant; see Table S3 for a full list of contrasts). Thus, not all extreme temperature events will lead to the same changes in disease outcomes, and the outcome is dependent on the baseline temperature and time in relation to the pulse event. Together, these results demonstrate that the effects of thermal extremes on parasite burden are highly context-dependent and temporally dynamic, varying with both baseline temperature and the timing of the event.
Temporal effects of pulse temperature treatments on burden in O. colligata burden in D. magna. Mean burden (number of spore clusters; including zeros for exposed but uninfected hosts) is shown across 9 weeks at 4 baseline temperatures: (A) 14 °C, (B) 17 °C, (C) 20 °C and (D) 23 °C. Error bars show standard error, and dashed lines represent quadratic fits from a GLMM (Table 1A). Treatments are constant (grey), heatwave pulse (orange) and cold snap pulse (blue). Shaded regions indicate experimental periods: before (white), during (orange/blue), just after (lighter orange/blue) and after (lightest orange/blue). Asterisks (*) denote significant differences between pulse and constant treatments within specific periods (emmeans contrasts; Table S3).

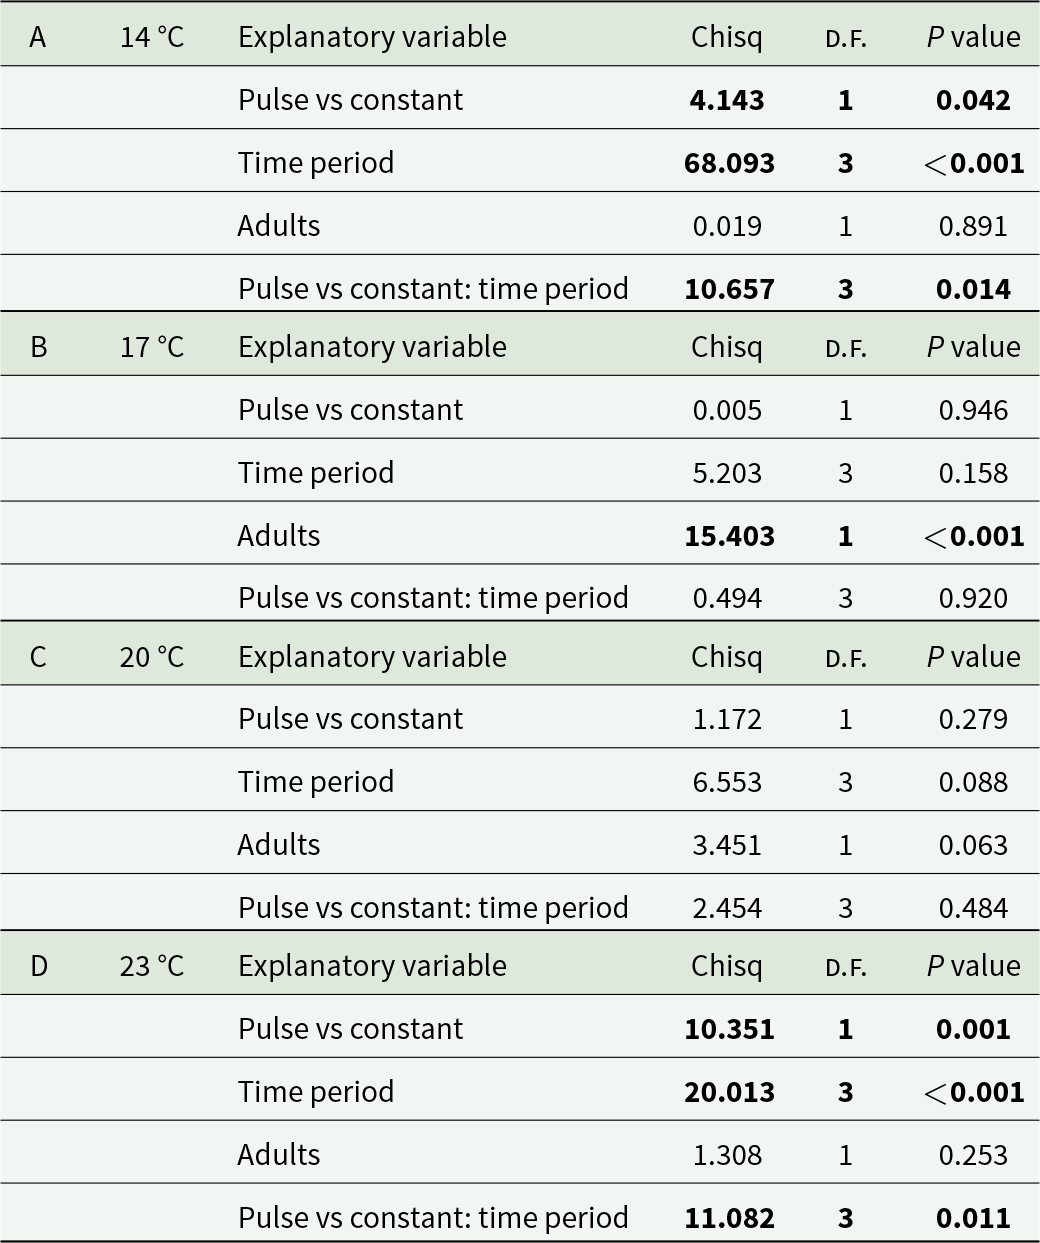
Type II Wald chi-square test results for the GLMM analysing burden (mean number of spore clusters, including zeros for uninfected but exposed hosts) in D. magna infected with O. colligata. A: 14 °C, B: 17 °C, C: 20 °C and D: 23 °C. The GLMM included fixed effects of pulse vs constant treatment, time period (relative to a heatwave or cold snap), and population size, with a random effect of mesocosm. See Table S1 for GLMM outputs

Table 1 Long description
Type II Wald chi-square test results for the generalised linear mixed model (GLMM) analysing burden (mean number of spore clusters, including zeros for uninfected but exposed hosts) in Daphnia magna infected with Ordospora colligata. A; 14°C, B°C; 17°C, C; 20°C, and 23°C. The GLMM included fixed effects of pulse vs constant treatment, time period (relative to a heatwave or cold snap), and population size, with a random effect of mesocosm.
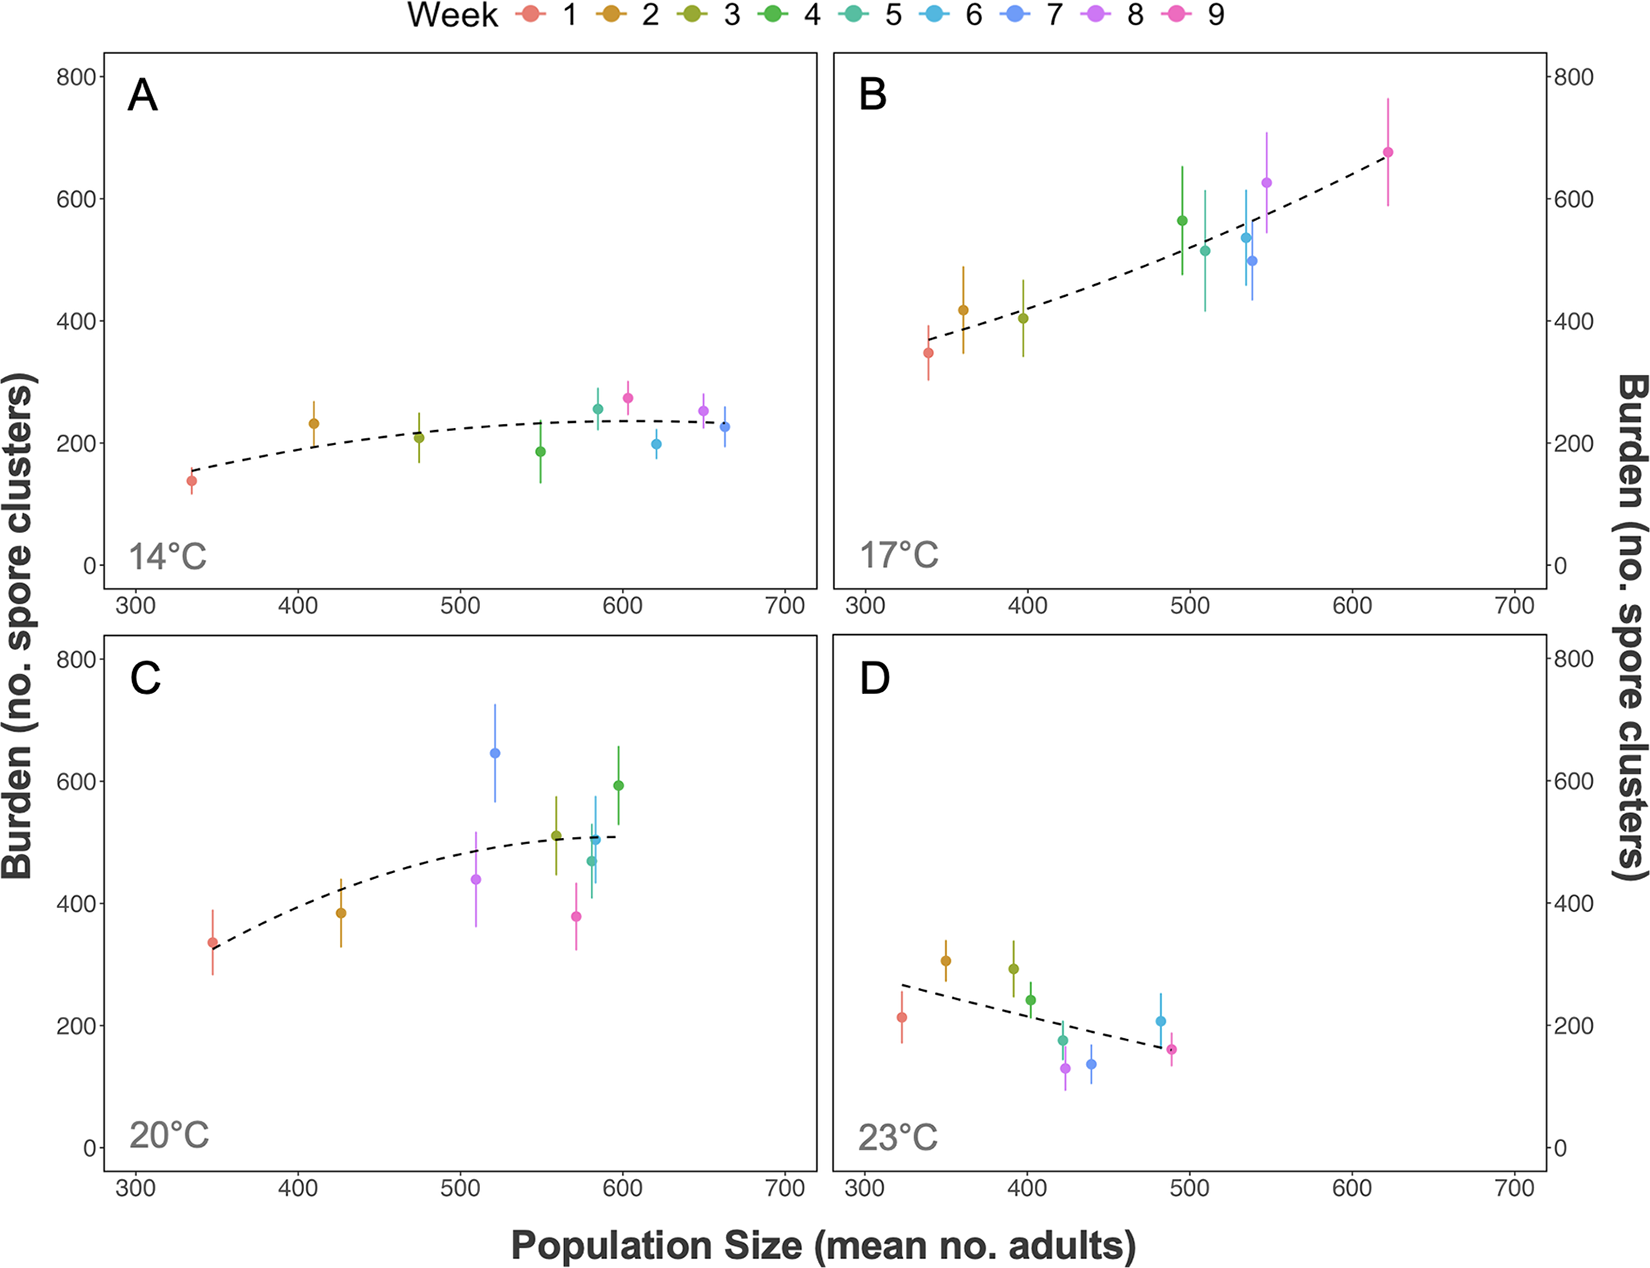
Population size was an important predictor of parasite burden, with the strength of this relationship varying with baseline temperature (GLMM, Type II Wald χ 2(2) = 7.277, Table S4B). At 20 °C, larger populations were associated with higher parasite burden (GLM, Estimate = 0.004, P = 0.005, Table S5C, Figure 3C), though this positive relationship weakened over the course of the experiment (GLM, Estimate = −0.0008, P = 0.004), suggesting a saturation of the density–burden relationship, potentially reflecting resource limitation at higher population densities. The positive association between population size and parasite burden observed at intermediate temperatures was not maintained at 23 °C, where the relationship varied across experimental weeks (GLM, Estimate = −0.0008, P = 0.034, Table S5D, Figure 3D). At 17 °C, a positive correlation between population size and burden was present (Pearson’s r = 0.21, P = 0.001, Figure 3B), though this was not significant in the negative binomial model, likely reflecting high between-mesocosm variance at this temperature. No significant density dependence was detected at 14 °C under constant temperature conditions (Figure 3A). Thus, baseline temperature modulates the relationship between host population size and parasite burden, with saturation at intermediate temperatures and uncoupling at thermal extremes.
The effect of population size on burden in D. magna infected with O. colligata. Parasite burden (mean number of spore clusters, including zeros for uninfected but exposed hosts) and population size were averaged across 9 weekly observations at 4 baseline temperatures: (A) 14 °C, (B) 17 °C, (C) 20 °C and (D) 23 °C. Error bars represent the standard error, and each dashed line is the fit of the generalized linear model (see Tables S4 and S5 for statistical results).

Population size varied with baseline temperature
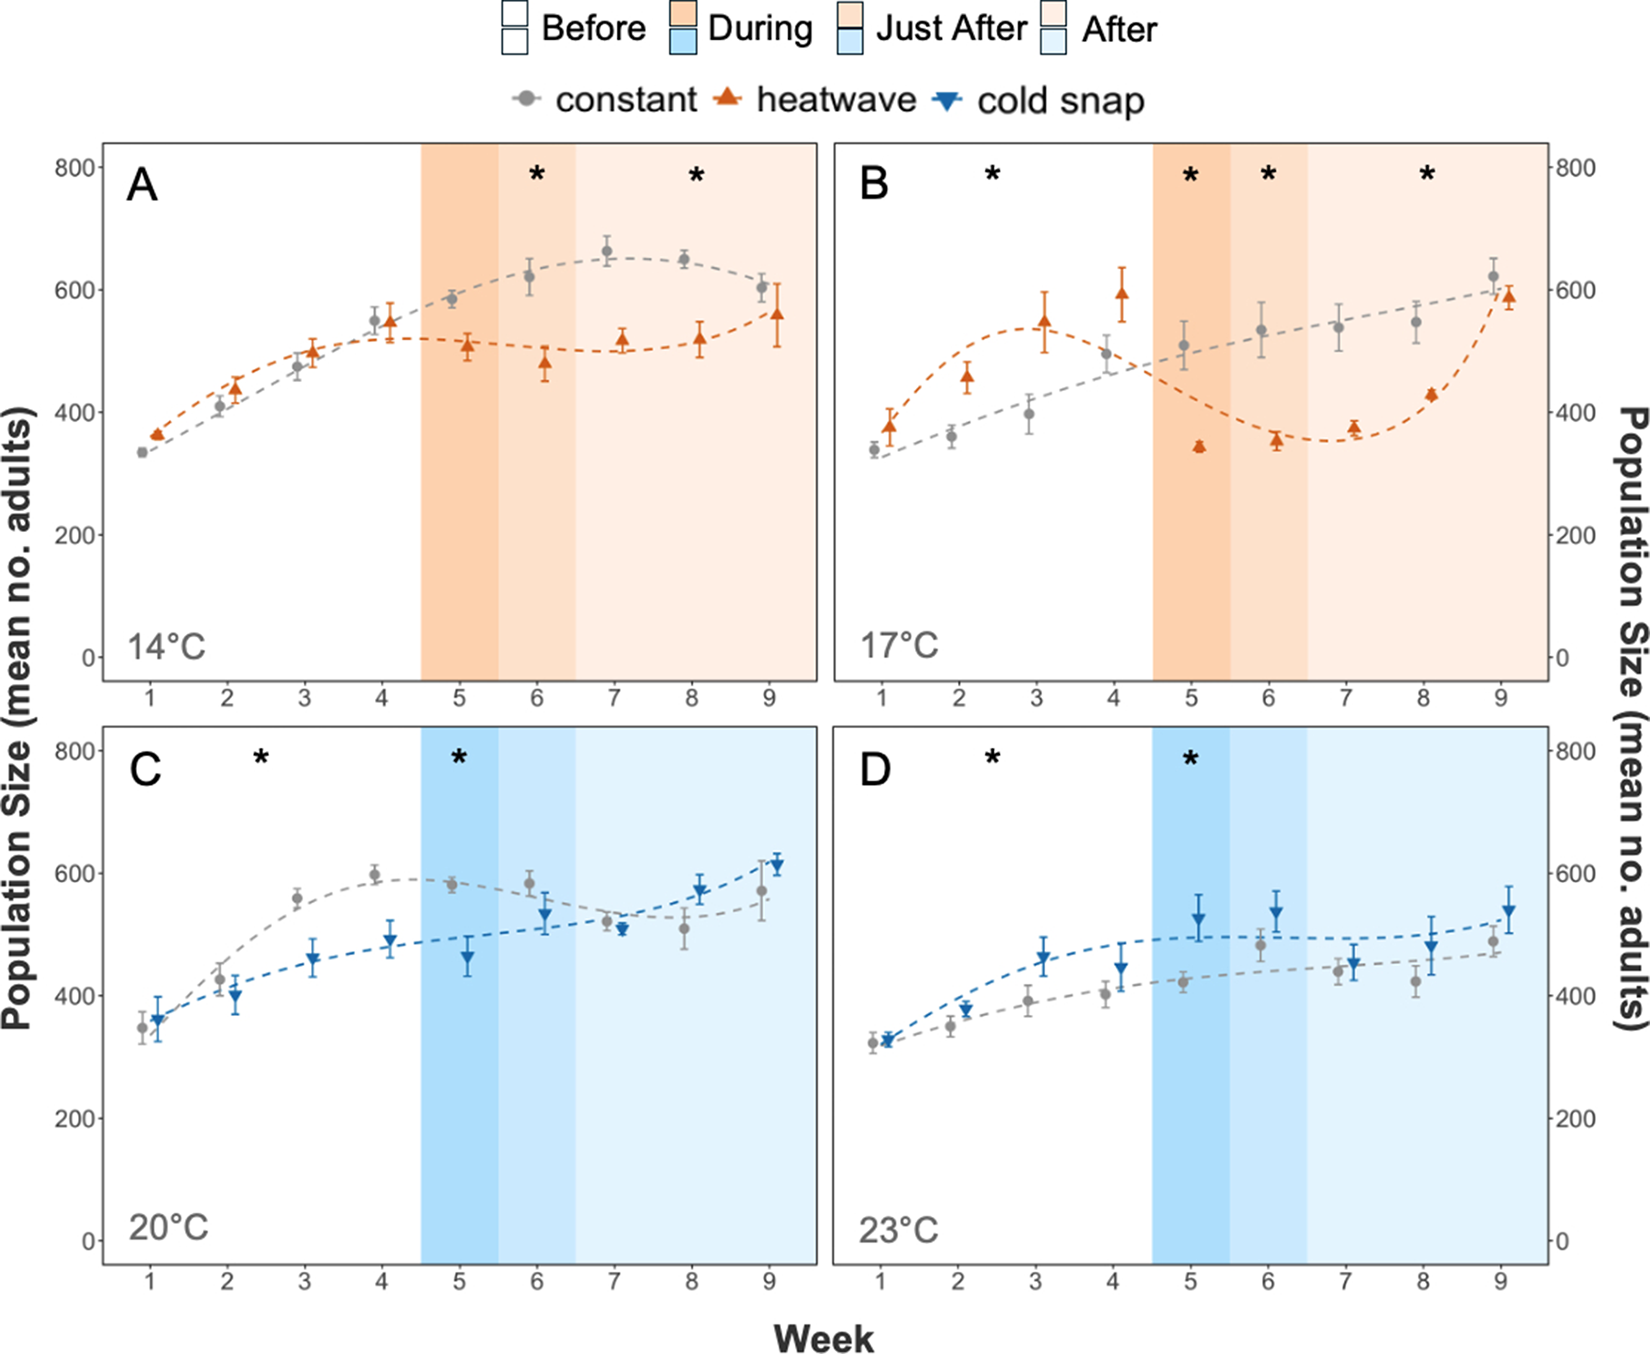
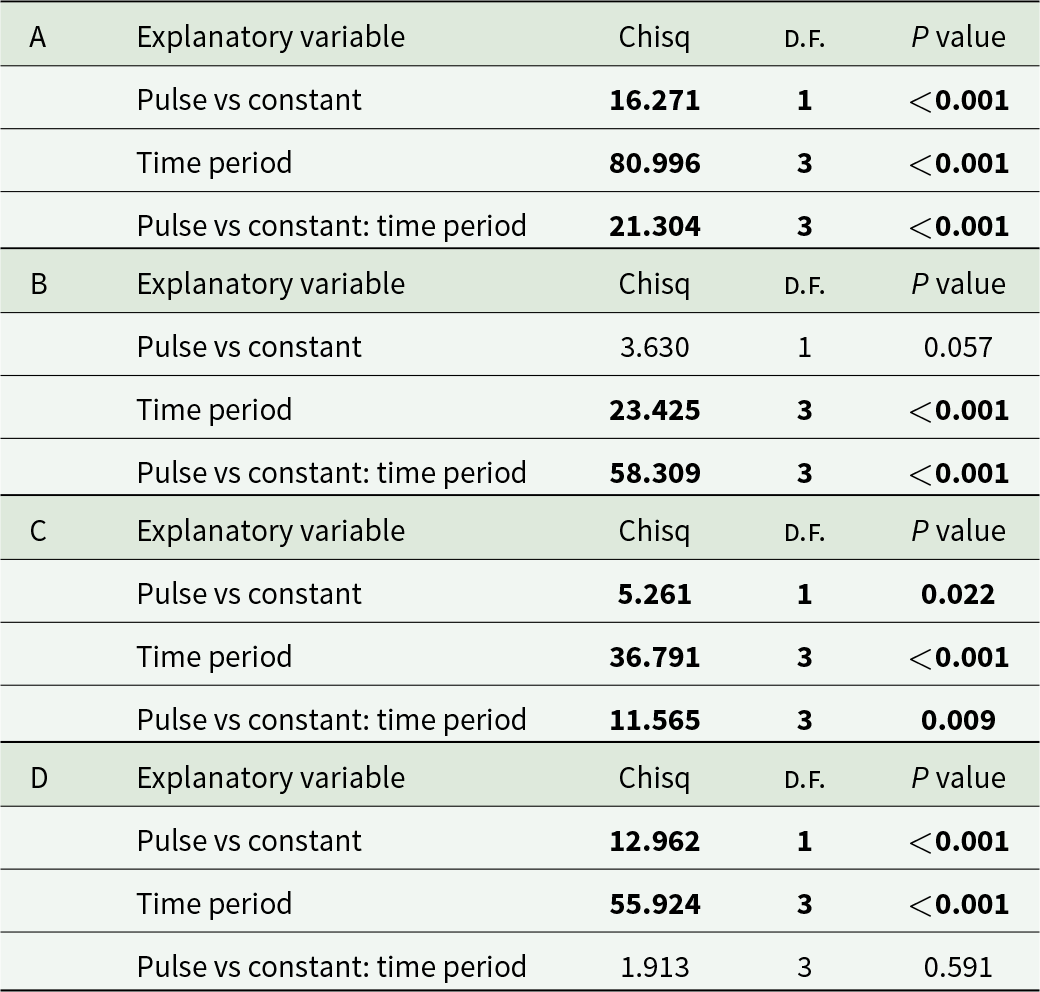
Like burden, host population size (number of adult females) in infected populations was influenced by baseline temperature, time in relation to the pulse event, treatment type (pulse or constant) and parasite burden. However, interpretation of the population-level responses is limited by pre-existing differences in population size between treatments at several baseline temperatures. Still, population size was altered by up to 1.5-fold depending on the timing in relation to the pulse event and baseline temperature (Figure 4). For example, at 17 °C, the population size in the pulse treatment during the period ‘just after’ a heatwave occurred (week 6) was reduced by 27% compared to constant temperature populations (Figure 4B) (emmean, z(inf) = 0.457, P < 0.001, see Table S8). Moreover, at 17 °C, all timings in relation to the pulse events resulted in differential outcomes in population size (emmean, constant before vs pulse before, z(inf) = −0.207, P < 0.001, constant during vs pulse during, z(inf) = 0.388, P < 0.001, and constant after vs pulse after, z(inf) = 0.198, P < 0.001, see Table S8). While the burden increased with a heatwave at 14 °C, the population size decreased in the periods ‘just after’ and ‘after’ the heatwave (emmean, z(inf) = 0.259, P = 0.003, and z(inf) = 0.200, P = < 0.001, respectively, Table S8). Although by the end of the experiment, the population size at 14 °C had gradually increased to levels similar to those in the constant treatment (Figure 4A). Cold snaps had a lesser effect on population size, with a decrease in population size at 20 °C (Figure 4C) (emmeans, z(inf) = 0.236, P = 0.017, Table S8). Overall, the timing in relation to the pulse event can influence population size mediated by baseline temperature, for example, at 14 °C (GLMM, Type II Wald χ 2(3) = 21.304, P < 0.001, and Table 2). However, it should be noted that pulse and constant treatments differed in population size prior to the pulse event at 17, 20 and 23 °C, which limits causal inference about the pulse effect at these temperatures. Conclusions are most robust at 14 °C, where pre-pulse population sizes were comparable between treatments. Still, all factors can influence the outcome of host population size.
Temporal effects of pulse temperature treatments on population size in D. magna infected with O. colligata. Mean population size (number of adults) is shown over 9 weeks at 4 baseline temperatures: (A) 14 °C, (B) 17 °C, (C) 20 °C and (D) 23 °C. Error bars indicate standard error, and dashed lines show cubic fits from a GLMM (Table S6). Treatments are constant (grey), heatwave (orange) and cold snap (blue). Shaded regions denote experimental periods: before (white), during (orange/blue), just after (lighter orange/blue) and after (lightest orange/blue). Asterisks (*) indicate significant differences between pulse and constant treatments within specific periods (emmeans contrasts; Table S8).

Type II Wald chi-square test results for the GLMM analysing population size in D. magna infected with O. colligata. A: 14 °C, B: 17 °C, C: 20 °C and D: 23 °C. The GLMM included fixed effects of pulse vs constant treatment and time period (relative to a heatwave or cold snap), with a random effect of mesocosm. See Table S7 for GLMM outputs

Table 2 Long description
Type II Wald chi-square test results for the generalised linear mixed model (GLMM) analysing population size in Daphnia magna infected with Ordospora colligata. A; 14°C, B°C; 17°C, C; 20°C, and 23°C. The GLMM included fixed effects of pulse vs constant treatment, and time period (relative to a heatwave or cold snap), with a random effect of mesocosm.
Population responses mirror those seen at the individual level
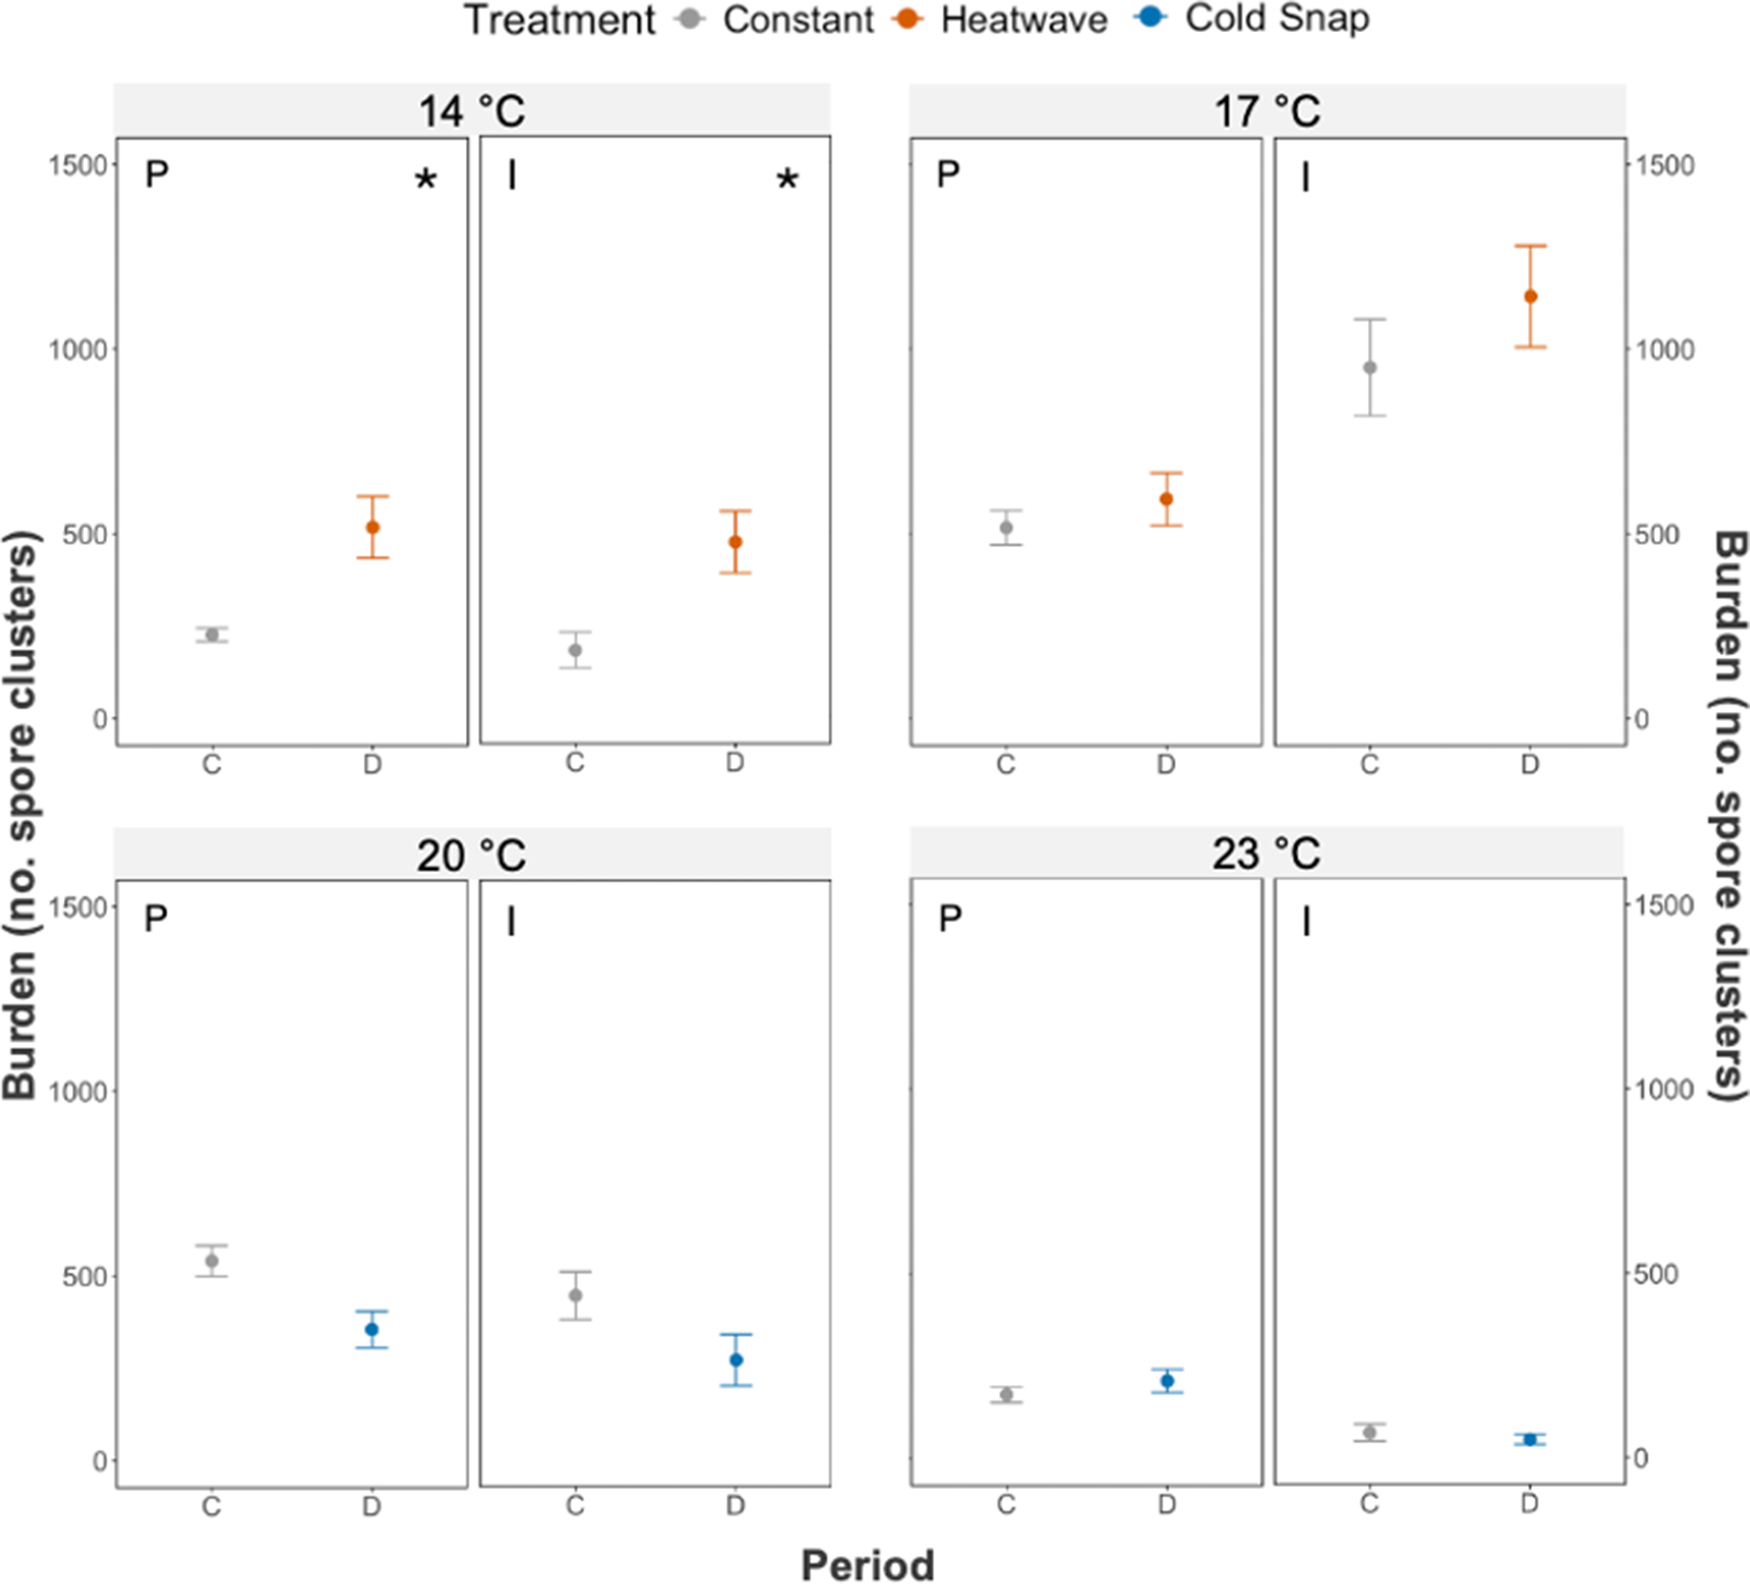
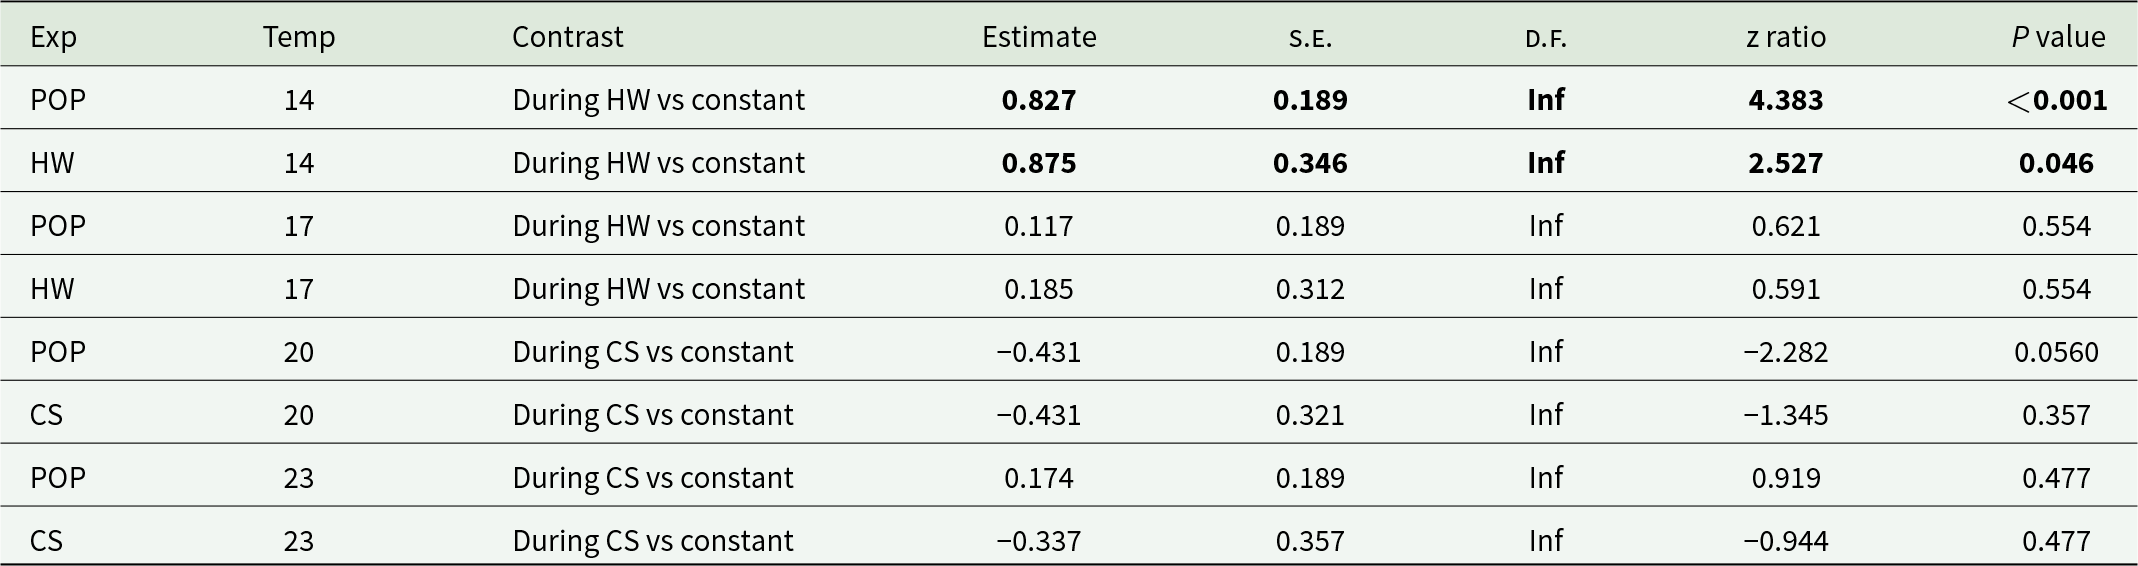
The effect of a pulse treatment was dependent on baseline temperature at both the population and individual level (Figure 5). For example, at 14 °C, both population and individual burden increase when a heatwave occurs (emmean, z(inf) = 4.383, P < 0.001, and z(inf) = 2.527, P = 0.046, respectively, Table 3). Trends were also similar, although less pronounced, at 17 °C, whereby the burden increased in the heatwave treatment at both the population and individual levels (Figure 5). Similarly, a cold snap can reflect patterns seen at both the population and individual levels and is dependent on baseline temperature, but the relationship was less consistent. For example, at 20 °C, both the population and individual burden decreased when a cold snap occurred (Figure 5). Therefore, individual-level exposure patterns may be reflected at the population level, particularly at lower temperatures, though the strength of this relationship varies across temperature treatments.
Comparison between effects of pulse and constant treatments on burden at individual and population scales in D. magna infected with O. colligata. Burden (number of spore clusters, including zeros for uninfected but exposed hosts) is shown over the 9 recorded weeks at 4 baseline temperatures: 14, 17, 20 and 23 °C. Error bars represent the standard error. Grey, constant treatment; orange, heatwave pulse treatment; blue, cold snap pulse treatment. (C) Constant (no pulse treatment) and (D) during the pulse period. An asterisk (*) indicates a significant relationship between the constant and pulse treatments at a given temperature and in the same experiment.

Custom contrasts for burden comparison between periods at both population and individual levels in D. magna infected with O. colligata. Each pulse treatment period was compared to its constant equivalent at the same temperature or to the ‘before’ pulse period. The response variable was burden, with uninfected but exposed hosts coded as zero. The ‘Inf’ degrees of freedom reflect the model’s complexity and the estimation process. Exp, experiment; CS, cold snap individual experiment; HW, heatwave individual experiment; POP, population experiment. Significant contrasts are bolded

Table 3 Long description
Custom contrasts for burden comparison between periods at both population and individual levels in Daphnia magna infected with Ordospora colligata. Each pulse treatment period was compared to its constant equivalent at the same temperature or to the ‘before’ pulse period. The response variable was burden, with uninfected but exposed hosts coded as zero. The ‘Inf’ degrees of freedom reflect the model’s complexity and the estimation process. Exp; experiment, CS; cold snap individual experiment, HW; heatwave individual experiment, POP; population experiment. Significant contrasts are bolded
Discussion
The effect of heatwaves and cold snaps on disease dynamics depended on both the baseline temperature and the nature of the fluctuation. Heatwaves and cold snaps produced short-term increases in parasite burden. Host population size (that is, infected populations) also changed with temperature, showing that environmental variation can shape demographic as well as infection dynamics. Parasite burden and host density were closely linked; at cooler temperatures, both increased together, whereas at warmer temperatures, higher host densities were associated with lower burdens. Understanding these dynamics is crucial, as temperature-induced changes in infection levels and host population size can have cascading effects on ecological processes and disease transmission (Gsell et al., Reference Gsell, Biere, de Boer, de Bruijn, Eichhorn, Frenken, Geisen, van der Jeugd, Mason-jones, Meisner, Thakur, van Donk, Zwart and Van de Waal2023).
Burden and population size
Parasite burden and population size were not independent; rather, their relationship varied with baseline temperature, consistent with interactive effects of ecological context on disease dynamics. Larger host populations generally supported higher numbers of pathogens, consistent with density-dependent transmission dynamics (Hu et al., Reference Hu, Nigmatulina and Eckhoff2013), where increased host density facilitates more frequent contact between infected and susceptible individuals. However, at higher temperatures (23 °C), this positive relationship was absent, and larger populations showed progressively lower burden over time. This suggests that high temperatures may disrupt transmission dynamics, resulting in decreased burden at higher densities. Several mechanisms could contribute to this reduction at larger population sizes. For example, reduced parasite performance at thermal extremes (Shocket et al., Reference Shocket, Magnante, Duffy, Cáceres and Hall2019) or decreased parasite viability (Chen et al., Reference Chen, Donner, Biere, Gols and Harvey2019) may lower carrying capacity for O. colligata, resulting in reduced parasite burden. Crowding at high temperatures could intensify competition for food or space, leading to behavioural or physiological changes (Ban et al., Reference Ban, Tenma, Mori and Nishimura2009), and enhanced host immunity (Silva and Elliot, Reference Silva and Elliot2016), resulting in reduced transmission efficiency and lower parasite loads over time. These findings suggest that the relationship between host population size and burden can shift nonlinearly, with extreme temperatures potentially affecting the strength of the relationship between density and transmission.
Effect of cold snaps
Cold snaps can increase the burden depending on the baseline temperature. For example, at 23 °C, a cold snap was followed by a delayed increase in burden, without a corresponding change in population size. Indeed, a cold snap in warmer climates can sharply increase fungal disease risk in wildlife populations (Cohen et al., Reference Cohen, Sauer, Santiago, Spencer and Rohr2020). When the thermal optima of the host and parasite differ, fluctuations in temperature can shift the balance in their interaction, resulting in either host or parasite having an advantage over the other, as stated by the Thermal Mismatch Hypothesis (Cohen et al., Reference Cohen, Venesky, Sauer, Civitello, McMahon, Roznik and Rohr2017). In other systems, for example, chytrid fungus (Batrachochytrium dendrobatidis), warm-adapted hosts had a higher probability of infection at cool temperatures compared to cold-adapted hosts (Venesky et al., Reference Venesky, DeMarchi, Hickerson and Anthony2022). Here, the suppression of Daphnia immunity during the cold snap and subsequent rewarming could have contributed to the delayed increase in burden at higher temperatures (Murdock et al., Reference Murdock, Paaijmans, Bell, King, Hillyer, Read and Thomas2012). An increase in burden was also previously noted at the individual level by McCartan et al. (Reference McCartan, Piggott, DiCarlo and Luijckx2024), where burden was increased after a cold snap occurred at 23 °C in the same host–parasite system. Thus, cold snaps alter Daphnia–Ordospora outcomes in a temperature-dependent manner, tying infection intensity to host population dynamics.
Effect of heatwaves
Heatwaves, like cold snaps, can alter disease in a temperature-dependent manner. At 14 °C, the rapid temperature rise may have overwhelmed the capacity of the Daphnia to maintain homeostasis, leading to an increased burden and a decrease in population size. Increases in burden following thermal fluctuations can be explained by the Thermal Variability Hypothesis (Paull et al., Reference Paull, Raffel, LaFonte and Johnson2015). This theory posits that, as parasites are generally smaller than their hosts and have higher metabolic rates, they can physiologically adjust more quickly to temperature changes, giving them a temporary advantage. Our results show that such increases in burden are short-term, indicating that parasites may derive fitness benefits from short-term extreme weather events. Such effects have been found in other systems, for example, in mosquito–malaria systems, where short-term temperature fluctuations can enhance parasite development and transmission (Paaijmans et al., Reference Paaijmans, Blanford, Bell, Blanford, Read and Thomas2010). However, effects on population density following a heatwave at 14 °C indicate that long-term effects of extreme weather can occur under some conditions, which is consistent with work that indicates changes in host physiology (Rodríguez-Trelles et al., Reference Rodríguez-Trelles, Tarrío and Santos2013), immunity (Rollins-Smith and Le Sage, Reference Rollins-Smith and Le Sage2023) or dynamics that persist after temperatures return to baseline (Malek and Byers, Reference Malek and Byers2018). Thus, the effect of heatwaves, similar to cold snaps, can depend on the mean temperature at which the extreme weather event occurs.
Population vs individual level
Comparisons between individual- and population-level responses showed general concordance at lower temperatures. For example, the observed increase in burden during a heatwave at 14 °C was consistent across both scales. Thus, individual-level physiological responses, such as temperature-induced changes in host immunity (Catalán et al., Reference Catalán, Wozniak, Niemeyer, Kalergis and Bozinovic2012) or parasite replication (Porras et al., Reference Porras, Navas, Agudelo-cantero, Santiago-martínez, Loeschcke, Sørensen, Crandall, Biddinger and Rajotte2023), may translate into population-level infection dynamics. While rising mean temperatures may consistently affect burden at the individual level, the population-level outcomes (such as prevalence or outbreak size) may also be shaped by ecological complexity (Brehm et al., Reference Brehm, Assis, Martin and Orrock2025). Host density (Bruno et al., Reference Bruno, Selig, Casey, Page, Willis, Harvell, Sweatman and Melendy2007), resource competition (Amarasekare and Coutinho, Reference Amarasekare and Coutinho2014) and environmental carrying capacity (Bernhardt et al., Reference Bernhardt, Sunday and O’connor2018) may modulate the strength and direction of temperature effects at different biological levels. These parallels across biological scales suggest that the direction of temperature deviation from the parasite’s optimum can be used to predict both individual and population outcomes, providing a mechanistic link between physiology and demography under climate extremes. Failing to consider temperature fluctuations may lead to overestimates in parasite fitness traits at high temperatures (Bagni et al., Reference Bagni, Siaussat, Maria, Fuentes, Couzi and Massot2024). Thus, identifying underlying mechanisms will be essential for the accurate assessment of natural populations in the face of climate change.
Conclusion
In conclusion, the effect of extreme temperature variation on parasite fitness was temperature-dependent, with heatwaves and cold snaps having short-term effects on burden. Moreover, the relationship between host density and burden uncoupled at higher temperatures. These findings underscore the importance of considering both environmental context and temporal dynamics when assessing host–parasite interactions under climate change. As climate change is resulting in increased frequency and intensity of anomalous weather events (Seneviratne et al., Reference Seneviratne, Zhang, Adnan, Badi, Dereczynski, Luca, Ghosh, Iskandar, Kossin, Lewis, Masson-delmotte, Zhai, Pirani, Connors, Péan, Berger, Caud, Chen, Goldfarb, Gomis, Huang, Leitzell, Lonnoy, Matthews, Maycock, Waterfield, Yelekçi, Yu and Zhou2021), understanding the influence of these on host–parasite dynamics will become all the more important. While disease burden in this system exhibits short-term effects, heat waves may impact population density for weeks at lower temperatures. Indeed, whether in general the effect of extreme weather leads to long- or short-term changes remains unresolved, with alternate host–parasite systems reporting different results (Rohr et al., Reference Rohr, Dobson, Johnson, Kilpatrick, Paull, Raffel, Ruiz-moreno and Thomas2011; Ragonese et al., Reference Ragonese, Sarkar, Hall and Altizer2024) or alternate impacts of different life history traits (Lafferty, Reference Lafferty2009; van de Pol et al., Reference van de Pol, Jenouvrier, Cornelissen and Visser2017). Thus, further studies using other genotypes and model systems should be conducted to enable generalizations to be made. In our study, extreme temperature events alter host–parasite interactions in predictable ways; infection increases when fluctuations bring temperatures closer to the parasite’s optimum and declines when extremes exceed physiological limits. Accounting for these mechanisms in predictive models will strengthen forecasts of epidemic dynamics and ecosystem impacts under future climate scenarios.
Supplementary material
The supplementary material for this article is available at https://doi.org/10.1017/S0031182026102686.
Data availability statement
The datasets generated and code used to analyse during the current study are available in the GitHub repository: https://github.com/niamhmccartan/population (copy archived at https://zenodo.org/records/16572346).
Acknowledgements
The authors thank Dieter Ebert and Jürgen Hottinger for the provision of the biological materials, Alison Boyce for technical assistance in creating the water baths and maintenance of electrical equipment and Whitney Parker for helping with empirical work.
Author contributions
N.M. and P.L. conceived the ideas and designed the methodology; N.M. and L.B. collected the data with the aid of P.L., J.S., F.O. and S.D.; N.M. analysed the data; N.M. and P.L. led the writing of the manuscript. All authors contributed critically to the drafts and gave final approval for publication.
Financial support
P.L. and N.M. were funded by a Research Ireland (formerly Science Foundation Ireland) Frontiers for the Future grant 19/FFP/6839.
Competing interests
The authors have no conflicts of interest.
Ethical standards
Not applicable.


 Open access

