I. INTRODUCTION
Boron nitride (BN) is usually produced by the chemical reaction of a boron source [e.g., B2O3 or B(OH)3] with a nitrogen source (e.g., NH3, C3N6H6 or CH4N2O) at high temperatures (HT) (Paine and Narula, Reference Paine and Narula1990). The reaction product crystallises in the hexagonal, sp2-hybridized modification (h-BN) with the space group P63/mmc. In 1957 and 1963, it was reported that the sp3-hybridized BN can be synthesized by applying high pressure (HP) and HT. The HP/HT synthesis yields in many cases two competing phases, i.e., the thermodynamically stable cubic boron nitride (c-BN) (Wentorf, Reference Wentorf1957) and the metastable wurtzitic boron nitride (w-BN) (Bundy and Wentorf, Reference Bundy and Wentorf1963). These phases crystallize in the space groups
 $F{\bar 4}$
3m and P63
mc, respectively.
A. Microstructure defects in hexagonal boron nitride
Although the cubic modification is generally accepted to be thermodynamically stable at ambient conditions (Solozhenko, Reference Solozhenko1995), the pressures and temperatures required for the respective phase transitions (h-BN → w-BN → c-BN or h-BN → c-BN) were discussed over several decades (Bundy and Wentorf, Reference Bundy and Wentorf1963; Corrigan and Bundy, Reference Corrigan and Bundy1975; Ueno et al., Reference Ueno, Hasegawa, Oshima, Onodera, Shimomura, Takemura, Nakae, Matsuda and Hirai1992; Solozhenko, Reference Solozhenko1995; Eremets et al., Reference Eremets, Takemura, Yusa, Golberg, Bando, Blank, Sato and Watanabe1998; Dubrovinskaia et al., Reference Dubrovinskaia, Solozhenko, Miyajima, Dmitriev, Kurakevych and Dubrovinsky2007). An important reason for the large spread of the parameters of the HP/HT conversion process reported in literature is the variety of the microstructures of h-BN precursors (crystalline quality, grain size, and microstructure defects) prepared by different production routes (Paine and Narula, Reference Paine and Narula1990).
In particular, the transformation kinetics is a critical issue, when BN nanocomposites containing several phases should be produced. Such nanocomposites have been shown by Dubrovinskaia et al. (Reference Dubrovinskaia, Solozhenko, Miyajima, Dmitriev, Kurakevych and Dubrovinsky2007) and Rafaja et al. (Reference Rafaja, Wüstefeld, Motylenko, Schimpf, Barsukova, Schwarz and Kroke2012) to possess even a higher hardness than the c-BN single crystals, whose hardness approaches 50 GPa.
Owing to the combination of nanosized domains of c-BN, w-BN and remnants of compressed h-BN, an increase in hardness and fracture toughness is achieved, mainly because of a partial crystallographic interlocking (Rafaja et al., Reference Rafaja, Klemm, Motylenko, Schwarz, Barsukova, Kroke, Frost, Dubrovinsky and Dubrovinskaia2008a) at the phase boundaries. However, the hardness is significantly improved only for an optimum phase composition of the nanocomposite, which strongly depends on the pressure, temperature, dwell time of the HP/HT process, and last but not the least, on the kind and density of the microstructure defects.
B. Contribution of basal plane corrugations to the phase transitions of BN
Among the microstructure defects (see Section 3 below), the basal plane corrugations are of high relevance for the HP/HT phase transitions in carbon (Tateyama et al., Reference Tateyama, Ogitsu, Kusakabe and Tsuneyuki1996), and because of its analogy presumably also in BN.
According to the molecular dynamics calculations performed by Tateyama et al. (Reference Tateyama, Ogitsu, Kusakabe and Tsuneyuki1996), the formation of a sp3-hybridized bond in carbon requires that the distance between the atoms of two adjacent basal layers reduces from 3.5 Å to about 2.1 Å. This reduction of the distance is commonly achieved (i) by the compression of the elementary cell owing to HP and (ii) by an opposite shift of atoms in the 〈001〉 direction by about 3% of the c-axis length. Especially the latter requirement can be provided prior to the HP/HT experiment through the basal plane corrugations.
To achieve a direct transition from the sp2-hybridised precursors (e.g., graphite, h-BN) to the cubic sp3-hybridised modifications (e.g., diamond, c-BN), shear stresses, stacking faults or twins are additionally required (Tateyama et al., Reference Tateyama, Ogitsu, Kusakabe and Tsuneyuki1996; Kurdyumov et al., Reference Kurdyumov1973; Kupcik et al., Reference Klimanek and Kužel1994).
Conclusively, applying these results to the h-BN–c-BN transformation, one would expect that h-BN with basal plane corrugations requires less severe synthesis conditions or converts at higher rate than h-BN without these defects.
In this work, the conceivable effect of microstructure defects in h-BN on the transformation of this phase to w-BN and c-BN is discussed. Furthermore, a fast procedure for quantitative description of the basal plane corrugations, which are the prominent microstructure defects in h-BN affecting the transformation kinetics, is introduced. The procedure offers a statistical description of the interplanar spacing distribution as concluded from the analysis of the anisotropic X-ray diffraction line broadening. The reliability of this method was proven by local scanning of the basal plane spacing in a high-resolution transmission electron microscope (HRTEM).
II. EXPERIMENTAL
As examples of h-BN with significantly different microstructures, pyrolytic boron nitride (p-BN) and high-density boron nitride (HDBN) were investigated. The p-BN was commercially available chemically vapour deposited h-BN in form of sheets (Morgan Technical Ceramics). This form of p-BN contains a high amount of corrugated basal planes. The HDBN was purchased from Henze BNP and was obtained by sintering of h-BN powder (HeBoSint®D) (Henze BNP, Reference Henze2014). This material is nearly free of basal plane corrugations.
The laboratory X-ray diffraction (XRD) experiments were performed with a Seifert FPM URD6 diffractometer in Bragg–Brentano geometry using CuKα radiation. A graphite monochromator was located in the front of a scintillation detector. The in situ XRD experiments tracking the phase transformations at HP and HT were performed at the beamline W2 (Hasylab Hamburg, Germany). A standard 6–8 two stage multianvil setup (Leinenweber et al., Reference Leinenweber, Tyburczy, Sharp, Soignard, Diedrich, Petuskey, Wang and Mosenfelder2012) was used with slight adaptions aimed to decrease the scattering of the pressurising medium in the synchrotron beam (Schwarz, unpublished). A carbon tube was used for heating. The highest applied temperature was 1373 K as measured by means of a type C thermocouple. The maximum applied pressure was 11 GPa as determined using Au (Anderson et al., Reference Anderson, Isaak and Yamamoto1989) or MgO (Karki et al., Reference Kupcik, Grochowski and Serda1997) as pressure standards.
III. ANALYSIS OF MICROSTRUCTURE DEFECTS
A. X-ray diffraction analysis of basal plane corrugations in h-BN
The microstructure defects in h-BN were described comprehensively by Huang and Zhu (Reference Huang and Zhu2000). Most of them can be distinguished and quantified from hkl-dependent XRD line broadening (β hkl) because of the unique functional dependence of β hkl on the magnitude of the diffraction vector q (Schimpf et al., Reference Schimpf, Motylenko and Rafaja2013). This analysis of the microstructure defects combines the known anisotropic line broadening models for dislocations (Klimanek and Kužel, Reference Karki, Stixrude, Clark, Warren, Ackland and Crain1988), stacking faults (Warren, Reference Warren1969), turbostratic disorder (Kurdyumov, Reference Kurdyumov, Pilyankevich and Frantsevich1976), and basal plane corrugations. The basal plane corrugations were originally denoted as puckering defects (Schimpf et al., Reference Schimpf, Motylenko and Rafaja2013) in reference to “puckering” proposed by Kurdyumov et al. (Reference Kurdyumov, Britun and Petrusha1996). In the former approach (Schimpf et al., Reference Schimpf, Motylenko and Rafaja2013), the basal plane corrugations were quantified solely from the line width of the diffraction lines without taking advantage of the measured line shape. Therefore, just the root mean square basal plane corrugation was determined from the variance of the interplanar spacings (00l), but no information about the distribution of the interplanar spacings (00l) could be obtained. An alternative model is proposed below, which is able to simulate the specific peak profile associated with the basal plane corrugations correctly and which yields additionally quantitative results being in favourable agreement with the previous model (Schimpf et al., Reference Schimpf, Motylenko and Rafaja2013).
In hexagonal materials, the reciprocal interplanar distance depends on the lattice parameter a and c and on the diffraction indices hkl like
 $$d_{{\rm hkl}}^{ - 1}=\left[{\displaystyle{4 \over {3a^2 }}\lpar h^2+hk+k^2 \rpar +\displaystyle{{l^2 } \over {c^2 }}} \right]^{\displaystyle{1 \over 2}} $$
Applying Bragg's law, the sine of half the diffraction angle can be written as
 $$\sin \theta=\displaystyle{\lambda \over 2}\left[{\displaystyle{4 \over {3a^2 }}\lpar h^2+hk+k^2 \rpar +\displaystyle{{l^2 } \over {c^2 }}} \right]^{\displaystyle{1 \over 2}} $$
with λ being the wavelength of the X-rays. The basal plane corrugations cause local variations of the lattice parameters, which cause in turn variations of the interplanar spacing:
 $$\eqalign{\Delta \lpar d_{\rm hkl}^{ - 1} \rpar =\displaystyle{{\Delta d_{\rm hkl} } \over {d_{\rm hkl}^2 }} & = \displaystyle{1 \over 2} \left[{\displaystyle{4 \over 3a^2} \lpar h^2 + hk + k^2 \rpar +\displaystyle{l^2 \over c^2}} \right]^{ - \displaystyle{1 \over 2}} \cr & \quad \cdot \left[{\displaystyle{{4 \Delta a} \over 3a^3}\lpar h^2+hk+k^2 \rpar + \displaystyle{{\Delta c} \over {c^3 }}l^2 } \right]}$$
The variations of the reciprocal interplanar spacing can easily be converted into the variations of the XRD line positions if they are expressed on the sine scale:
 $${\rm \Delta }\lpar \sin \theta \rpar =\displaystyle{\lambda \over 2}\displaystyle{{{\rm \Delta }d_{{\rm hkl}} } \over {d_{{\rm hkl}}^2 }}$$
A constant volume of the unit cell is assumed despite the basal plane corrugations, the variations of the lattice parameters (Δa and Δc) are interrelated through Δa = C 33 S 13Δc, where C 33 and S 13 represent the relevant elements of the stiffness and compliance tensors. As the binding forces between basal planes in h-BN are the van der Waals forces, the product of these two elastic constants approaches zero, C 33 S 13 ≈ 0 (Bosak et al., Reference Bosak, Serrano, Krisch, Watanabe, Taniguchi and Kanda2006), and thus Δa ≈ 0. Consequently, Eq. (3) reduces to
 $$\eqalign{\Delta \lpar d_{{\rm hkl}}^{ - 1} \rpar & =\displaystyle{{\Delta d_{{\rm hkl}} } \over {d_{{\rm hkl}}^2 }}\cr & =\displaystyle{1 \over 2}\left[{\displaystyle{4 \over {3a^2 }}\lpar h^2+hk+k^2 \rpar +\displaystyle{{l^2 } \over {c^2 }}} \right]^{ - \displaystyle{1 \over 2}} \cdot \displaystyle{{l^2 } \over {c^3 }}\Delta c}$$
Finally, it follows from Eqs (4) and (5) that Δ(sin θ) is directly proportional to Δc:
 $$\eqalign{\Delta \lpar \sin \theta \rpar & =\cos \theta \Delta \theta \cr & =\displaystyle{\lambda \over 4}\left[{\displaystyle{4 \over {3a^2 }}\lpar h^2+hk+k^2 \rpar +\displaystyle{{l^2 } \over {c^2 }}} \right]^{ - \displaystyle{1 \over 2}} \cdot \displaystyle{{l^2 } \over {c^3 }}\Delta c}$$
A direct proportionality can also be found between Δc and Δθ within one diffraction profile, i.e., if the diffraction angle varies in a narrow angular range:
 $$\,f_{{\rm phys}} \lpar \Delta \theta \rpar =\displaystyle{\lambda \over {4\cos \theta }}\left[{\displaystyle{4 \over {3a^2 }}\lpar h^2+hk+k^2 \rpar +\displaystyle{{l^2 } \over {c^2 }}} \right]^{ - \displaystyle{1 \over 2}} \cdot \displaystyle{{l^2 } \over {c^3 }}\Delta c$$
In Eqs (6) and (7), Δθ has the meaning of the deviation of the respective XRD line position from the intrinsic one and describes the physical line broadening caused by the corrugations of the basal planes. Consequently, the distribution of the diffraction angles (Δθ) and, according to Eq. (7), also the distribution of the lattice parameter (Δc) control the shape of the XRD lines.
The partial splitting of the XRD lines observed in h-BN samples with corrugated basal lattice planes can be reasonably described by a ‘U’-shaped physical broadening with two distinct maxima located below and above the respective theoretical line position and a valley between them. Such a function was employed by Rafaja et al. (Reference Rafaja, Dopita, Masimov, Klemm, Wendt and Lengauer2008b) to describe the physical line broadening in materials containing concentration profiles formed in an interdiffusion process. The corresponding lattice corrugations can be described by a sigmoidal function of the volume amount y:
 $$c=\displaystyle{{c_{{\rm max}} } \over {1+\lpar y/y_0 \rpar ^p }}$$
where Δc max is the maximum amplitude of the basal plane corrugations. The parameter p characterizes the shape of the distribution function. Large p (>3) means nearly a bimodal distribution, low p (<3) a continuous transition between regions with low and high lattice parameters c. As the denominator in Eq. (8) is equal to 2 for y = y 0, the parameter y 0 describes the ratio between the regions with low and high c. The sigmoidal function from Eq. (8) is similar to the sum of the error functions, which was used by Rafaja et al. (Reference Rafaja, Dopita, Masimov, Klemm, Wendt and Lengauer2008b) to describe the distribution of the lattice parameters in an interdiffusion process. However, the sigmoidal function can be refined more easily than the sum of the error functions.
The measured shape of the XRD lines is a convolution of the physical profile obtained from Eqs (7) and (8) with an instrumental function (Stokes and Wilson, Reference Stokes and Wilson1944). In our case, the instrumental function was determined using a LaB6 standard and approximated by the Pearson VII distribution (Hall et al., Reference Hall, Veerarghavan, Rubin and Winchell1977):
 $$\,f_{{\rm instr}} \lpar 2\theta \rpar =\displaystyle{{I_0 } \over {\left[{1+\lpar 4\lpar \root m \of 2 - 1\rpar /w^2 \rpar \lpar 2\theta - 2\theta _B \rpar ^2 } \right]^m }}$$
The basal plane corrugations, which are responsible for the shape of the XRD lines in pyrolytic h-BN discussed above, were visualised by HRTEM [see Figure 1(a, left)]. This micrograph displays a detail of the basal plane corrugations in p-BN as seen by HRTEM.
High-resolution TEM image of a small area of pyrolytic h-BN (A, left) seen with the 〈001〉 direction along the vertical. On the right side of (A), the picture is continued but filtered with the {002} spots of the FFT of the original image. This highlights the corrugations of the basal planes. The graph in (B) shows a model function to represent the basal plane corrugations (the graph can be found in (A, right) as well being adjusted in dimensions to fit the TEM image). The reduced data of the graph is found in (C), where the histogram was obtained from binning the Δc observed in (B). The cumulative sum of the histogram is shown in (C) as well. This cumulated curve is represented by Eq. (7).

These corrugations can be identified as waviness of the basal planes in the sub-Å region along the stacking direction 〈001〉 (vertical direction of the image). To highlight this structure, the original HRTEM micrograph has been filtered through the {002} spots in the fast fourier transform (FFT) (Williams and Carter, Reference Williams and Carter2009). The result of this image processing is shown in Figure 1(a, right), and clearly shows the corrugations of the basal planes in p-BN. The horizontal line on the right-hand side of Figure 1(a) indicates the mean position of a selected lattice plane {001}. The corrugations become evident as deviations of the measured lattice plane positions from this line.
Because of a limited lateral coherence length of X-rays (Holý et al., Reference Holý, Pietsch and Baumbach1999), the XRD recognizes primarily the uncorrelated displacement of the basal lattice planes from a reference plane {001} and thus the variations of the interplanar spacing d 00l or the lattice parameter c. The waviness of individual basal lattice planes observed in HRTEM micrograph plays a secondary role. Therefore, for the purpose of XRD, the variance of the lattice parameter (Δc) can be modelled as shown in Figure 1(b). Although this periodic function suggests that basal plane corrugations may have an infinite periodicity along the a-b direction, TEM images showing a larger portion of the structure, i.e., in Schimpf et al. (Reference Schimpf, Motylenko and Rafaja2013), verify that this is not the case. The periodic corrugations are terminated for example at grain boundaries (e.g., after some ten nanometers lateral extent), after which new corrugations occur, not necessarily having the same corrugation periodicity. By definition, the corrugations are partially correlated along c. The maximum amplitude of Δc is equal to Δc max from Eq. (8), while the information about the transition region is contained in the p parameter. Counting the number of data points (binning) of the function in Figure 1(b) in a small distance along the abscissa yields the distribution of Δc [Figure 1(c)] or, applying Eq. (8), the distribution of the XRD line positions caused by the corrugations of the basal planes.
B. Application of the basal plane corrugation model to the pyrolytic and high-density boron nitride
The model proposed in the previous section was used to fit the 002 and 004 diffraction lines measured in pBN, which contains the basal plane corrugations as the main defect type, and in HDBN, which is nearly free of microstructure defects. The parameters in Eq. (8), i.e., Δc max, p and y 0, were refined using a nonlinear least squares algorithm, while the parameters in Eq. (9) were kept constant. The parameters I 0 and θ B correspond to the maximal intensity and gravity centre of the respective diffraction line, respectively, and m = 1.5. The width of the Pearson function [Eq. (9)] was obtained from the measurement performed on the LaB6 standard and interpolated using the Caglioti formula (Caglioti et al., Reference Caglioti, Paoletti and Ricci1958). This allowed the refinement of the shape and width of the 002 and 004 diffraction lines using a single set of parameters in Eq. (8).
The intensities y calc were calculated from the convolution of Δθ from Eq. (7) and f instr(2θ) from Eq. (9) including a linear background, which is described by the parameters b 0 and b 1:
 $$y_{{\rm calc}} \, =\, f_{{\rm phys}} \, \ast \, f_{{\rm instr}}+b_0+b_1 \cdot 2\theta $$
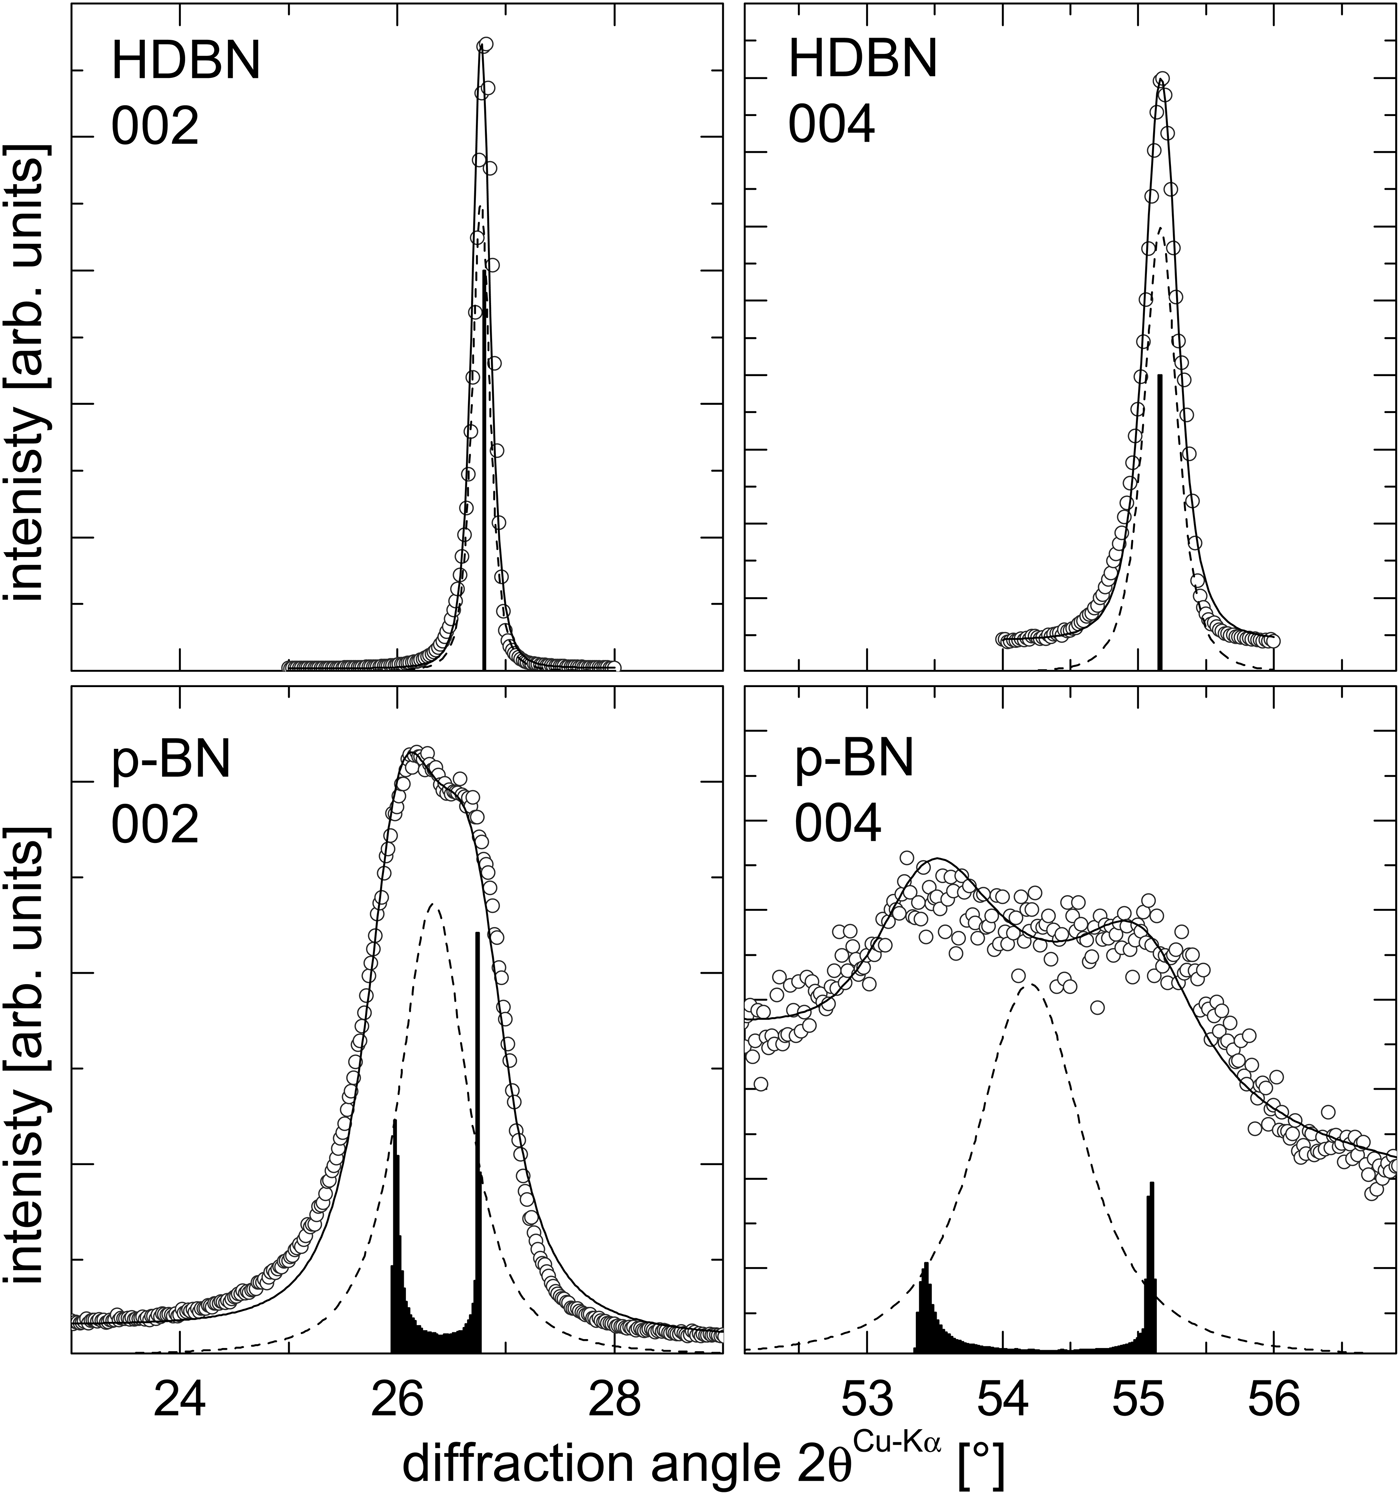
The results of the refinement are shown in Figure 2. The open circles mark the observed intensities; the solid lines represent the intensities calculated according to Eq. (10). In the case of HDBN, the physical profile f phys is equal to a δ-function located at the intrinsic d 00 l . In Eq. (8), Δc max approaches zero and the other parameters (y 0 and p) lose their meaning. In the case of p-BN, the physical broadening in the case of p-BN was described by Eqs (7) and (8) with Δc max = 0.21 Å, y 0 = 47 and p = 5.
Results of the refinement (solid line) of the measured 002 and 004 diffraction lines (open circles) of h-BN without (top) and with (bottom) basal plane corrugations. A Pearson VII distribution [Eq. (9), dashed line] was convolved with the c distribution [histogram, obtained from a single parameter set in Eq. (8)]. The background intensity (not shown) was assumed to be linear across the angular range of the peaks [cf. Eq. (10)]. More details on the results can be found in the text.

The agreement between the measured and the refined peak was quantified by
 $$R_w=\; \sqrt {\displaystyle{{\sum \nolimits \left({y_{{\rm obs}} - y_{{\rm calc}} } \right)^2 } \over {\sum \nolimits \left({y_{{\rm obs}} } \right)^2 }}} $$
with y obs and y calc representing the measured and calculated intensities. The achieved reliability factors of the refinements were similar for the two investigated materials (HDBN: R w = 9.5 % for 002, R w = 7.8 % for 004; p-BN: R w = 9.9 % for 002, R w = 7.9 % for 004). The higher R w for the 002 diffraction line results from the systematic asymmetry in the 002 diffraction lines, which is not accounted for by Eq. (10). Additional sources of anisotropic line broadening were negligible for the 00l diffraction lines in comparison with that imposed by the basal plane corrugations (Schimpf et al., Reference Schimpf, Motylenko and Rafaja2013). Although some dislocations, stacking faults and turbostratic disorder are possibly present, their contributions to the total line broadening to this specific hkl diffraction line are dominated by that of the basal plane corrugations. Line broadening because of small crystallites is assumed to be isotropic and was included as an arbitrary offset in the line width in addition to the instrumental line broadening. The crystallite size was not explicitly determined with this method.
Generally, the good coincidence of measured and calculated peak shapes shown in Figure 2 highlights the applicability of the proposed model for the quantification of basal plane corrugation from XRD line broadening.
C. Effect of basal plane corrugations on the phase transition in boron nitride
The effect of the basal plane corrugations on the kinetics of the phase transition of h-BN to the w-BN and c-BN was demonstrated with the aid of defect-poor high density h-BN (HDBN) and defect-rich pyrolytic h-BN (p-BN). Although p-BN and HDBN underwent nearly identical HP/HT conversion process regarding the pressure, temperature and dwell time, the phase compositions differed significantly. The in situ XRD diffraction experiments, which were performed at the pressure of 11 GPa and at the temperatures up to 1373 K, revealed that HDBN stays largely in the original graphitic form and transforms only partly to w-BN. In contrast, p-BN transforms very fast and directly to c-BN, without forming w-BN as an intermediate phase. The transformed volume fractions of HDBN and p-BN precursors under HP/HT are shown in Figure 3 with respect to process time and temperature (at the initial pressure of 11 GPa). The transformation behaviour of the two appears to be completely different. First, they show a different transformation product under the given synthesis parameters. The HDBN with a low density of microstructure defects and nearly no corrugations on basal planes transforms to w-BN, while the p-BN with a large amplitude of the basal plane corrugations transforms directly to c-BN. This difference is most likely not caused by the basal plane corrugations alone but may require the formation of additional defects in situ under HP/HT conditions (Kurdyumov et al., Reference Kurdyumov1973).
Volume fractions of h-BN, w-BN and c-BN obtained from in-situ EDXRD during the HP/HT conversion from sp2- to sp3-hybridized BN. The upper row shows the result for defect-poor high-density h-BN (HDBN, which converts to w-BN. The second row highlights that pyrolytic h-BN (p-BN) containing the basal plane corrugations converts directly to c-BN, without formation of w-BN. The latter transformation appears to be faster in a similar p and T regime.

However, also the transformation rate from the low-pressure to the high-pressure phases is considerably different. At the maximum temperature of 1373 K, the h-BN with basal plane corrugations has almost completely transformed (>95%). The c-BN volume fraction shown in Figure 3 saturates at long annealing times, as the complete transformation of h-BN to c-BN may require much higher temperature than 1373 K.
In contrast to p-BN, the defect-poor HDBN transforms much slower and converts at similar conditions only to 12.5% w-BN. Thus, the presence of the basal plane corrugations accelerates the phase transformation from the sp2 to sp3 hybridised forms of BN. Additionally, the basal plane corrugations may establish the preconditions for a direct nucleation of c-BN from h-BN. Similar to the direct transition from graphite to diamond (Tateyama et al., Reference Tateyama, Ogitsu, Kusakabe and Tsuneyuki1996), this can be achieved through local changes in the stacking order, which serve as nuclei. Such changes would require the presence of stacking faults and/or twins (Kurdyumov et al., Reference Kurdyumov1973; Kupcik et al., Reference Klimanek and Kužel1994), whose formation might be simplified by the presence of the basal plane corrugations. However, a thorough discussion is beyond the scope of the present report.
IV. DISCUSSION
The microstructure model proposed in Section 3A is able to correctly mimic the shape of the 00l diffraction lines of h-BN when this material contains a high amount of basal plane corrugations. Especially the splitting of the diffraction lines is well reproduced and is clearly identified to be a consequence of the corrugated basal planes. The expression of the line broadening (variance of sin θ) in the form of a distribution of interplanar spacings along 〈001〉 can be used to model the shape of all hkl diffraction lines. Eq. (8) requires only three parameters to fully describe the Δc distribution.
The proposed model is a substantial improvement compared with Schimpf et al. (Reference Schimpf, Motylenko and Rafaja2013), where only Δc was used to describe the line broadening (i.e., variance of sin θ). Here, the whole distribution profile of c is obtained from the refinement of the 00l diffraction lines. This provides a physically more relevant basis for the analysis of this type of microstructure defect. Moreover, the distribution profile obtained from XRD can be qualitatively proven from the analysis of HRTEM images.
The new approach is also in good quantitative agreement with the previous one (Schimpf et al., Reference Schimpf, Motylenko and Rafaja2013), bearing in mind the systematic differences between the two approaches. However, the first approach (Schimpf et al., Reference Schimpf, Motylenko and Rafaja2013) provides the possibility to analyse the basal plane corrugations in relation to other microstructure defects, whereas the present approach provides more details on the basal plane corrugations themselves. The refinement using the present approach should be done carefully owing to possible parameter correlations caused by other line broadening sources.
The in situ XRD experiments carried out at HP and HT have demonstrated that the basal plane corrugations play an important role. Under nearly identical synthesis conditions, h-BN with basal plane corrugations transforms at a much higher rate to the HP phase compared to h-BN without these defects. Moreover, the defect-rich material converts directly to c-BN whereas the defect-poor material results in w-BN after HP/HT treatment. Assuming the principle validity of the transformation model given by Tateyama et al. (Reference Tateyama, Ogitsu, Kusakabe and Tsuneyuki1996), the direct h-BN-to-c-BN transition requires the in situ formation of planar faults in h-BN (Fahy et al., Reference Fahy, Louie and Cohen1986; Kurdyumov et al., Reference Kurdyumov, Britun and Petrusha1996).
The higher yield of HP phase from precursors with basal plane corrugations is not surprising. Tateyama et al. (Reference Tateyama, Ogitsu, Kusakabe and Tsuneyuki1996) have demonstrated that a shift of atoms along 〈001〉 is essential for the sp2-to-sp3 transition. Thus, the introduction of this shift through the precursor manufacturing process can, obviously, significantly reduce the energy barrier to the HP/HT phase transition in h-BN.
A detailed discussion of the individual transformation steps in h-BN with and without basal plane corrugations is beyond the focus of this report. Generally, suitable nuclei for the c-BN formation from the pyrolytic h-BN may consist of (i) reduced interlayer distance d 00 l because of the application of external pressure, (ii) shifted atoms along c benefitting from basal plane corrugations and (iii) locally realised three-layer stacking via stacking faults or twins. For such region a moderate increase in temperature to 800 K at a pressure of 10 GPa is sufficient to exceed the activation energy of c-BN nucleation and growth.
With respect to the synthesis of BN nanocomposites, the very different phase transition behaviour of h-BN with different microstructure offers interesting possibilities to design the microstructure of the synthesis product.
V. CONCLUSIONS
The in situ HP/HT experiments have shown that microstructure defects have a severe impact on the phase transition behaviour of h-BN to w-BN or c-BN. This was demonstrated by applying HP/HT conditions to h-BN with and without basal plane corrugations. These experiments show a significant acceleration of the phase transition and an alteration of the phase composition in the product of the HP/HT synthesis, when the h-BN precursor contains basal plane corrugations. In this contribution, the basal plane corrugations were described by a sigmoidal function. This distribution function was transformed into the physical line broadening and convoluted with the resolution function of the diffractometer to reproduce the measured diffracted intensities. The fitting of the free parameters of the sigmoidal function revealed the maximum amplitude of the basal planes corrugations and the distribution of the spacing of the {001} lattice planes.
ACKNOWLEDGEMENTS
This work was financed through the Dr. Erich Krüger foundation in the frame of the Freiberg High Pressure Research Centre. The analytical infrastructure (TEM JEOL JEM 2200FS) was provided through the Cluster of Excellence ‘Structure Design of Novel High-Performance Materials via Atomic Design and Defect Engineering (ADDE)’, which was funded by the European Union (European Fund for Regional Development) and by the Ministry of Science and Art of Saxony (SMWK). The support provided through the GFZ Potsdam and HASYLAB Hamburg (Germany) during the in situ HP/HT experiments is gratefully acknowledged. The authors are thankful to U. Ratayski, T. Barsukova, T. Schucknecht, and M. Wehber for their assistance during the HP/HT experiments.