I. INTRODUCTION
Diluted solutions of bismuthide, in which a small amount of bismuth is incorporated in the lattice of A3B5 compounds, such as In(Ga)(As,Bi), are very promising, but not well studied materials.Reference Wang, Zhang, Yue, Liang, Chen, Li, Lu, Shao and Wang1 These materials have unique electron properties like sharp band gap reduction as a function of Bi content, anomalously weak temperature dependence of band gap E g, and large spin–orbit splitting reaching E g in magnitude.Reference Nagaraja, Mityagin, Telenkov and Kazakov2 The practical applications, however, are constrained by technological difficulties in their fabrication because of phase separation of Bi-containing A3B5 systems.Reference Nagaraja, Mityagin, Telenkov and Kazakov2
The majority of group III binary bismuthide are thermodynamically unstable and the attempts to form them have been unsuccessful.Reference Wang, Zhang, Yue, Liang, Chen, Li, Lu, Shao and Wang1 InBi is the only binary compound that has been synthesized, including both the bulk single crystalsReference Pandya and Vyas3 and epitaxial layers.Reference Keen, Makin, Stampe, Kennedy, Sallis, Piper, McCombe and Durbin4 In Ref. Reference Dominguez, Reyes, Bastiman, Sales, Richards, Mendes, David and Gonzalez5, the formation of InBi clusters with tetragonal PbO crystal lattice was presented, which adopted different from typical for A3B5 semiconductor compounds’ zinc blende (ZB) or wurzite crystal structure. The authors demonstrated that this occurred due to Bi content higher than its solubility limit in InAs. In the same time, the thermodynamic instability of Bi-containing compounds is of considerable interest since it creates the opportunity to obtain self-generating heterostructures of new types with nanosized modulations in the composition of solid solutionReference Luna, Wu, Hanke, Puustinen, Guina and Trampert6 and with QD-like clusters.Reference Wu, Luna, Puustinen, Guina and Trampert7 Reyes et al. in Ref. Reference Reyes, González, Bastiman, Dominguez, Hunter, Guerrero, Roldan, Mayoral, David and Sales8 reported on the In(As,Bi) clusters in the 2.2 ML thick InAs wetting layer, which were analyzed by atomic-column resolution electron microscopy and imaging simulation techniques. They found the Bi incorporation into the InAs clusters accompanied with the redshift and an increase of photoluminescence peak intensity in the samples.
In the present work, we have studied the effect of Bi doping on the interface microstructure in the GaAs/InAs/GaAs heterosystem, during the synthesis using molecular beam epitaxy (MBE). The growth was carried out under conditions leading to the formation of laterally bound quantum dots in the InAs layers.Reference Reyes, González, Bastiman, Dominguez, Hunter, Guerrero, Roldan, Mayoral, David and Sales8 The synthesis was carried out in the low temperature range (∼350 °C for the InAs layer), at which the crystallization of the layers is hindered by the low rate of surface diffusion. Transmission and scanning transmission electron microscopies (TEM and STEM, correspondingly), energy dispersive X-ray (EDX) microanalysis,Reference Goldstein, Newbury, Joy, Lyman, Echlin, Lifshin, Sawyer and Michael9 and X-ray diagnostic methods were used in the presented study.
These methods allows us to determine the crystal microstructure of the system with atomic resolution from one hand and correlate these data with averaged values for the areas comparable with the diameter of the spot of X-ray beam on the sample.Reference Afanas’ev, Aleksandrov and Imamov10–Reference Chuev, Pashaev, Koval’chuk and Kvardakov12 X-ray diffraction (XRD) is sensitive to the changes of the crystal lattice and X-ray reflectivity (XRR) is sensitive to changes of core electron density of a sample, which make possible to estimate the thickness and morphology of layers and interfacesReference Daillant and Gibaud13–Reference Chesnokov, Vasiliev, Prutskov, Pashaev, Subbotin, Kravtsov and Ustinov20 and, thus getting the hints on peculiarities of the growth process.
II. SAMPLES
Two heterostructures were formed on i-GaAs(001) substrates by MBE (CNA, Ryazan, Russia) using solid sources. After removing of the oxide layer from the substrate surface, the i-GaAs buffer layer with the thickness of 0.35 μm was formed at a rate of 0.19 nm/s and the temperature of 600 °C. Then, for the formation of sample A, the substrate was cooled down to 350 °C and the InAs layer was deposited at the rate of 0.004 nm/s, which was covered with a 3 nm thick GaAs layer at a rate of 0.09 nm/s. The deposition of the InAs layer was carried out using the additional Bi flux with the beam equivalent pressure (BEP) of 2 × 10⁻⁹ torr during the formation of sample B, and the As/In flux ratio was 8 for both samples, As/Bi for sample B—40. The BEP of In for both samples during growth was 10−8 torr, and of BEP of As—8 × 10⁻⁸ torr. After increasing the substrate temperature to 550 °C, a layer of GaAs with a thickness of 100 nm was grown at the same rate. The growth process was controlled by RHEED. The scheme of the grown samples is presented at Fig. 1.
Scheme of the samples under study.

III. EXPERIMENTAL METHODS AND RESULTS
A. X-ray methods
XRD and XRR studies were carried out on a Rigaku SmartLab laboratory diffractometer (Rigaku, Tokyo, Japan) with a rotating copper anode. The experimental scheme included a parabolic mirror, a double Ge(220) monochromator, a point detector, and a system of slits. Measurements were performed in the θ–2θ mode in the symmetric Bragg scheme.Reference Bowen and Tanner11 The processing of X-ray data together with electron microscopy data was carried out similar to that described in Ref. Reference Chesnokov, Vasiliev, Prutskov, Pashaev, Subbotin, Kravtsov and Ustinov20.
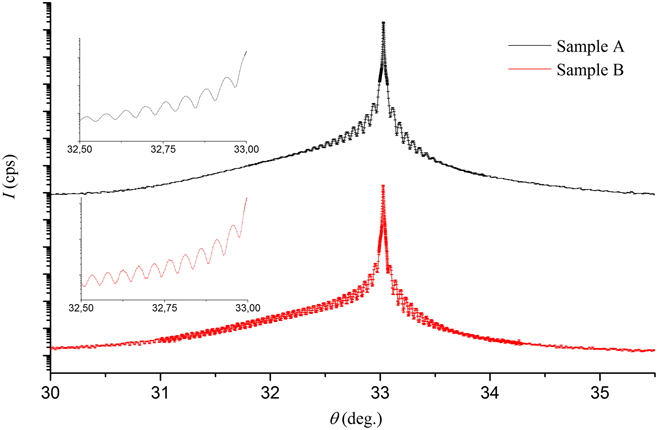
XRD curves from both samples (Fig. 2) contain a peak from the GaAs(400) substrate at the angle of θ = 33.026°. The asymmetry of XRD curves is clearly noticeable: an inflow due to the presence of a thin In(As,Bi) layer is observed in the left of the peak from the substrate. Both XRD curves demonstrate pronounced oscillation patterns (see the insets in Fig. 2). It can be mentioned that the oscillations on the curve from sample B propagate to a larger angular range.
XRD curves from samples A (upper curve) and B (lower curve). Vertical dashes represent experimental points with a confidence interval. The insets show an oscillation pattern for the samples in the range from 32.5° to 33°.

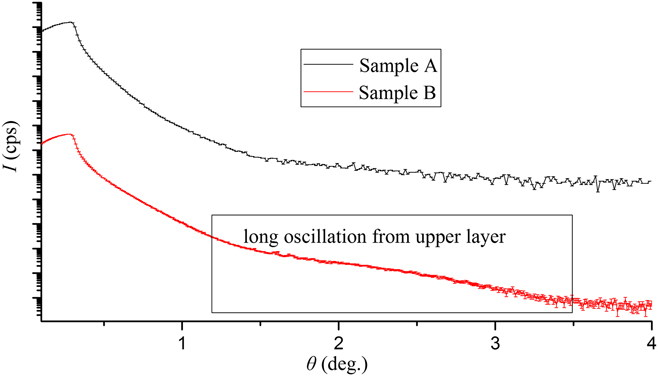
On the XRR curve from sample A (Fig. 3), there is no oscillation pattern; in contrary, the XRR curve from sample B demonstrates an extended oscillation corresponding to a thickness of about 1.6 nm.
XRR curves from samples A (upper curve) and B (lower curve). Vertical dashes show experimental points with a confidence interval. The curve from the B sample demonstrates long oscillation from the upper layer.

B. Electron microscopy
For the examination of samples by TEM and STEM, cross-sectional specimens were prepared by standard polishing and ion beam thinning.Reference Chesnokov, Vasiliev, Prutskov, Pashaev, Subbotin, Kravtsov and Ustinov20 The heterosystems were investigated on a TITAN 80-300 (ThermoFisher Scientific, Waltham, Massachusetts) with a spherical aberration corrector in bright field and high angle annular dark field (BF and HAADF, respectively) modes at an accelerating voltage of 300 kV. The microanalysis study of the specimens by energy-EDX microanalysis was carried out on an Osiris TEM/STEM equipped with a SuperX CCD detector (Bruker, Billerica, Massachusetts). The accelerating voltage was 200 kV. Image processing was performed with TIA (FEI) and Digital Micrograph (Gatan, Pleasanton, California) software. The EDX spectra were processed with Bruker software, and the elemental maps correspond to at.%.
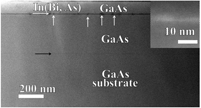
Figure 4 demonstrates the BF STEM cross-sectional images of A and B samples. Thin In(As,Bi) layers are clearly visible and are indicated by the white arrows. There are notable QD-like clusters at the In(As,Bi) interface of sample B. The microstructure of these QD-like clusters will be considered below in more detail. Black arrows indicate the interface between the substrate and buffer layers.
The BF STEM cross-sectional images of samples: (a) A and (b) B. The GaAs substrate/buffer interfaces are indicated by black arrows and the In(As,Bi) layer is indicated by white arrows.

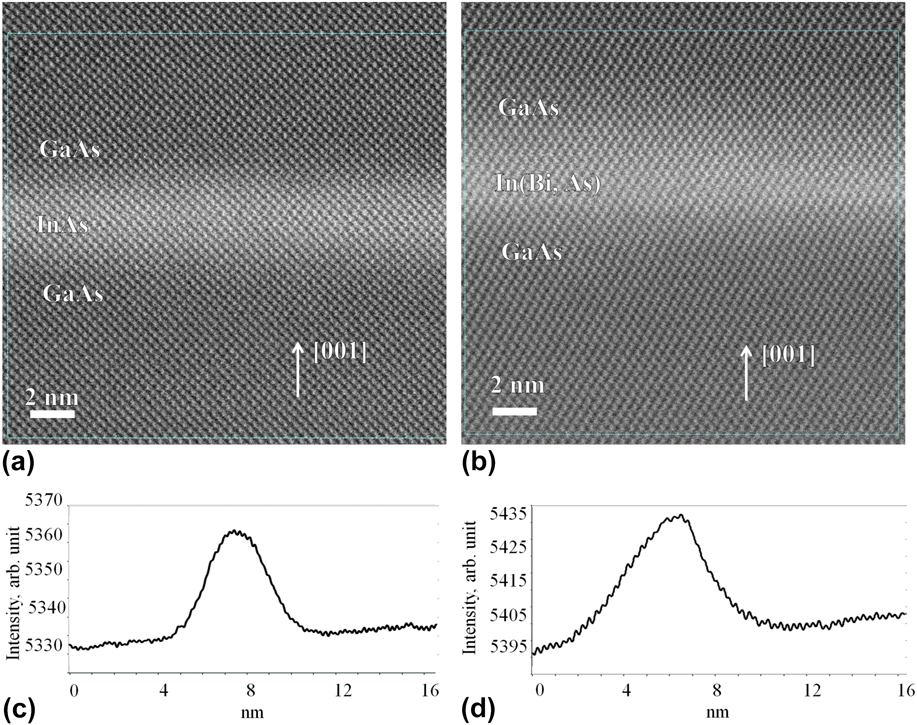
The thickness of the InAs layer in sample A is uneven, in the range of 1.9–2.3 nm. The high resolution (HR) HAADF STEM image of In(As,Bi) layers in both samples are presented in Figs. 5(a) and 5(b). Note that we choose the area without the QD-like clusters in sample B. The use of the HAADF TEM method, releasing the Z-contrast, makes it easy to determine the morphology of In(As,Bi) layers.Reference Williams and Carter21 The intensity profiles of the image taken across the In(As,Bi) layers are presented in Figs. 5(c) and 5(d). The difference in FWHM is clearly visible: it is distinctly wider for sample B, i.e., 3.5 nm (A) and 5 nm (B).
HAADF STEM images of the In (As,Bi) layer of the samples: (a) sample A and (b) sample B, and corresponding intensity profiles for these samples: (c) sample A and (d) sample B.

There is a transition area at InAs/GaAs interfaces with the thickness of 1 nm. As is mentioned above, the In(As,Bi) layer in sample B contains QD-like clusters and their size differs between 3.4 and 21.3 nm in lateral dimension and from 3.6 to 11.6 nm in the growth direction. The QD-like cluster size distribution was determined for 27 objects and the maximum number of clusters was found in the range from 7.1 to 8 nm in the lateral direction and in the range from 5.1 to 6 nm in the direction of the heterostructure growth (see histograms at Fig. 6). At low magnification, these QDs adopted ellipsoidal shape and are laterally distributed with a concentration of approximately (3.5 ± 0.3) × 1010 cm−2. This concentration was determined from high magnification HAADF STEM images with estimated thickness of the sample around 30 nm. The lateral size of the area under consideration was 1.5 µm and 16 In(Bi,As) clusters were observed in this area. Close inspection of these QD-like clusters using HR TEM and HAADF STEM revealed that their crystal structure exhibited two crystal lattice types, namely cubic (the ZB) and tetragonal.
QD-like clusters’ size histograms for lateral size (a) and size in the growth direction (b).

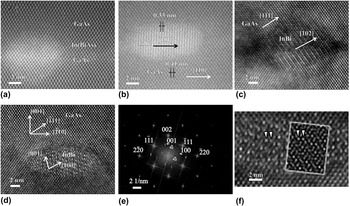
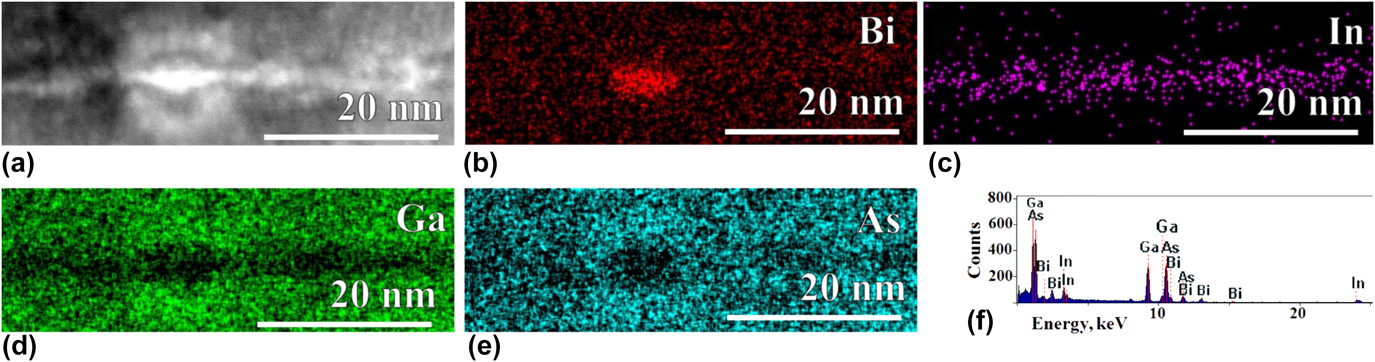
The HAADF STEM and HR TEM images of the QD-like cluster are presented in Figs. 7(a)–7(d). The presence of Bi atoms is confirmed by the EDX mapping, similar to the data shown in Figs. 8(a)–8(d). Interestingly, the images demonstrate different crystal structures of QD-like clusters. The motif of the crystal lattice image, that is, similar to the matrix is shown in Fig. 7(a), and all the others are completely different.
(a and b) High angular dark field STEM images of QD-like clusters, (c and d) BF TEM images of QD-like clusters, (e) two-dimensional FFT pattern of the QD-like cluster from (d), and (f) HRTEM image of the InBi cluster overlapped with GaAs with the simulated image, obtained for the defocus of −56 nm and thickness of 20 nm (13.5 nm of GaAs and 6.5 InBi) in the inset. (the arrows demonstrate the similar elements on the experimental and simulated images.)

EDX maps of distribution of atoms inside the tetragonal QD-like cluster: (a) Dark field high angular STEM of the InBi QD-like cluster; (b) distribution of Bi atoms; (c) distribution of In atoms; (d) distribution of Ga atoms; (e) distribution of As atoms; (f) raw EDX spectrum from the cluster. The maps correspond to at.%.

The interplanar distance in the cluster, determined from the HAADF STEM image [Fig. 7(b)] is d = 0.33 nm and that is close to d{InBi{101}} = 0.345 nm for the tetragonal crystal structure (t-InBi)Reference Kubiak22 with space group (S.G.) P4/nmm and lattice parameters a = 0.5 nm and c = 0.48 nm different from the GaAs.
HRTEM images of the QD-like clusters shown in Figs. 7(c) and 7(d) demonstrate Moire patterns. The Moire patterns from the QD-like cluster shown in Fig. 7(c) is of parallel type with InBi[102]‖GaAs[111] orientation and with interplanar distance d = 0.635 nm. The experimental value of this distance is d exp = 0.65, and we believe that the difference appears due to the distortion of QD crystal lattice. The HRTEM image of the cluster shown in Fig. 7(d) was processed using two-dimensional fast Fourier transform (FFT) and it is presented in Fig. 7(e). The interplanar distances closely match t-InBi.Reference Kubiak22 However, the angle between [001] and [100] directions was found to be not 90°, but 85°, and we took that fact into account when we were simulating the images using JEMS software (CIME, EPFL, Lausanne, Switzerland).Reference Stadelmann23 That angle modification could arise due to epitaxial growth of the InBi cluster, which results in light monoclinic distortion of the crystal lattice. In the sake of the text shortness, we add just one simulation of InBi and GaAs overlapped structures with the visible Moire pattern shown in the inset of the experimental image [see Fig. 7(f)]. We performed simulations for different values of objective lens defocus, and InBi/GaAs thickness but acceptable match (which is in the inset) was obtained for the defocus of −56 nm and thickness of 20 nm (13.5 nm of GaAs and 6.5 InBi).
The HRTEM image of the QD-like cluster in Fig. 7(d) demonstrates the superposition of GaAs and InBi lattices resulted in the more complicated Moire pattern. The two-dimensional FFT pattern from this precipitate is shown in Fig. 7(e). The maxima from GaAs and InBi lattices (indicated by arrows) and from Moire are designated. The InBi maxima correspond to the interplanar distances d{InBi(001)} = 0.48 nm and d{InBi(100)} = 0.5 nm. Triangle markers indicate reflexes correspond to Moire fringes. The angles between crystallographic directions c*InBi and a*InBi and [002]*, [111]* GaAs are θ = 14° and 6° correspondingly. The periodicity of Moire fringes are D1 = 6.3 nm and D2 = 0.83 nm. The calculation of Moire fringe periodicities for GaAs and InBi in the proposed zone axis are D1 = 6.3 nm and D2 = 0.9 nm, correspondingly. Relatively negligible difference could be due to As impurities in the QD-like clusters.
The InAs and In(As,Bi) layers in both the samples were also studied by EDX microanalysis.
According to our estimations, approximately 75% of the total number of QD-like clusters in the layer adopted the ZB structure [see Fig. 7(a)]. These In(As,Bi) QD-like clusters were observed recently in the low-temperature grown A3(B5,Bi) heterosystems (see, e.g., Ref. Reference Luna, Wu, Hanke, Puustinen, Guina and Trampert6).
The QD-like clusters of second type (approximately 25% of total amount of QD-like clusters in the layer) have a tetragonal crystal lattice.
According to EDX (see Fig. 8) data, the amount of As and Ga in the clusters is low. Ga atoms are practically absent not only in QD-like clusters but also in the entire In(As,Bi) layer, which is visible in elemental maps. However, the presence of Moire fringes in the tetragonal clusters pointed to the overlapping of two lattices and that is visible on the raw EDX spectrum shown in Fig. 8(f). Based on the analysis of FFT patterns, we conclude that t-InBi clusters could be Ga- and As-free.
Almost all Bi are confined within QD-like clusters. Similar diffusion of Bi atoms from the layer has been repeatedly noted in the literature for systems A3B5 enriched by Bi.Reference Dominguez, Reyes, Bastiman, Sales, Richards, Mendes, David and Gonzalez5,Reference Wu, Luna, Puustinen, Guina and Trampert7 However, as observed in Ref. Reference Wu, Luna, Puustinen, Guina and Trampert7, formation of clusters of pure Bi was not detected in this work.
IV. DISCUSSION
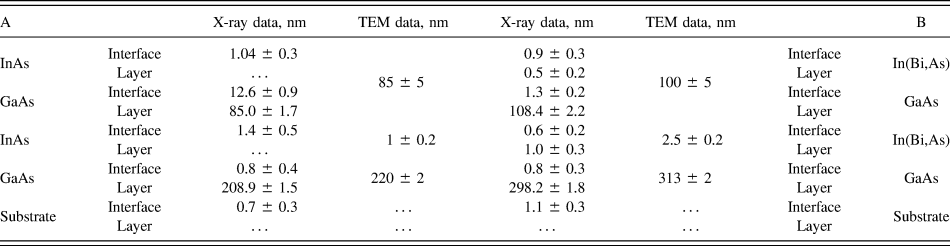
The results of the complex study by means of XRD, XRR, TEM, STEM, and EDX microanalysis enable us to determine several characteristics of GaAs/In(As,Bi) heterosystems. The thicknesses of the layers are summarized in Table I. During the processing of X-ray data, each layer was artificially divided on: first one, with constant structural parameters and second one, which was transition layer with structural parameters varied as described in Ref. Reference Aronzon, Pankov, Rylkov, Meilikhov, Lagutin, Pashaev, Chuev, Kvardakov, Likhachev, Vihrova, Lashkul, Lahderanta, Vedeneev and Kervalishvili24. Mathematical processing of X-ray data was carried out in several iterations in close correlation with the analysis of images obtained by electron microscopy. As a result, self-consistent values of layer thickness were obtained on different scales. The mismatches in the thickness values can be explained by averaging of the thickness of the layers during X-ray measurements on an area about several mm2, while electron microscopy gives information about the thicknesses on scales of several tens of nanometers. A thin upper amorphous oxide layer with the thickness of about 3 nm was detected by the TEM/STEM with the weak In peak detected by EDXS from this area, which support the coincidence between the TEM/STEM and X-ray data.
Thicknesses of layers of A and B structures from the analysis of X-ray and electronic microscopy methods.

Then, the general morphological features of the heterosystems were considered. A joint analysis of XRD and XRR data allowed us to refine the structure model for the upper layer of In(As,Bi). The XRR curve from sample B contains an extended oscillation, which corresponds to a layer of approximately 1.6 nm thick. The absence of such an oscillation in sample A could be due to small thickness of the layer and intermixing of In and Ga atoms. We consider that oscillation exists in sample B due to sufficiently sharp boundary in core electron density distribution between In(As,Bi) and GaAs layers.
The XRD data presented in Table I indicate a more diffuse InAs/GaAs interfaces in sample A as compared to the In(As,Bi)/GaAs interface in sample B. The XRD curve analysis (Fig. 2) indicated that the interface thicknesses in sample A are larger than those in sample B. The curve, obtained from sample A, shows a rapidly damped oscillation pattern, and at the curve from sample B, the oscillations propagate over a wider angular range. As it can be seen from the HAADF STEM images (Fig. 5), the interface regions for these samples have approximately the same thickness and their difference cannot explain the difference in XRD patterns.
The difference in oscillation patterns of XRD curves from two samples can appear due to different strain values at the interfaces. This affects the scattering of X-rays, which leads to different attenuation rates of the oscillatory pattern on XRD. The strain value at the InAs/GaAs interface in sample A is, therefore, larger than that at the InAsBi/GaAs interface in sample B.
HR STEM images of the interface in both the samples were processed using the geometric phase method.Reference Gutakovsky, Chuvilin and Song25 As a result, the strain in the growth direction at the interfaces was determined in both samples: in sample A, it was 0.022, and in sample B, it varies from 0.014 to 0.025. This ambiguity is explained by the inhomogeneity of the In(As,Bi) layer. There are different In(As,Bi) QD-like clusters, and around them, the strain value drops down to 0.014, whereas in the areas away from QD-like clusters, it increases up to 0.025. The QD-like cluster density in the In(As,Bi) layer was estimated as (3.5 ± 0.3) × 1010 cm−2, which is sufficient to reduce the average magnitude of the strain at the interface. And this strain reduction causes more extended oscillation pattern on the XRD curve.
The amplitudes of the oscillations on XRD curves (see the inset in Fig. 2) are close in magnitude. This indicates a relatively small difference in the crystal lattice parameters of adjacent layers in both the samples. At the same time, t-InBi-containing QD-like clusters with crystal structures found by TEM differ strongly by lattice parameters from GaAs. This small difference can be explained by relatively low density of t-InBi QD-like clusters.
Based on the described results of the structural analysis of the samples grown under the same conditions with and without the presence of a Bi atoms during the growth, some assumptions can be made on the growth mechanism of the In(As,Bi) layer. The low-temperature growth of the In(As,Bi) layer leads to sufficient strain at the interfaces; however, the introduction of Bi atoms provides strain relaxation path in our case, by lateral fragmentation of the In(As,Bi) layer in the form of Bi-containing QD-like clusters. The subsequent growth of the GaAs layer at 550 °C had an annealing effect on the In(As,Bi) layer. During that annealing, the Bi atoms diffused from the In(As,Bi) layer forming the clusters of two types. First type is In(As,Bi) QD-like clusters adopted ZB structure. In that case, there is partial substitution of As by Bi atoms. Second type is QD-like clusters exhibited the tetragonal crystal structure. We did not found any traces of pure Bi clusters, like found in A3B5 bismuthides described in Refs. Reference Wang, Zhang, Yue, Liang, Chen, Li, Lu, Shao and Wang1 and Reference Luna, Wu, Hanke, Puustinen, Guina and Trampert6, but the binary InBi QD-like clusters previously observed only in layers with 25 nm thickness and more.Reference Dominguez, Reyes, Bastiman, Sales, Richards, Mendes, David and Gonzalez5
V. CONCLUSION
A complex of local and integral methods of analysis were used for the study of the influence of Bi doping on the formation of the In(As,Bi) layer in the GaAs matrix during the low-temperature growth. Such a layer consists on In(As,Bi) and InBi QD-like clusters distributed laterally with the density approximately (3.5 ± 0.3) × 1010 cm−2. In(As,Bi) and InBi clusters exhibited ZB and tetragonal crystal structure, correspondingly. This cluster formation leads to the strain relaxation in the direction of growth at the InAs,Bi/GaAs interface.
ACKNOWLEDGMENTS
This work was supported by RFBR, Grants Nos. 18-02-00842-a and 16-29-03352-ofi-m. The SEM and X-ray measurements were performed using the equipment of the Resource Center of Probe and Electron Microscopy, the Resource Center of X-ray Methods (The Kurchatov Complex of NBICS-Technologies, the NRC “Kurchatov Institute”) and at the Kurchatov Synchrotron Radiation Source. The TEM experiments were supported by the Federal Agency of Scientific Organizations (Agreement No. 007-GZ/Ch3363/26).