


Many advanced democracies are currently experiencing remarkably high levels of economic inequality, driven primarily by the concentration of wealth and income among the very rich (Bourquin, Brewer, and Wernham Reference Bourquin, Brewer and Wernham2024; Chancel et al. Reference Chancel, Piketty, Saez and Zucman2022); this inequality has potentially adverse social and political consequences (Kawachi et al. Reference Kawachi, Kennedy, Lochner and Prothrow-Stith1997; Solt Reference Solt2008; Wilkinson and Pickett Reference Wilkinson and Pickett2009). Because voters’ support for or opposition to redistributive policies plays a vital role in shaping the level of economic inequality within a country, scholars have placed the interplay between inequality and support for redistribution under considerable scrutiny. Classic accounts emphasize the relationship between macro-level inequality and redistributive preferences (Meltzer and Richard Reference Meltzer and Richard1981), but the empirical evidence remains mixed. Some studies dispute the connection (Bartels Reference Bartels2005; Bublitz Reference Bublitz2022; Kelly and Enns Reference Kelly and Enns2010; Trump and White Reference Trump and White2018), whereas others find supporting evidence (Hillen and Steiner Reference Hillen and Steiner2025; Velev and Schmidt-Catran Reference Velev and Schmidt-Catran2024; Wiesner Reference Wiesner2025).
To better understand the relationship between economic inequality and support for redistribution, recent research has increasingly focused on individuals’ perceptions of economic inequality. In this line of work, “perceptions of economic inequality” refer not only to perceptions of aggregated levels of economic disparities (Choi Reference Choi2019; Kuhn Reference Kuhn2020; McCall et al. Reference McCall, Burk, Laperrière and Richeson2017; Norton and Ariely Reference Norton and Ariely2011; Trump Reference Trump2018) but also to a more relational approach that centers on specific socioeconomic groups, most commonly the poor and the wealthy (e.g., Brown-Iannuzzi et al. Reference Brown-Iannuzzi, Lundberg, Kay and Payne2015; Cavaillé Reference Cavaillé2023; Cavaillé and Trump Reference Cavaillé and Trump2015; Condon and Wichowsky Reference Condon and Wichowsky2020a; Reference Condon and Wichowsky2020b; Piston Reference Piston2018).
With respect to the wealthy, evidence demonstrates that being confronted with and thinking about the economically better off makes people feel closer to poor people and increases support for redistribution (Brown-Iannuzzi et al. Reference Brown-Iannuzzi, Lundberg, Kay and Payne2015; Condon and Wichowsky Reference Condon and Wichowsky2020b; Sands and Kadt Reference Sands and de Kadt2020; Thal Reference Thal2020). In contrast, downward comparisons trigger psychological differentiation, allowing individuals to view themselves as different from and superior to the poor (see, e.g., Fiske Reference Fiske2011; Halpern-Meekin et al. Reference Halpern-Meekin, Edin, Sykes and Tach2015; Taylor, Wood, and Lichtman Reference Taylor, Wood and Lichtman1983; Wheeler and Miyake Reference Wheeler and Miyake1992). Yet, the redistributive consequences of downward comparisons are more mixed. Some empirical studies find that local exposure to poor people reduces support for redistribution among the affluent (Christensen, Dinesen, and Sønderskov Reference Christensen, Dinesen and Sønderskov2024; Sands Reference Sands2017; though see also Minkoff and Lyons Reference Minkoff and Lyons2019 or Rao Reference Rao2019), and experimental studies that directly induce comparisons with the poor generally find limited or null effects on redistribution attitudes (Condon and Wichowsky Reference Condon and Wichowsky2020b). One reason may be that individuals react in divergent ways when their attention is directed toward the poor: for some, feelings of solidarity and sympathy with disadvantaged groups strengthen support for redistribution (Dietze and Craig Reference Dietze and Craig2021; Piston Reference Piston2018), whereas for others, negative stereotypes dampen it (Aarøe and Petersen Reference Aarøe and Petersen2014; Hansen Reference Hansen2023).
In this article, I focus on bidirectional (two-sided) comparisons, rather than isolated upward or downward comparisons, and how they shape support for redistribution, particularly (though not exclusively) through policies that improve the material conditions of the poor, often referred to as redistribution that gives to the poor (Cavaillé Reference Cavaillé2023; Cavaillé and Trump Reference Cavaillé and Trump2015).Footnote 1 This bidirectional comparison perspective directs attention and comparisons simultaneously to both ends of the income distribution. Accordingly, I narrow the focus to individuals who self-identify their household as middle-income, because they can compare their economic resources with both the rich and the poor. In addition to being the theoretically most relevant group, middle-income households are often assumed to be central to the politics of redistribution (Iversen and Soskice Reference Iversen and Soskice2006; Lupu and Pontusson Reference Lupu and Pontusson2011).Footnote 2
I argue that one of two competing psychological mechanisms may be activated when bidirectional comparisons induce individuals to perceive themselves as economically close to the poor and clearly distant from the rich. These mechanisms—social affinity or status and economic competition—produce divergent expectations about support for redistribution.
Following existing research (e.g., Condon and Wichowsky Reference Condon and Wichowsky2020a; Lupu and Pontusson Reference Lupu and Pontusson2011), the social affinity mechanism holds that individuals who perceive economic proximity to the poor combined with substantial upward distance are more likely to interpret their material interests as aligned with the poor and to experience greater solidarity and identification with them, increasing support for redistributive policies that give to the poor and take from the rich.
Drawing on research from sociology (Gidron and Hall Reference Gidron and Hall2017), social psychology (Brown-Iannuzzi et al. Reference Brown-Iannuzzi, Lundberg, Kay and Payne2015), and comparative political economy (Corneo and Grüner Reference Corneo and Grüner2002; Shayo Reference Shayo2009), the status and economic competition mechanism provides an alternative account of how perceived economic distances shape support for redistribution to the poor. Specifically, perceiving economic proximity to the poor alongside substantial upward distance may heighten concerns about economic and status rivalry with those below, which reduces support for downward redistribution. Under such conditions, the poor rather than the rich are more likely to be perceived as the primary competitors for scarce material resources and social standing. These competitive sentiments undermine feelings and emotions such as solidarity and compassion that would otherwise increase concern about the material conditions of the poor.
To test these competing expectations, I combine two original and preregistered survey experiments conducted in the United Kingdom (n = 1,781 and n = 1,689, respectively) with cross-sectional observational data from 14 countries.Footnote 3 Rather than inducing one-sided comparisons that prompt respondents to consider the poor or the rich in isolation, I manipulate respondents’ perceptions of economic distances by providing information about the structure of the income distribution, highlighting their economic distance from both the poor and the rich. In the observational data, I mirror the bidirectional structure of the experimental studies, allowing me to assess whether the observed patterns in the experiments are found across countries with different welfare regimes.
The experimental results demonstrate that perceiving economic proximity to the poor alongside distance from the rich reduces support for redistribution that gives to the poor while leaving support for taking from the rich unaffected. To substantiate the status and economic competition argument, I present suggestive evidence that perceptions of economic and status-based competition with the poor constitute a key mechanism linking relative status to support for redistribution. Complementing these findings, the observational analysis shows that individuals who identify their household as middle-income express the least support for redistribution to the poor when their perceptions of downward economic proximity coincide with substantial upward distance.
In sum, this article contributes to ongoing debates about how economic inequality and perceptions of it shape individuals’ support for redistribution. Building on prior research on social comparisons (e.g., Cansunar Reference Cansunar2021; Condon and Wichowsky Reference Condon and Wichowsky2020b; Piston Reference Piston2018; Sands Reference Sands2017; Sands and Kadt Reference Sands and de Kadt2020), I focus on how inducing bidirectional comparisons—directing attention and comparisons to both ends of the income distribution—shapes attitudes toward redistribution. In contrast to isolated upward comparisons, which make individuals feel closer to the poor and thereby increase support for redistribution (Condon and Wichowsky Reference Condon and Wichowsky2020b), this article demonstrates that bidirectional comparisons may have the opposite effect on attitudes toward redistribution that gives to the poor. When such comparisons lead individuals to perceive themselves as close to the poor and clearly distant from the rich, they become less supportive of redistribution to the poor. Theoretically, these results are consistent with the status and economic competition mechanism derived from prior work (e.g., Gidron and Hall Reference Gidron and Hall2017; Shayo Reference Shayo2009), suggesting that social and economic status links social comparisons to support for redistribution (see also Thal Reference Thal2020, who studies status seeking among affluent Americans). Empirically, I broaden the scope by combining two preregistered survey experiments in the United Kingdom with cross-national observational data from 14 democracies. Although the experimental evidence remains central for identifying the underlying mechanism, the cross-sectional results provide suggestive evidence that the redistributive effects of bidirectional comparisons extend across countries with different welfare regimes, indicating a general psychological process shaping citizens’ attitudes toward redistribution to the poor.
These findings also offer important implications for policy makers seeking to build pro-redistributive coalitions amid growing concentrations of wealth and income among the very rich. Because such developments may amplify the tendency to favor downward comparisons (Fiske Reference Fiske2011) while simultaneously increasing the perception among middle-income voters that their economic gap to the poor relative to the rich has become smaller (Payne Reference Payne2017), policy makers may be more successful in combating rising inequality by focusing on strengthening large-scale social policy programs such as education and healthcare, rather than on redistribution policies that primarily benefit individuals at the bottom of the income distribution.
Economic Inequality and Attitudes toward Redistribution
Although the relationship between economic inequality and attitudes toward redistribution has received considerable scholarly attention, the nature of this relationship is far from settled. The prominent and hotly debated Meltzer–Richard model perceives citizens as economically self-interested and contends that the median voter will support redistribution when the gap between the median and mean income is large (Meltzer and Richard Reference Meltzer and Richard1981). However, empirical evidence regarding its predictions remains mixed. Some recent studies using macro-level evidence provide supporting evidence (Hillen and Steiner Reference Hillen and Steiner2025; Wiesner Reference Wiesner2025; see also Finseraas Reference Finseraas2009; Kenworthy and Pontusson Reference Kenworthy and Pontusson2005), whereas others suggest that the electorate becomes more conservative under high levels of economic inequality (e.g., Bartels Reference Bartels2005; Bublitz Reference Bublitz2022; Kelly and Enns Reference Kelly and Enns2010; Trump Reference Trump2018). Moreover, there is ample reason to believe that the relationship between economic inequality and political attitudes is either weak or nonexistent. Among the factors proposed to explain this pattern are certainty about future income (Moene and Wallerstein Reference Moene and Wallerstein2001; Rehm, Hacker, and Schlesinger Reference Rehm, Hacker and Schlesinger2012), prospects of upward mobility (Benabou and Ok Reference Benabou and Ok2001), and beliefs about whether economically disadvantaged groups are lazy or hard-working (Aarøe and Petersen Reference Aarøe and Petersen2014; Hansen Reference Hansen2023).
Another important line of work in political economy examines the impact of the structure of inequality; see Kevins et al. (Reference Kevins, Horn, Jensen and van Kersbergen2018) for an overview.Footnote 4 As Lupu and Pontusson (Reference Lupu and Pontusson2011, 319) show, spending on social programs and redistribution from rich to poor are greater in countries where the income distance between middle-income voters and the poor is smaller relative to the distance between the middle and the rich—a condition they refer to as skewed. Their argument is that middle-income citizens empathize more with the poor when the economic gap between them narrows, because it reduces physical and psychological segregation between the groups. However, these empirical results have received some pushback from Luebker (Reference Luebker2019), who shows that they are, to some extent, driven by omitted variable bias.
Moving beyond the role of macro-level inequality, scholars also examine how perceptions of economic inequality influence support for redistribution (e.g., Bublitz Reference Bublitz2022; Choi Reference Choi2019; McCall et al. Reference McCall, Burk, Laperrière and Richeson2017). In addition to studying perceptions of aggregated inequality—often by presenting information about the overall level of economic inequality—researchers have adopted a more relational approach. This perspective emphasizes how thinking about and comparing oneself to the rich and the poor influence redistributive preferences (e.g., Brown-Iannuzzi et al. Reference Brown-Iannuzzi, Lundberg, Kay and Payne2015; Christensen, Dinesen, and Sønderskov Reference Christensen, Dinesen and Sønderskov2024; Condon and Wichowsky Reference Condon and Wichowsky2020a, 2020a; Sands Reference Sands2017; Sands and Kadt Reference Sands and de Kadt2020).Footnote 5
Drawing on social psychological research, Condon and Wichowsky (Reference Condon and Wichowsky2020a, 151) argue and show empirically that upward comparisons with the rich—that is “understanding the world and one’s place within it by making comparisons with other people”—negatively shape subjective social status, making individuals feel closer to the poor and, in turn, more supportive of redistribution (see also Brown-Iannuzzi et al. Reference Brown-Iannuzzi, Lundberg, Kay and Payne2015; Thal Reference Thal2020). More broadly, rising (top-end) inequality has been linked to heightened status insecurity among the public (Engler and Weisstanner Reference Engler and Weisstanner2021; Schneider Reference Schneider2019), underscoring that upward comparisons are often experienced as uncomfortable and threatening to one’s self-esteem (Gerber, Wheeler, and Suls Reference Gerber, Wheeler and Suls2018).
In contrast, downward comparisons with the poor tend to be less psychologically threatening (Wheeler and Miyake Reference Wheeler and Miyake1992; Wills Reference Wills1981) and can even serve a status-enhancing function (Fiske Reference Fiske2011). Research from social psychology and sociology shows that such comparisons trigger processes of differentiation and contrast, activating negative stereotypes that allow individuals to view themselves as different from and superior to the poor (Gerber, Wheeler, and Suls Reference Gerber, Wheeler and Suls2018; Halpern-Meekin et al. Reference Halpern-Meekin, Edin, Sykes and Tach2015; Taylor, Wood, and Lichtman Reference Taylor, Wood and Lichtman1983). These processes, in turn, elevate perceived social status and increase subjective economic distance from disadvantaged groups (Brown-Iannuzzi et al. Reference Brown-Iannuzzi, Lundberg, Kay and Payne2015; Condon and Wichowsky Reference Condon and Wichowsky2020b). Yet, the redistributive consequences of such downward comparisons are empirically contested. Some studies find that local exposure to poverty reduces support for redistribution among the affluent (Christensen, Dinesen, and Sønderskov Reference Christensen, Dinesen and Sønderskov2024; Sands Reference Sands2017; although see also Minkoff and Lyons Reference Minkoff and Lyons2019), whereas others show that downward outgroup exposure increases prosociality and generosity among wealthy students in Indian schools (Rao Reference Rao2019). Although such findings may be attributed to social comparison processes, experimental studies that directly induce comparisons with the poor show limited or no effects on redistribution attitudes (Condon and Wichowsky Reference Condon and Wichowsky2020a; Reference Condon and Wichowsky2020b). This overall null pattern may reflect that individuals respond in divergent ways when attention is drawn to the poor: for some, sympathy with the disadvantaged fosters greater support (Dietze and Craig Reference Dietze and Craig2021; Piston Reference Piston2018); for others, negative stereotypes dampen it.
Building on these insights from the social comparison literature and drawing on the comparative political economy literature on the structure of inequality (Kevins et al. Reference Kevins, Horn, Jensen and van Kersbergen2018; Lupu and Pontusson Reference Lupu and Pontusson2011), I focus on how bidirectional comparisons, rather than isolated upward or downward comparisons, shape attitudes toward redistribution. This perspective directs attention simultaneously to both ends of the income distribution. When this process leads individuals to perceive themselves as close to the poor but at a substantial upward distance from the rich, two competing psychological mechanisms—social affinity or status and economic competition—may be activated and produce divergent expectations about support for redistribution policies that either give to the poor or take from the rich. These mechanisms are outlined in the following section.
Social Affinity or Competition?
The social affinity mechanism follows existing research that social closeness to economic groups fosters a sense of shared life circumstances and identification, which influences support for redistribution (Condon and Wichowsky Reference Condon and Wichowsky2020b; Lupu and Pontusson Reference Lupu and Pontusson2011). This implies that individuals who feel economically close to the poor and far from the rich are more likely to view their own lives as similar to those of disadvantaged groups and to perceive their life trajectories as intertwined. This perceived proximity strengthens identification with the poor and increases solidarity and warmth toward them, two important drivers of support for redistribution conceived as giving to the poor (Cavaillé Reference Cavaillé2023; Hansen Reference Hansen2023; Piston Reference Piston2018). In addition, the belief in widespread economic differences from the rich makes people feel that they are poorer than they really are (Payne Reference Payne2017), which further reinforces group identification with the poor and increases solidarity and empathy with them.
These feelings of shared fate with the poor may also spill over into support for redistribution policies that take from the rich. When individuals perceive their economic interests as more aligned with those of the poor than with the wealthy, they are more likely to view redistribution away from the rich as economically beneficial to them. Similarly, perceiving social closeness with the poor rather than with the rich may weaken beliefs in upward mobility and further increase support for redistribution. Consistent with this explanation, Cansunar (Reference Cansunar2021) finds, using a cross-sectional research design, that perceiving a large economic distance from the rich is positively related to support for redistribution that takes from the rich.
By contrast, the status and economic competition mechanism suggests that perceiving proximity to the poor alongside distance from the rich can trigger competitive sentiments in terms of status and economic resources with the poor, reducing support for redistribution that helps the poor. According to social rivalry theory, individuals are especially concerned about the gap between their own income and that of the poorest in society, because they derive utility from living a life distinct from and superior to that of the poor (Corneo and Gruner Reference Corneo and Gruner2000; 2002; see also Hoy and Mager Reference Hoy and Mager2021; Shayo Reference Shayo2009).Footnote 6 This status rivalry with those below may be felt most intensely when individuals perceive themselves as economically close to the poor yet clearly distant from the rich. In this position, their social standing appears increasingly contested from below, because the poor may be seen as encroaching on and imitating their lifestyle. At the same time, the wealthy are perceived as living a life clearly distinct from their own, making access to the status associated with them seem out of reach. This may, in turn, direct competitions for social status downward rather than upward, intensifying rivalry with the poor rather than with the rich.
These intensified feelings of status competition with the poor can reduce support for redistribution that targets them. The negative effect materializes in part because the pursuit of social status conflicts with sympathy and compassion for others, which are strong drivers of support for redistribution that helps the poor (Piston Reference Piston2018; Sznycer et al. Reference Sznycer, Seal, Sell, Lim, Porat, Shalvi, Halperin, Cosmides and Tooby2017). Under such heightened status concerns, self-enhancement values are activated, undermining values of universalism and compassion that would otherwise increase concern for the welfare of the needy (Schwartz Reference Schwartz and Zanna1992; Reference Schwartz, Mikulincer and Shaver2010). Accordingly, perceiving proximity to the poor alongside distance from the rich is expected to reduce support for policies that give to the poor but to have almost no effect on preferences for redistribution that takes from the rich, which are rooted in material self-interested concerns, rather than solidarity and sympathy (Cavaillé Reference Cavaillé2023; Cavaillé and Trump Reference Cavaillé and Trump2015; Piston Reference Piston2018).
This logic parallels the last-place aversion theory, which holds that concerns about relative position dampen demand for redistribution due to fears that inequality-reducing policies will disproportionately benefit those below them economically (Kuziemko et al. Reference Kuziemko, Buell, Reich and Norton2014). This occurs partly due to loss aversion, because individuals fear that policies reducing inequality will disproportionately benefit lower-income groups, thereby undermining their relative status. However, I argue that such opposition may also be driven by perceived rather than objective economic distance alone, allowing status-based resistance to redistribution to emerge across the income distribution, including among relatively wealthy individuals who feel economically close to and thus threatened by the poor.Footnote 7
Adding to this status competition is a clash of economic interests. When individuals see themselves as economically close to the poor and distant from the rich, they may infer that competition for scarce resources primarily involves those just below them, rather than those at the top. This perception of economic competition could, for example, be reflected in concerns about competition with poor people for the same pool of (low-paying) jobs. This creates an environment of perceived rivalry with poor people, stemming from the zero-sum nature of many economic goods; that is, a shared intuition that achieving economic success is contingent on preventing success and payoffs for a rival (poorer) group (Boyer and Petersen Reference Boyer and Petersen2018; Brown, Jacoby-Senghor, and Raymundo Reference Brown, Jacoby-Senghor and Raymundo2022). As a result, individuals may come to view the poor, not the rich, as their primary economic competitors and oppose redistributive policies that benefit them.
Research Design
I use a combination of cross-national survey data and survey experiments to test my theoretical argument. Studies 1 and 2 consist of two nationally representative survey experiments with British voters, where respondents were randomly assigned to treatment conditions that manipulate the perception of economic distance to the rich and the poor among individuals who perceive their household as middle-income. In the first survey experiment, respondents were assigned to one of three conditions (two treatment conditions and one control group). Participants assigned to the two treatment conditions read information, including graphical material, depicting real-world economic distances between rich, poor, and middle-income households. Using data on real-world economic distances ensured that the treatment resembled situations encountered outside an experimental setting, thereby making it more realistic.
To increase experimental control, respondents in study 2 were presented with one of two conditions based on hypothetical survey vignettes depicting different economic distances between rich, poor, and middle-income households in an imaginary country. In addition to estimating the causal effect of perceptions of economic distances on attitudes toward redistribution that gives to the poor, this survey experiment enabled me to explore the mechanism linking the two concepts.Footnote 8 Although the second experiment lacked realism, the use of hypothetical scenarios was an important methodological tool for isolating a precise mechanism (McDonald Reference McDonald2020).
In study 3, I use data from the Inequality and Politics Survey spanning 14 countries (see Pontusson et al. Reference Pontusson, Giger, Rosset and Lascombes2020 for more information). Respondents are asked to estimate the income (after taxes) of various households, including poor and rich households. Inspired by Cansunar (Reference Cansunar2021), I constructed measures of perceived economic distance based on the gap between respondents’ own income and their estimates of the income of rich and poor households. To mirror the bidirectional structure of the experimental studies, I combined these measures into an indicator capturing the configuration of perceived income distances. Doing so allowed me to provide suggestive evidence on whether the experimental patterns extend across a broader set of countries.
Measurements
The outcome measures used across studies are listed in table 1. Importantly, the measures used in the two experimental studies were validated and used in prior research (see, e.g., Cavaillé and Trump Reference Cavaillé and Trump2015; Hansen Reference Hansen2023; Sznycer et al. Reference Sznycer, Seal, Sell, Lim, Porat, Shalvi, Halperin, Cosmides and Tooby2017).Footnote 9
Outcome Measures

Table 1 Long description
The table is organized into four columns: Study, Redistribution aspect, Operationalization, and Response categories.
Study 1 includes five entries:
* Give to poor: Operationalized as ‘Poor people should get higher welfare benefits’. Response categories are a 7-point scale from 1. Strongly disagree to 7. Strongly agree.
* Give to poor: Operationalized as ‘Eligibility requirements for welfare benefits should be tightened?’. Response categories are the same 7-point scale.
* Give to poor by taking from rich: Operationalized as ‘Should the government tax the rich more than they currently do in order to support the poor?’. Response categories are 1. Strongly agree to 10. Strongly disagree.
* Take from rich: Operationalized as ‘The rich pay too much in income taxes.’. Response categories are the same 7-point scale.
* Take from rich: Operationalized as ‘Wealth should be taxed more than it is currently’. Response categories are the same 7-point scale.
Study 2 includes three entries under ‘Give to poor’:
* ‘The country should give more money to poor households to reduce inequality.’
* ‘The country should spend money on social assistance to poor households.’
* ‘The country should accept demands for more benefits from those with the fewest resources.’
All three use the 7-point scale from Strongly disagree to Strongly agree.
Study 3 includes three entries:
* Give to poor: Operationalized as a choice between higher earners getting more benefits, equal benefits, or lower earners getting more benefits due to need.
* Give to poor: Operationalized as a choice between higher earners getting larger pensions, equal pensions, or lower earners getting larger pensions.
* Give to poor by taking from rich: Operationalized as ‘What is your position on redistribution of wealth from the rich to the poor?’. Response categories are a scale from 0. Fully opposed to 10. Fully in favor.
These measures capture either the giving-to-the-poor or taking-from-the-rich dimension of redistribution preference. Importantly, except for the eligibility requirement measure, all items tapping the giving-to-the-poor dimension refer directly to improvements in the material conditions of low-income individuals. At the same time, the measures vary along three dimensions: (1) the label used to identify the beneficiaries, (2) the types of social policies under consideration, and (3) the extent to which redistribution is explicitly framed as a transfer from the rich to the poor. The third dimension presents a particularly demanding test because it conflates attitudes toward giving to the poor with attitudes toward taking from the rich—two distinct facets of redistribution preferences driven by different motives (Hansen Reference Hansen2023; Sznycer et al. Reference Sznycer, Seal, Sell, Lim, Porat, Shalvi, Halperin, Cosmides and Tooby2017).
Some measures, specifically those referring to concrete social policy programs such as unemployment benefits and pensions, require further clarification. Unlike standard social insurance programs, which are typically universal and provide benefits that are related to earnings with only a partial redistributive component (Moene and Wallerstein Reference Moene and Wallerstein2001; Rehm, Hacker, and Schlesinger Reference Rehm, Hacker and Schlesinger2012), these survey items ask respondents to indicate whether low- or high-income earners should receive higher absolute benefit levels than the other group. As such, they do not measure support for proportional social insurance per se but for making social insurance more explicitly redistributive than is typical of most earnings-related systems. Although this departs from standard social insurance programs, it allows the measures to more clearly reflect the giving-to-the-poor dimension central to the theoretical argument. To operationalize this, I recoded the items as binary variables, coding agreement that lower earners should receive more in unemployment benefits or pensions as support for giving to the poor (1), whereas the two remaining options, “higher earners who become unemployed temporarily should get more in benefits” and “high and low earners should get the same amount of benefits,” are coded as 0. This coding isolates explicit support for downward redistribution within social insurance from support for proportional or flat-rate insurance arrangements.
In line with the preregistration, the three items in study 2 are combined into a single additive index.Footnote 10 In study 1, the three items capturing the giving-to-the-poor dimension are also combined into an additive index.Footnote 11 All outcomes are rescaled to range from 0 (lower support for the poor/less redistribution) to 1 (greater support for the poor/more redistribution). By using this range of measures, the studies capture different facets of attitudes toward giving to the poor and, in doing so, strengthen the external validity of the findings (Druckman Reference Druckman2022).
To investigate the proposed mechanism, I used responses to a range of questions that measure status and economic competition in study 2.Footnote 12 In addition, to probe whether respondents actually care about the differences between the middle- and bottom-income households, I drew on a question that measures whether the differences are seen as fair or unfair, expecting that respondents who perceive a small distance from the poor will be more likely to view these differences as unfairly small. The measures are listed in table 2.
Mechanism Measures

Table 2 Long description
The table consists of four columns: Study, Concept, Operationalization, and Response categories.
* Study 2 entries:
- Concept: Status competition. Operationalization: Poor households put the status of middle-income households’ lifestyle under pressure. Response categories: A 7-point scale from 1 (Very unlikely) to 7 (Very unlikely).
- Concept: Status competition. Operationalization: Poor households lessen the prestige and reputation of middle-income households’ way of life. Response categories: Same as above.
- Concept: Economic competition. Operationalization: Poor and middle-income households compete for the same pool of jobs. Response categories: Same as above.
* Study 3 entry:
- Concept: Distance concern. Operationalization: In your opinion, do you think current income differences in your country between the middle-and bottom-income household are... Response categories: A 5-point scale including 1 (Very unfairly small), 2 (Unfairly small), 3 (Fair), 4 (Unfairly large), and 5 (Very unfairly large).
Experimental Studies in the United Kingdom
Both experiments were conducted in the United Kingdom, which in recent decades has been quite successful in reducing poverty. Reforms introduced under Prime Minister Tony Blair, particularly those targeting child poverty, led to measurable declines in relative poverty (Waldfogel Reference Waldfogel2010). Public support for redistribution in the United Kingdom is also generally high and broadly comparable to that in other Western democracies (Lindh and McCall Reference Lindh and McCall2020). This pattern also emerged across the two experiments, where support for anti-poverty and redistribution policies was generally high across treatment conditions.
Still, poverty remains heavily stigmatized, and the poor are often portrayed as unintelligent and lacking ambition (Tyler Reference Tyler2013). The United Kingdom also resembles the United States more than many other Western democracies in its high levels of economic inequality. Within the EU, only Lithuania exhibits greater inequality (Bourquin, Brewer, and Wernham Reference Bourquin, Brewer and Wernham2024). Additionally, recent income growth in the United Kingdom has been weak across the income distribution: whereas households in the bottom half fared slightly better than those in the top half, the top 5% saw their incomes rise sharply, widening the overall gap (Bourquin, Brewer, and Wernham Reference Bourquin, Brewer and Wernham2024). At the same time, the income composition of middle-income households has changed: state benefits account for a growing share of their income, bringing their sources of income sources closer to those of lower-income groups (Bourquin, Brewer, and Wernham Reference Bourquin, Brewer and Wernham2024). Together, these dynamics may facilitate perceptions of intensified competition over economic resources and social status between economic groups, making the United Kingdom a particularly suitable context for testing the theorized mechanism linking perceptions of economic distances with attitudes toward redistribution.
Study 1: Real-World Economic Distances
In study 1, I fielded a preregistered survey experiment in the United Kingdom, drawing on a sample of 1,689 respondents surveyed between May and June 2021.Footnote 13 Data collection was administered by YouGov, which used quota sampling on gender, age, geography, education, and social grade to ensure that the sample closely matched the national population.
Before being randomly assigned to treatment and control conditions, respondents answered a series of background questions, including a question about their economic self-placement on an income ladder from 1 to 10 (see appendix A.3 for question wording). The item was phrased to encourage a substantial share of respondents to consider their household as middle-income, thereby increasing the study’s statistical power. Immediately after answering this question, participants were randomly assigned to one of three conditions.
In the closer-to-poor condition, respondents read a short vignette accompanied by a graphic showing that the economic distance between middle-income households and the poor is smaller than the distance between middle-income households and the rich. In the further-from-poor condition, they saw a vignette and graphic presenting the opposite relationship, in which middle-income households are economically closer to the rich than to the poor. Both vignettes and graphics were based on data from the Office for National Statistics, ensuring that the information reflected real economic distances. The control group received no information. The stimulus materials are shown in figure 1.
Stimulus Material from UK Study 1
Note: The control group was not exposed to this material. Coins in the graphics are from wektorygrafika/Alamy (Image ID 2AK0T39), licensed.

Figure 1. Long description
The infographic consists of two vertical panels separated by a line.
Left Panel: Titled Closer to the poor. The text states that the economic distance between middle-income and rich households is larger than the distance between middle-income and poor households. It specifies that a rich household income is 5 times larger than a middle-income household, while a poor household is only 1.5 times smaller than a middle-income household. Below the text are three stacks of gold coins. From left to right: a very short stack labeled Poor, a slightly taller stack labeled Middle-income, and a very tall stack labeled Rich.
Right Panel: Titled Further from the poor. The text states that the economic distance between middle-income and rich households is smaller than the distance between middle-income and poor households. It specifies that a poor household income is 5 times smaller than a middle-income household, while a rich household is only 1.5 times larger than a middle-income household. Below the text are three stacks of gold coins. From left to right: a single coin labeled Poor, a medium-tall stack labeled Middle-income, and a slightly taller stack labeled Rich.
Both panels cite the O N S wealth and assets survey from July 2014 to June 2016 and mention data was collected before the C O V I D pandemic and Brexit.
An important consideration in designing these materials was ensuring that the information reflected actual economic distances. To achieve this while still manipulating perceptions of distance between economic groups, I presented respondents with different aspects of the economy. Respondents in the closer-to-poor condition received material based on wealth differences, whereas those in the further-from-poor condition were shown information on income differences. In both cases, I described the distances as economic distances to minimize any influence based on whether respondents were reading about income or wealth.Footnote 14
These conditions allowed me to test whether individuals who think of themselves as middle-income adjust their support for redistribution when induced to think that they are economically close to the poor but far from the rich, compared to a counterfactual scenario where they feel economically far from the poor and close to the rich. I labeled these conditions as the closer-to-poor and further-from-poor conditions, respectively, although they could be called closer-to-rich or further-from-rich. Rather than inducing one-sided comparisons that prompt respondents to consider the poor or the rich in isolation (e.g., Brown-Iannuzzi et al. Reference Brown-Iannuzzi, Lundberg, Kay and Payne2015; Condon and Wichowsky Reference Condon and Wichowsky2020a), these conditions manipulate perceptions of economic distance by eliciting bidirectional comparisons that simultaneously direct attention to both ends of the income distribution.
I classified respondents as self-perceived middle-income if they placed themselves and their household between the 30th and 70th percentile of the income distribution, corresponding to 65% of the overall sample.Footnote 15 I reported linear regression models with and without pretreatment covariates—compassion, envy, political ideology, age, income, and gender—that are important predictors of redistribution attitudes.Footnote 16
Results of Study 1
To determine whether the treatment conditions moved respondents’ perceptions of proximity to either the rich or the poor, I asked whether they agreed or disagreed with the statement that their income is much closer to poor people’s than to rich people’s income. Compared to the control group, respondents in the closer-to-poor group were 12 percentage points more likely to indicate that their income is closer to poor people’s than to rich people’s income (see appendix A.2). This substantial difference suggests that the closer-to-poor condition successfully manipulated respondents’ perceptions of their economic distances. Yet, I did not find any meaningful differences between the control group and the further-from-poor condition, either because the material presented in the latter reflected respondents’ baseline perceptions or because it elicited discomfort by being inconsistent with their established economic perceptions. As a result, I focus on the differences in redistribution attitudes between the closer-to-poor condition and the control group. However, I also report differences in redistribution attitudes between the closer-to-poor and further-from-poor conditions in the appendix (see tables A5 and A6).
As shown in panel A in figure 2, I find that respondents in the closer-to-poor condition on average are less supportive of redistribution to the poor than respondents in the control group. Being told that the economic distance to the poor is smaller than the distance to the rich reduces overall support for redistribution to the poor by 0.034 scale-points (SE = .016), equivalent to a 0.15 SD decrease in support for giving-to-the-poor, which is typically interpreted as a substantively small effect (Gignac and Szodorai Reference Gignac and Szodorai2016). For comparison, a one SD increase in dispositional compassion is associated with a 0.4 SD increase in such support
Perception of Economic Distances and Support for Redistribution
Notes: Estimates are based on OLS regressions. The giving-to-the-poor index is an additive index of (1) “Poor people should get higher welfare benefits,” (2) “Eligibility requirements for welfare benefits should be tightened,” and (3) “The government should tax the rich more than they currently do in order to support the poor.” Panel B contains (1) “The rich pay too much in income taxes” and (2) “Wealth should be taxed more than it is currently.” Items are measured on 7-point scales ranging from 1 (strongly disagree) to 7 (strongly agree). “Taxing the rich to support the poor” is measured on a 10-point scale. All items are rescaled to range from 0 to 1, such that higher values indicate stronger support for redistribution. For ease of visualization, the y-axis ranges from 0.3 to 0.8 in panels A and .50 to .90 in panel B. Thin error bars represent 95% C.I., and thick error bars represent 90% C.I. See appendix A.4 for regression models. Covariates are compassion and envy sentiments, political ideology, age, income, and gender.

Figure 2. Long description
The image consists of two vertically stacked dot plots, Panel A and Panel B. Both panels use a y-axis labeled Marginal mean and an x-axis labeled Outcome measure. Data points are categorized into four groups: Control (unadj.) as solid black circles, Control (adj.) as open black circles, Closer-to-poor (unadj.) as solid light gray circles, and Closer-to-poor (adj.) as open light gray circles. Each point includes thick and thin vertical error bars.
Panel A is titled Support for giving-to-the-poor. The y-axis ranges from 0.3 to 0.8. Along the x-axis, four measures are shown:
* Index: Control groups are approximately 0.57, while Closer-to-poor groups are lower at approximately 0.53.
* Higher benefits to poor people: Control groups are approximately 0.60, while Closer-to-poor groups are lower at approximately 0.54.
* Tighten requirements: All four groups are clustered closely around 0.48.
* Taking-from-rich-giving-to-poor: Control groups are approximately 0.62, while Closer-to-poor groups are lower at approximately 0.57.
Panel B is titled Support for taking-from-the-rich. The y-axis ranges from 0.5 to 1.0. Along the x-axis, two measures are shown:
* Income taxes up: Control groups are approximately 0.79, while Closer-to-poor groups are lower at approximately 0.76.
* Wealth taxes up: Control groups are approximately 0.69, while Closer-to-poor groups are lower at approximately 0.67.
In almost all categories across both panels, the Closer-to-poor experimental conditions show lower marginal means for redistribution support compared to the Control conditions.
Turning to the individual items, respondents in the closer-to-poor condition are 0.063 scale-point less supportive of higher benefits for the poor (SE = .021) and on average 0.055 scale- points less supportive of taking from the rich and giving to the poor compared to the control group (SE = .026). A notable exception emerges for attitudes toward welfare eligibility. I find no evidence that treated respondents are more supportive of tightening eligibility requirements for welfare benefits. One possible explanation is that this item captures more general attitudes toward welfare policy, rather than attitudes specifically tied to redistributive transfers to the poor.
As reported in panel B, there is little evidence that being given information about the economic distance to the rich and the poor affects attitudes toward taking from the rich. Across different model specifications, there are no statistically or substantially meaningful differences between respondents in the control group and the closer-to-poor treatment.
In appendix A.5, I probed these findings with a series of robustness checks of the baseline specification. First, as shown in tables A5 and A6, I reproduced the results using respondents in the further-from-poor condition as the comparison group. Second, as reported in the preregistration, I also ran the models after excluding inattentive respondents and using alternative cutoffs for when a respondent was classified as self-perceived middle-income. As shown in the appendix, these robustness checks reproduced the main findings of the baseline specifications. Finally, no statistically significant interaction effects were observed between the treatment groups and political ideology or income (appendix A.6). Notably, however, the treatment effect was stronger among men on the outcome measuring support for taking from the rich by giving to the poor. This finding may reflect that men incorporate different social categories into their understanding of economic groups and is consistent with prior research suggesting that the desire for social status tends to be stronger among affluent men, making them more economically conservative (Thal Reference Thal2020).Footnote 17
In sum, these findings show that providing respondents with information showing that the economic distance between them and the poor is smaller than the distance from the rich reduces support for redistribution to the poor but does not affect take-from-the-rich attitudes consistently. These results provide evidence in favor of the status and economic competition explanation. By drawing on real-world economic data, study 1 enhances the mundane realism of these results but does not allow me to identify the mechanisms linking perceived economic distance to support for redistribution. To address this, and to replicate the findings of study 1, I turn to study 2.Footnote 18
Study 2: Survey Experiment Using Imaginary Countries
Study 2 used a preregistered survey experiment fielded in the United Kingdom and conducted by YouGov between January and February 2022.Footnote 19 Quota sampling was done on gender, age, geography, education, and social grade.
In the survey, participants were asked to imagine living in a country where their economic resources placed them and their family among middle-income households. Next, they were randomly assigned to one of two conditions, in which they were presented with a short vignette and graphical material depicting different economic distances between rich, poor, and middle-income households in this country. The closer-to-poor condition depicted the economic distance between middle-income and poor households as smaller than the economic distance between middle-income and rich households; the further-from-poor condition showed the economic distance between middle-income and poor households as larger than the economic distance between middle-income and rich households. The stimulus material resembles the conditions used in study 1 and can be found in table A18 in appendix B.2.
When designing the treatments, I chose to adjust the resources of middle-income households, rather than those of poor households, to hold constant (1) the (perceived) absolute level of need among low-income households and (2) the level of inequality between low- and high-income groups, both of which shape citizens’ support for redistribution (see, e.g., Delton et al. Reference Delton, Petersen, DeScioli and Robertson2018; Gimpelson and Treisman Reference Gimpelson and Treisman2018). Although these scenarios may seem artificial and distant from real-world politics, I made sure that the distribution of economic resources reflected that of the real world to enhance experimental realism. To do this, I designed the closer-to-poor condition based on official data from the Office for National Statistics and presented it in an accessible and informative format.
Results
Figure 3 presents the main causal estimates of interest, and the underlying regression models are reported in appendix B.4.Footnote 20 I found that respondents in the closer-to-poor condition were, on average, significantly less supportive of redistributive policies that target the poor (measured using an index) than respondents in the further-from-poor condition. Without covariates, there is a statistically significant difference in support for giving-to-the-poor of -0.021 scale points (SE = 0.01); the results remain substantively similar when adding covariates (β = -0.018, p = 0.055).
Perception of Economic Distances and Attitudes toward Redistribution
Note: Estimates are based on OLS regressions. The index is an additive index of three items: (1) “The country should give more money to poor households to reduce inequality,” (2) “… spend money on social assistance to poor households,” and (3) “…accept demands for more benefits from those with the fewest resources.” All items are measured on 7-point scales ranging from 1 (strongly disagree) to 7 (strongly agree) but are rescaled to range from 0 to 1 such that higher values indicate stronger support. Thin vertical lines are 95% confidence intervals, and thick lines are 90% confidence intervals. See table A23 in appendix B.4 for regression models.

Figure 3. Long description
A coefficient plot based on O L S regressions.
* The vertical Y-axis is labeled Marginal effect of closer-to-poor and ranges from negative 0.25 to 0. A dashed horizontal reference line is at 0.
* The horizontal X-axis is labeled Outcome and contains four categories from left to right: Redistribution index, More money for the poor, Social assist. for the poor, and Accept demand for more benefits.
* A legend in the bottom-left indicates that black dots represent Without covariates and light gray dots represent With covariates.
* Each data point includes a thick vertical line for 90 percent confidence intervals and a thin vertical line for 95 percent confidence intervals.
Data trends from left to right:
1. Redistribution index: Both dots are positioned near negative 0.02. The gray dot is slightly higher (closer to zero) than the black dot.
2. More money for the poor: The black dot is at approximately negative 0.02. The gray dot is higher, at approximately negative 0.01.
3. Social assist. for the poor: Both dots are at approximately negative 0.015, with the gray dot slightly higher than the black dot.
4. Accept demand for more benefits: Both dots are lower than the other categories, positioned at approximately negative 0.025.
In all cases, the confidence intervals do not cross the zero line, indicating that the negative effects are statistically significant.
Figure 3 also shows that the results are not driven by one of the items used in the index. The fact that the findings also apply to the third outcome variable, which does not explicitly specify poor people as beneficiaries, suggests that the labeling of redistribution targets does not drive the results.Footnote 21 The effect of the closer-to-poor condition corresponds to respondents becoming 0.10 SD less supportive of giving-to-the-poor. Although this effect is small, it should be viewed as a conservative estimate because of the noncompliance in the further-from-poor condition and the lack of experimental realism. Combined, these results support the expectation and suggest a causal but small effect of perceptions of economic distances on support for redistribution.
Probing the Causal Mechanism
Are perceptions of economic and status competition plausible mechanisms underlying the effects found? As a first test, I examined whether the treatment conditions interact with respondents’ pretreatment level of status seeking, measured using an index (see appendix B.2 for the wording of items). If perceptions of status and economic competition link perceived distance to poor people and redistribution attitudes, the differences between the two treatment conditions should be largest among respondents who care the most about their own status. Panel A in figure 4 reports a linear interaction effect between the treatment conditions and status seeking for the different redistribution outcomes, whereas panel B reports a nonlinear interaction effect.
Interaction Effect between Closer-to-Poor People and Status Seeking
Note: Estimates are based on an OLS estimator controlling for political ideology, dispositional compassion, income, gender, age, and social grade. Thin vertical lines are 95% confidence intervals, and thick lines are 90% confidence intervals. Panel B reports the effect of the closer-to-poor condition for respondents below the 33rd percentile of the distribution of status seeking (low status seeking), between the 33rd and 66th (medium status seeking) percentiles, and above the 66th percentile (high status seeking). Wordings of the items used for the status-seeking index are shown in appendix B.2. See tables A26 and A27 in appendix B.4 for regression models.

Figure 4. Long description
A multi-panel figure with two vertically stacked coefficient plots. Both panels share a common x-axis labeled Outcome with four categories: Redistribution index, More money for the poor, Social assist. for the poor, and Accept demand for more benefits.
Panel A, titled Linear interaction effect, uses a y-axis labeled Interaction effect ranging from negative 0.3 to 0. The data points are open circles representing the interaction between being closer to poor and status seeking. All four points sit slightly below the zero-baseline, around negative 0.1, with vertical confidence interval lines crossing the zero-line for the first three outcomes and sitting just below it for the fourth.
Panel B, titled Non-linear interaction effect, uses a y-axis labeled Marginal effect of being closer to the poor ranging from negative 0.2 to 0. It displays three data points for each outcome category, color-coded by status seeking levels: black for Low, light gray for Medium, and dark gray for High.
* For all four outcomes, the Low status seeking group shows a positive marginal effect near 0.
* The Medium status seeking group shows a slight negative effect around negative 0.02.
* The High status seeking group shows the strongest negative effect, ranging from negative 0.04 to negative 0.06.
In all cases, the marginal effect becomes increasingly negative as status seeking increases. Thick vertical lines represent 90 percent confidence intervals and thin vertical lines represent 95 percent confidence intervals.
I report here the results when covariates are included to adjust for the nonrandomized moderator.Footnote 22 As seen in panel A in figure 4, I find a negative (albeit only significant at a 0.1 level) interaction effect (β = -0.090, p = 0.068), indicating that the negative effect of perceiving a small economic distance to poor people on support for giving-to-the-poor becomes stronger among those with higher levels of status seeking. Using a nonlinear interaction effect, I find no significant difference in redistribution attitudes between the two treatment conditions among respondents who care little about status. Yet, for those with high levels of status seeking, I find a significant and substantively meaningful effect. Among high status seekers, perceiving a small economic distance to poor people leads to a 0.039 scale-points decrease in support for giving to the poor (SE = 0.016). These results provide the first suggestive evidence that perceptions of status and economic competition serve as a mechanism between perceived distance and attitudes towards redistribution that targets the poor.
As a more direct test of the proposed mechanism, I also include a post-treatment variable, measuring respondents’ perceptions of competition between the middle and the poor in the imaginary country (see table 2 for the wording of the questions). As panel A in figure 5 shows, respondents in the closer-to-poor condition are significantly more likely to indicate the existence of economic and status competition between poor and middle-income households in the imaginary country than those who were in the further-from-poor condition. The difference in mean perceived competition between the two conditions varies between 0.021 and 0.027 scale-points depending on model specifications (p < 0.05). Moreover, the figure illustrates that those who perceive a small distance are particularly likely to think that they will have to compete with the poor for the same pool of jobs. These results substantiate the status and economic competition explanation by providing preliminary evidence that feelings of competition with poor people are a likely mechanism linking perceived economic distance to attitudes toward redistribution.
Testing the Mechanism Linking Perceived Distance to Poor People and Redistribution Attitudes
Notes: Estimates are based on OLS regressions. In panel A, the threat index is an additive index of the three items: (1) “Poor and middle-income households compete for the same pool of jobs,” (2) “Poor households put the status of middle-income households’ lifestyle under pressure,” and (3) “Poor households lessen the prestige and reputation of middle-income households’ way of life.” All items are measured on 7-point scales ranging from 1 (very unlikely) to 7 (very likely) and coded such that higher values indicate that the statement is likely to be true. In panel B, respondents are asked whether “poor households in the country they were asked to imagine are very hard-working or very lazy” (1 = very hard-working; 7 = very lazy), and whether “poor households are very greedy or very generous” (1 = very greedy; 7= very generous). All items were rescaled to range from 0 to 1. Thin vertical lines are 95% confidence intervals, and thick lines are 90% confidence intervals. See tables A24 and A25 in appendix B.4 for regression models.

Figure 5. Long description
The figure consists of two vertically stacked coefficient plots, Panel A and Panel B. Both panels use a horizontal dashed line at 0 to indicate no effect. Data points are shown as black circles for Without covariates and grey circles for With covariates, accompanied by thick 90 percent and thin 95 percent confidence interval vertical lines.
Panel A, titled Status and economic competition, has a y-axis labeled Marginal effect ranging from minus .05 to .25 and an x-axis labeled Outcome.
* Threat index: Both estimates are positive, approximately .03.
* Compete for same pool of jobs: Both estimates are positive, approximately .07.
* Status threat to lifestyle: Both estimates are slightly positive, near .01.
* Prestige is lessened: The black estimate is near 0, while the grey estimate is slightly negative.
Panel B, titled Placebo test, has a y-axis labeled Marginal effect ranging from minus .25 to 0 and an x-axis labeled Outcome.
* Poor are lazy: Both estimates are negative, approximately minus .02 for black and minus .03 for grey.
* Poor are generous: Both estimates are near 0, with the grey estimate being slightly positive.
An alternative explanation for the findings is that the perceived distance to poor people affects attitudes through deservingness sentiments (e.g., Aarøe and Petersen Reference Aarøe and Petersen2014). Those who perceive a small distance might become more likely to view poor households as undeserving by stereotyping them as lazy and not motivated to work, which would lead to a decrease in support for giving to the poor. To probe this, I included a post-treatment variable asking respondents whether they thought that the poor households in the country they were asked to imagine are very hard-working or very lazy (higher values = lazier).
Panel B in figure 5 shows that respondents in the closer-to-poor condition are slightly more likely to indicate that poor households are hard-working than respondents in the further-from-poor condition. Notably, the sign of the effect is negative and not positive, suggesting that stereotyped views about the poor being lazy are unlikely to explain the negative effect of perceiving a small economic distance from poor individuals on attitudes toward redistribution. Moreover, I do not find any significant effects of the treatment on perceptions of the poor as being generous.
In sum, the experimental studies demonstrate that individuals who perceive themselves as economically close to the poor and simultaneously distant from the rich are less supportive of giving to the poor, with suggestive evidence that perception of economic and status competition with poor people links perceived distances with support for redistribution to the poor. To examine whether the relationship extends across different institutional and welfare contexts not limited to the United Kingdom, I turn to study 3.
Study 3: Cross-Sectional Data
In study 3, I drew on cross-sectional data from a set of democracies for which information on perceptions of economic distance from the rich and the poor, as well as support for redistribution, was available (see Pontusson et al. Reference Pontusson, Giger, Rosset and Lascombes2020 for a description of the sample). The sample consisted of the following countries: Austria, Belgium, Denmark, France, Germany, Ireland, Italy, the Netherlands, Portugal, Spain, Sweden, Switzerland, the United Kingdom, and the United States. The surveys were collected between June and September 2019 and administered by Ipsos. National representative quotas were applied in all countries based on gender, age, education, region, and income quintile.Footnote 23
I measured perceptions of economic distances using a set of open-ended questions on the perceived income (after taxes) of various households along the income distribution: poor households (10% poorest households), households in the middle of the distribution (median), and rich households (90% richest households). I operationalized perceived economic distances asFootnote 24


Income is measured as household income after taxes and other deductions. Hence, the measure of economic distance from poor individuals increases when the respondent’s income rises relative to the estimated income of a poor household. Following standard practice in the literature using perceived earnings of occupational groups, I log-transform the perceived distance to account for the influence of outliers (Cansunar Reference Cansunar2021; Trump Reference Trump2018).Footnote 25 Perceived income distance from the rich and from the poor is negatively but only weakly correlated (Pearson’s r = –0.07), suggesting that perceptions of poor households’ earnings are largely unrelated to perceptions of rich households’ earnings.
To test the theoretical expectations, I focused on two complementary parameters. First, I examined whether perceived distance from the poor was associated with support for redistribution while holding perceived distance from the rich constant. This specification assesses whether individuals who perceive themselves as economically closer to poor households are less supportive of redistribution to the poor than those who perceive a greater distance, independent of how far they feel from the rich. Yet, this test is vulnerable to an important alternative interpretation—that perceived distance from the poor merely reflects subjective beliefs about how poor the poor actually are, rather than indicating competition with the poor.
To partly address this concern and more directly mirror the bidirectional structure of the experimental studies, I therefore constructed a second measure capturing the configuration of perceived distances. Specifically, I classified respondents into four groups based on whether they were above or below the median on perceived income distance from the poor and the rich:
-
1. Proximity to the poor and distance from the rich (above the median on distance from the rich and below the median on distance from the poor; 29% of the sample)
-
1. Proximity to both the poor and the rich (below the median on both measures; 22%)
-
3. Distance to the poor and proximity to the rich (above the median on distance to the poor and below the median on distance from the rich; 29%)
-
4. Distance from both the poor and the rich (above the median on both measures; 21%)
Empirically, to find evidence consistent with the status and economic competition mechanism, and in line with the experimental findings, support should be lowest among respondents who perceive proximity to the poor alongside upward distance from the rich. This configuration captures a relational position in which individuals experience economic compression from below while remaining clearly separated from the affluent, thereby heightening the salience of downward rivalry.Footnote 26
Formally, I estimated OLS regression models with robust standard errors and country-fixed effects to account for country-level heterogeneity:

where yi,c denotes redistribution support for individual i in country c, α is the intercept, β 1 captures the linear effect of perceived distance from the poor, and β 2 captures the linear effect of perceived distance from the rich; γ is a vector of coefficients for covariates X i,c, and ϵi,c represents unobserved determinants of redistribution support.
As noted, I focused on individuals who identified their household as middle-income, based on their subjective income assessment. In line with study 1, I classified respondents as rich if they consider their household to be among the top 30% of the national income distribution (8.9% of the sample) and as poor if they placed their household among the bottom 30% (20.2% of the sample).Footnote 27 Additionally, I removed respondents who either thought that their household earned more than the 10% richest households or less than the 10% poorest households.
To reduce obvious sources of selection bias, I included a set of control variables. Although including these covariates did not account for all potential confounders, it served as a simple test of whether the observed association persists after adjustment for “a standard set of controls.” Most importantly, I added placement in the national income distribution (measured as income decile) as a control variable to better capture the subjective component of perceived economic distance. Because perceived income distance is functionally related to household income, a well-established predictor of redistribution preferences (see Cansunar Reference Cansunar2021), omitting income placement would make it difficult to assess whether an observed association between perceived distances and redistribution attitudes reflects a subjective experience—feeling economically close to the poor even when one is not—or an objective condition of actual income proximity.Footnote 28 Once household income decile is controlled for, however, the independent variables capture within-decile variation in perceptions, allowing the estimate to be interpreted as reflecting individuals’ subjective beliefs about economic proximity to poor and rich households, net of actual income position.Footnote 29 This does not imply that we can rule out alternative interpretations of the estimates, such as their reflecting subjective beliefs about how disadvantaged the poor really are. Accordingly, the cross-national analysis speaks primarily to the broader generalizability of the relational pattern identified in the experiments, rather than providing definitive evidence for the competition mechanism.
I also included age, education (1 = university degree, 0 = no university degree), unemployment status (1 = unemployed, 0 = employed), partnership (3 = cohabiting, 2 = married, 1 = single), size of the household, gender, and political ideology. Age, gender, and education were included because the young, the educated, and women tend to hold more liberal attitudes. The young, unemployed, and uneducated might perceive proximity to poor people because of their relatively low income. I added partnership and household size because I focused on the household level, rather than the individual level. As for political ideology, left-leaning individuals are more supportive of redistribution and are likely to perceive poor people’s income as lower. Descriptive statistics of all variables are shown in appendix C.2.
Results
Table 3 presents the results from the cross-sectional analysis. Model 1 shows a positive but insignificant association between perceived income distance to poor people and support for higher unemployment benefits for poor people (measured as a binary variable, with 1 indicating support). Once covariates are added in model 2 so that comparisons are made among individuals within the same income decile, the association becomes both positive and statistically significant. This shows that support for giving to the poor, measured here as support for higher unemployment benefits, is smallest among those who perceive little distance from the poor but increases as the perceived distance grows. Crucially, this effect remains robust after controlling for perceived distance from the rich.
Cross-sectional Results of Perceived Distance and Attitudes toward Giving to the Poor

Table 3 Long description
The table is organized into three main sections based on dependent variables: Higher unemployment benefits (Models 1 to 3), Higher pension (Models 4 to 6), and Wealth redistribution (Models 7 to 9).
Key independent variables and their coefficients include:
* Perceived distance from the poor: Shows a significant positive correlation in Model 2 (0.025) and Model 5 (0.018), but a significant negative correlation in Model 7 (-0.021).
* Perceived distance to the rich: Shows significant positive correlations in Model 1 (0.012), Model 4 (0.008), and Model 7 (0.019).
* Categorical interactions (using Proximity poor, distance rich as reference):
- Proximity poor, proximity rich: Significant in Model 3 (0.031) and Model 6 (0.027).
- Distance poor, proximity rich: Significant in Model 3 (0.042) and Model 6 (0.039).
- Distance poor, distance rich: Significant in Model 3 (0.044), Model 6 (0.031), and Model 9 (0.021).
Model controls and statistics:
* Covariates: Included in models 2, 3, 5, 6, 8, and 9.
* Country F E: Included in all models.
* Adjusted R super 2: Ranges from 0.014 (Model 4) to 0.129 (Model 9).
Note: Standard errors are provided in parentheses below coefficients. Significance levels are indicated by asterisks: * p < 0.05, ** p < 0.01. Total sample size N = 11,053.
Note: Entries are coefficients from linear probability models (models 1–6) and OLS (models 7–9) with robust standard errors in parentheses. N = 11,053
p < 0.1, * p < 0.05, ** p < 0.01. See table A35 for the full models.
To more clearly mirror the bidirectional structure of the experimental studies, model 3 reports the association between the configuration of perceived distances and attitudes toward redistribution to the poor. Consistent with the status and economic competition mechanism, respondents who perceive economic proximity to the poor alongside distance from the rich express the lowest support for redistribution. For example, those who perceive proximity to the poor and distance from the rich are 4.2 percentage points less supportive than those who see themselves as close to the rich and far from the poor. Although the differences are small, they are comparable to the influence of political ideology (see table A35 in appendix C.3).
A similar pattern appears when I examine the relationship between perceived income distances and support for higher pensions for low earners. Importantly, in model 6, individuals who perceive economic compression from below while remaining clearly separated from the affluent hold the most negative attitudes toward giving to the poor.
In figure 6, I illustrate the differences in support for the poor across different configurations of perceived distances in countries with different welfare regimes. Panels A and B show that support for redistribution is weakest among individuals who see themselves as economically close to the poor and distant from the rich, thus substantiating that the findings from the UK experiments extend to other countries with different welfare regimes.Footnote 30 The only notable exception is countries with a social-democratic welfare regime; this result is likely because welfare benefits in such systems are universal, making perceptions of “us” versus “them” less relevant for support for redistribution.
Visualizing the Association between Perceived Distances and Support for Giving to the Poor across Welfare Regime Types
Note: Marginal means of giving to the poor across different configurations of perceived distances. Panels A and B show predicted probabilities from binary outcomes, where 1 indicates agreement that lower earners should receive more in unemployment benefits (panel A) or pensions (panel B), and 0 indicates that either higher earners should receive more or that both groups should receive the same amount. Panel C reports predicted values for support for wealth redistribution from the rich to the poor, measured on an 11-point scale and rescaled to range from 0 to 1, with higher values indicating stronger support. For ease of visualization, the y-axis ranges from 0 to .40 in panels A and B (.40 to .80 in panel C). Thin vertical lines are 95% confidence intervals, and thick lines are 90% confidence intervals. The underlying regression tables for the panels are reported in appendix C.3.

Figure 6 Long description
A multi-panel dot plot with three vertical sections.
Common Structure:
The x-axis for all panels lists five categories: Pooled estimate, Conservative, Social democratic, Liberal, and South European.
The legend at the top of Panel A defines four perceived income distance configurations represented by dots of varying shades of gray:
1. Black dot: Proximity poor, distance rich.
2. Dark gray dot: Proximity poor, proximity rich.
3. Medium gray dot: Distance poor, proximity rich.
4. Light gray dot: Distance poor, distance rich.
Each dot includes a thick vertical line for 90 percent confidence intervals and a thin vertical line for 95 percent confidence intervals.
Panel A: Support for higher unem. to the poor.
The y-axis measures marginal means from 0 to .4. Across all regimes, support is generally lowest for the proximity poor, distance rich group (black dots) and highest for the distance poor, distance rich group (light gray dots). The South European regime shows the highest overall support levels, peaking near .25.
Panel B: Support for higher pension to the poor.
The y-axis measures marginal means from 0 to .4. Trends are similar to Panel A but with slightly lower overall values. The Social democratic regime shows higher baseline support compared to Liberal or South European regimes in this specific metric.
Panel C: Support for wealth redistribution.
The y-axis is rescaled, ranging from .4 to .8. The data points are clustered higher on the scale, mostly between .55 and .65. In the Social democratic and Liberal regimes, the trend reverses slightly or flattens, where the proximity poor, distance rich group (black dots) shows similar or higher support than the distance poor, distance rich group.
The picture looks different when redistribution is framed explicitly as giving to the poor by taking from the rich, which is rescaled from 0 (less supportive) to 1 (more supportive). Model 7 shows a negative bivariate association between perceived distance from the poor and redistribution attitudes, possibly reflecting the confounding role of income. When covariates are included in model 8, the coefficient turns positive but remains statistically insignificant. Finally, model 9 reports that the only statistically significant difference is between respondents who perceive proximity to the poor and distance from the rich and respondents who perceive distance to both groups. More generally, although perceptions of economic distances strongly predict support for redistribution explicitly framed as giving to the poor, their impact is weaker when redistribution is framed as taking from the rich by giving to the poor, possibly because such attitudes are shaped by a multitude of motives, including concerns about material self-interest (Cansunar Reference Cansunar2021; Fernández-Albertos and Kuo Reference Fernández-Albertos and Kuo2018), envy of the wealthy (Hansen Reference Hansen2023), and empathy sentiments.
This weaker effect is also visible in figure 6. For example, panel C illustrates that only individuals in conservative and southern European welfare regimes who perceive economic proximity to the poor and distance from the rich express the lowest support for redistribution. One possible explanation is that these regimes structure benefits in ways that preserve social hierarchies (Esping-Andersen Reference Esping-Andersen1990), thereby reinforcing “us versus them” distinctions. More broadly, the absence of similar findings in the observational study from study 1, which also included a question on taking from the rich and giving to the poor, could be explained by the fact that its experimental design allows for a clean identification of the effect of perceived distances, whereas this is (nearly) impossible with observational data.
In the appendix, I examine whether perceived distances correlate with views on the fairness of inequality between bottom and middle-income households, thereby probing whether respondents actually care about perceived income differences. As shown in table A40, middle-income respondents who perceive economic proximity to the poor are more likely to judge the gap below them as unfairly narrow. Moreover, in table A40 results do not replicate using an outcome that measures attitudes toward taking from the rich, rather than support for redistribution that targets the poor.Footnote 31
I also conducted additional analyses to explore the conditionalities of the cross-sectional results (see appendix C.4). As shown in appendix C.4.1, the association between the configuration of perceived distances and support for redistribution to the poor is not driven by “objectively” poor respondents, because it persists even among individuals whose actual income places them far from the poor. This finding helps rule out alternative explanations for redistributive attitudes that might be prevalent among low-income groups (e.g., welfare chauvinism; Magni Reference Magni2020).Footnote 32 Finally, I probe these findings in a series of robustness checks. For example, table A42 shows that the results replicate when adding potential post-treatment variables.
Overall, the results show that perceived income proximity to the poor, in combination with upward distance from the rich, is negatively associated with support for redistribution targeted at the poor, even across countries with different welfare regimes. Although the experimental evidence remains key for identifying the underlying mechanism, especially given that study 3 cannot fully rule out alternative interpretations, these cross-sectional results provide suggestive evidence that the observed patterns in the experiments extend across countries with different welfare regimes.
Discussion and Conclusion
How do bidirectional economic comparisons affect support for redistribution to the poor? I argue that perceiving economic proximity to the poor alongside upward distance from the rich can trigger one of two opposing responses: social affinity with the poor that increases support for redistribution or competitive concerns over status and material resources that reduce it. Drawing on two survey experiments from the United Kingdom and cross-sectional data from 14 democracies, I provide rigorous empirical evidence that individuals who self-identify as belonging to a middle-income household become less supportive of redistribution to the poor when they perceive themselves as economically close to the poor and distant from the rich. As an important extension, I present suggestive evidence that perceptions of economic and status competition with the poor constitute a key link between perceived economic distance and redistribution attitudes.
My work adds to ongoing debates about how economic inequality and perceptions of it influence individuals’ support for redistribution. Drawing on previous work on upward and downward comparisons (Brown-Iannuzzi et al. Reference Brown-Iannuzzi, Lundberg, Kay and Payne2015; Cansunar Reference Cansunar2021; Condon and Wichowsky Reference Condon and Wichowsky2020b) and the comparative political economy literature on the structure of inequality (Kevins et al. Reference Kevins, Horn, Jensen and van Kersbergen2018; Lupu and Pontusson Reference Lupu and Pontusson2011), I argue and empirically demonstrate how inducing bidirectional comparisons—prompting individuals to compare their economic situation relative to both richer and poorer groups—may activate competitive thinking about resources and status, with negative consequences for support for redistribution to the poor. Additionally, by combining preregistered survey experiments in the United Kingdom with cross-national observational data from 14 democracies, I provide both causal and comparative evidence that broaden the empirical scope of the redistributive implications of social comparison.
However, this work is not without limitations, which indicate areas for future research. Theoretically, the argument remains somewhat underspecified regarding how individuals incorporate other salient social categories, such as gender and ethnicity, into their perceptions of economic distance and support for redistribution. Ethnic and gender divisions may, for example, shape perceived economic and social distance, particularly in contexts where certain groups are disproportionately represented at the lower end of the income distribution (see, e.g., Condon and Wichowsky Reference Condon and Wichowsky2020b; Lupu and Pontusson Reference Lupu and Pontusson2011). Although study 3 somewhat bypasses this concern by examining the effect of perceived economic distances across different contexts, study 1 reveals gendered heterogeneity in treatment effects, possibly because men and women integrate different social categories into their mental representations of economic groups. Integrating how individuals conceptualize economic groups and how such categorizations may interact with and shape responses to economic comparisons thus represents a promising avenue for future research.
Given the growing evidence on the importance of social comparisons, understanding how individuals engage in such comparisons in everyday life warrants further scholarly attention. Recent work has shown that palpable and localized experiences of inequality have a significant impact on redistribution attitudes, yet we still have relatively little knowledge of how exposure to economic others affects support for redistribution (Christensen, Dinesen, and Sønderskov Reference Christensen, Dinesen and Sønderskov2024; Sands Reference Sands2017; Sands and Kadt Reference Sands and de Kadt2020). Examining whether perceived distances account for this link represents an important direction for future research.
A third avenue for future research is to explain how bidirectional comparisons influence support for redistribution among middle-income earners. More specifically, if middle-income individuals are concerned about a small economic distance downward, we might expect them to favor policies that transfer resources from the rich to the middle to further differentiate themselves from the poor.
On a practical level, this article offers important implications for policy makers seeking to build pro-redistribution coalitions to address the widening economic divide. In times of increasing concentrations of wealth and income among the very rich, the tendency to prefer downward comparison may be amplified (Wills Reference Wills1981) and contribute to a perception among middle-income voters that the economic gap to the poor relative to the rich has become smaller (Payne Reference Payne2017). These dynamics may make it more difficult to generate support among a large and politically influential segment of the electorate for redistribution policies that primarily assist the poor. A more effective approach to combating rising inequality may be to emphasize that redistribution can strengthen social welfare institutions such as education and healthcare to the benefit of society as a whole.
Supplementary material
To view supplementary material for this article, please visit http://doi.org/10.1017/S1537592726105854.
Data replication
Data replication sets are available in Harvard Dataverse at: https://doi.org/10.7910/DVN/HBDIYE.
Acknowledgements
I acknowledge the use of Claude Sonnet 4.6 (Anthropic, accessed February 2026) to assist with data cleaning, proofreading and copyediting, and editorial feedback on the presentation of arguments. I reviewed, revised, and approved all AI-generated suggestions and take full responsibility for the accuracy and integrity of the work.
I thank Laurits Aarslew, Kristian Vrede Skaaning, Kees van Kersbergen, Marius Busemeyer, Mathias Kruse, Andreas Videbæk Jensen, and Kim Mannemar Sønderskov; participants at DPSA 2021 and EPSA 2022; and the Department of Politics and Public Administration at Konstanz University and the Political Behavior and Institutions Section at the Department of Political Science, Aarhus University, for their helpful comments.
Funding
Support for this research was provided by Aarhus University.


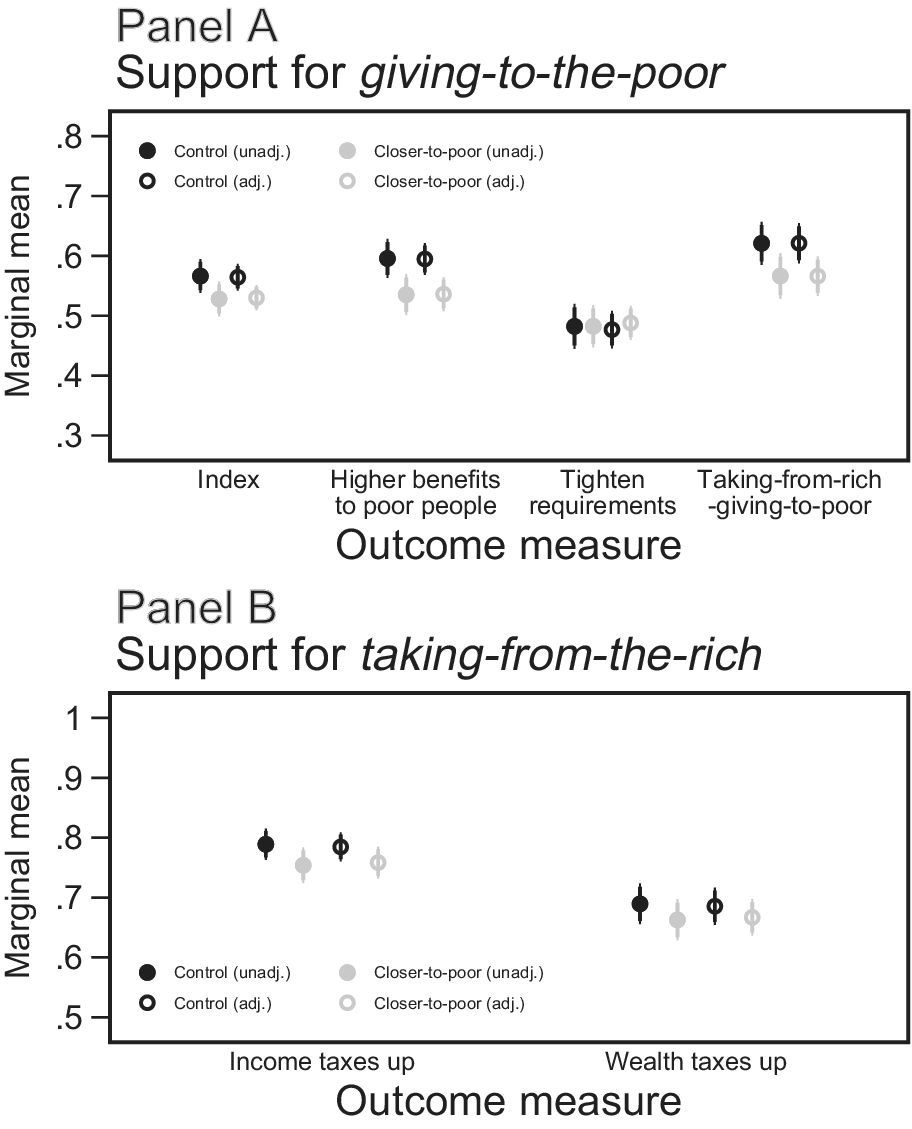
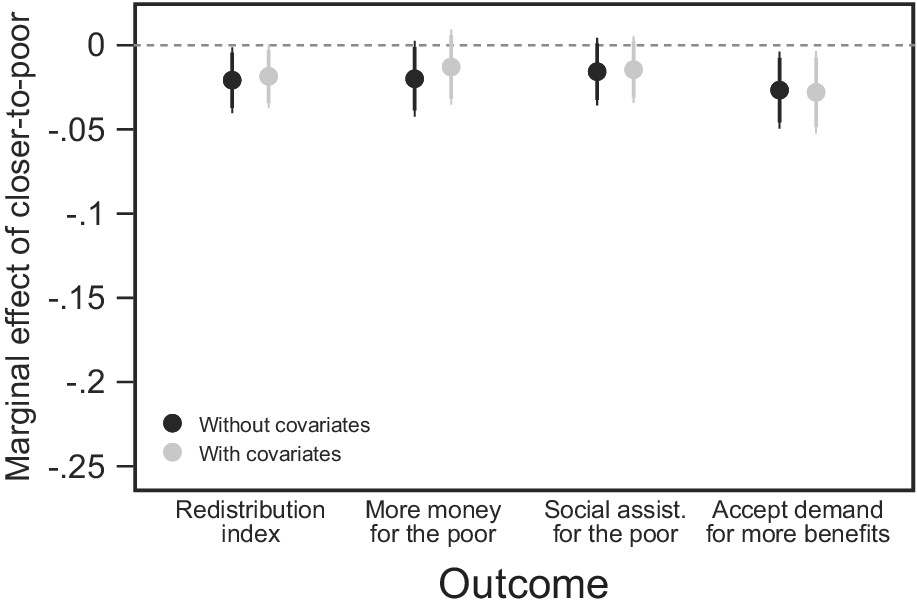
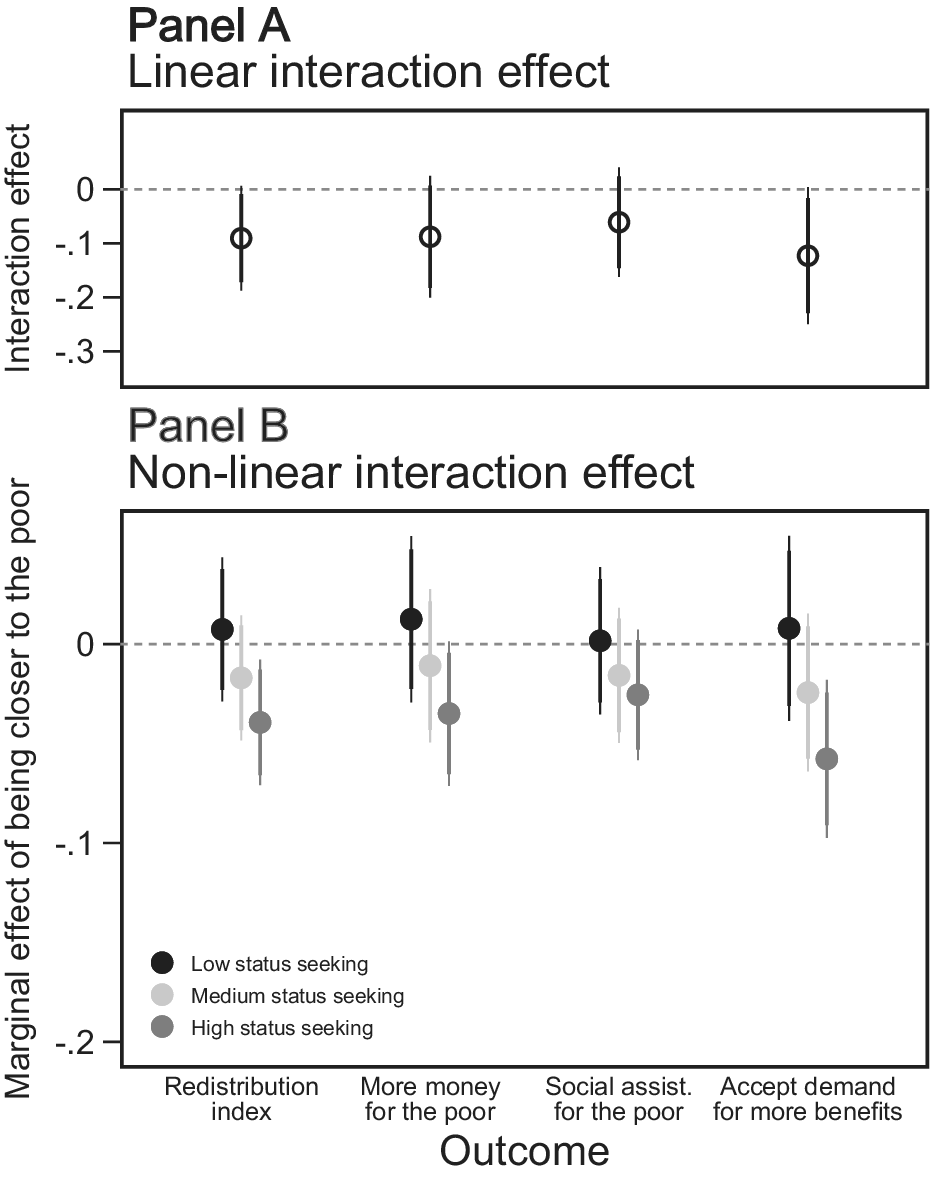
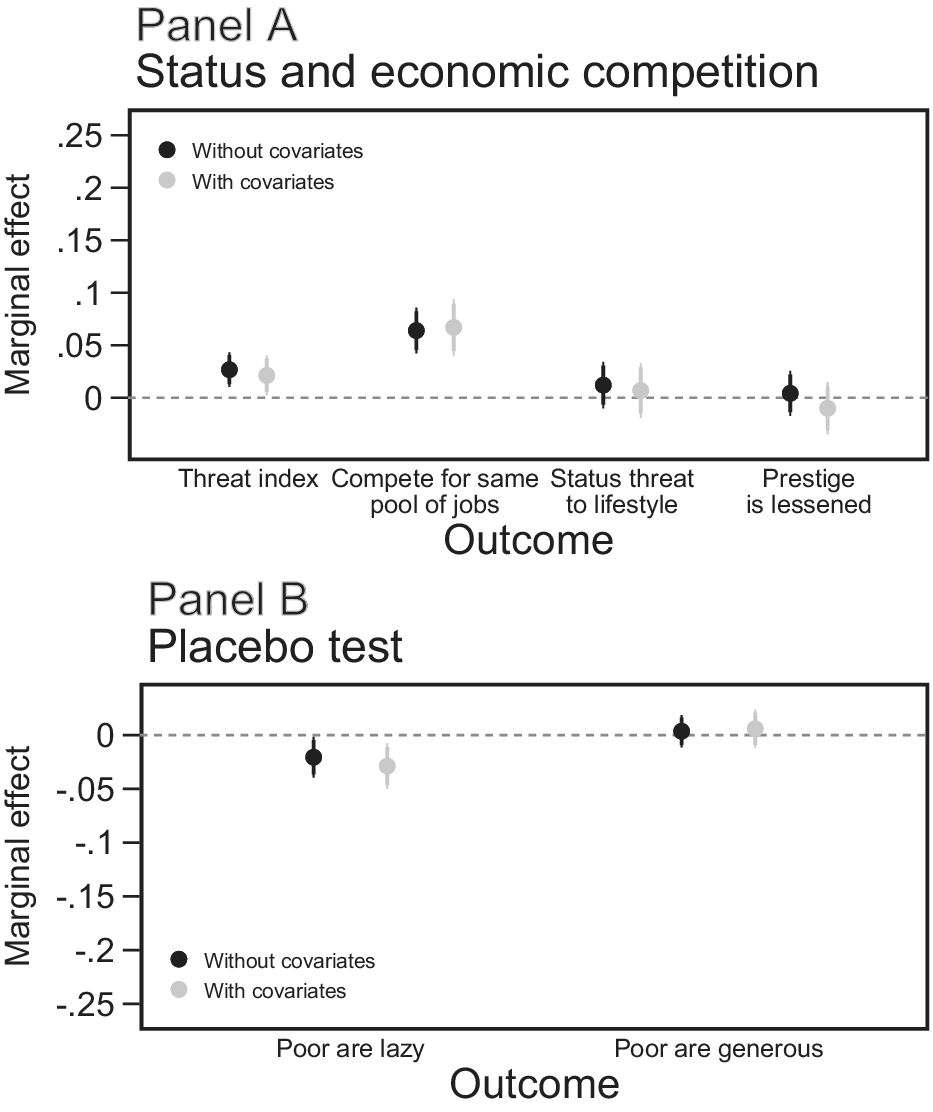
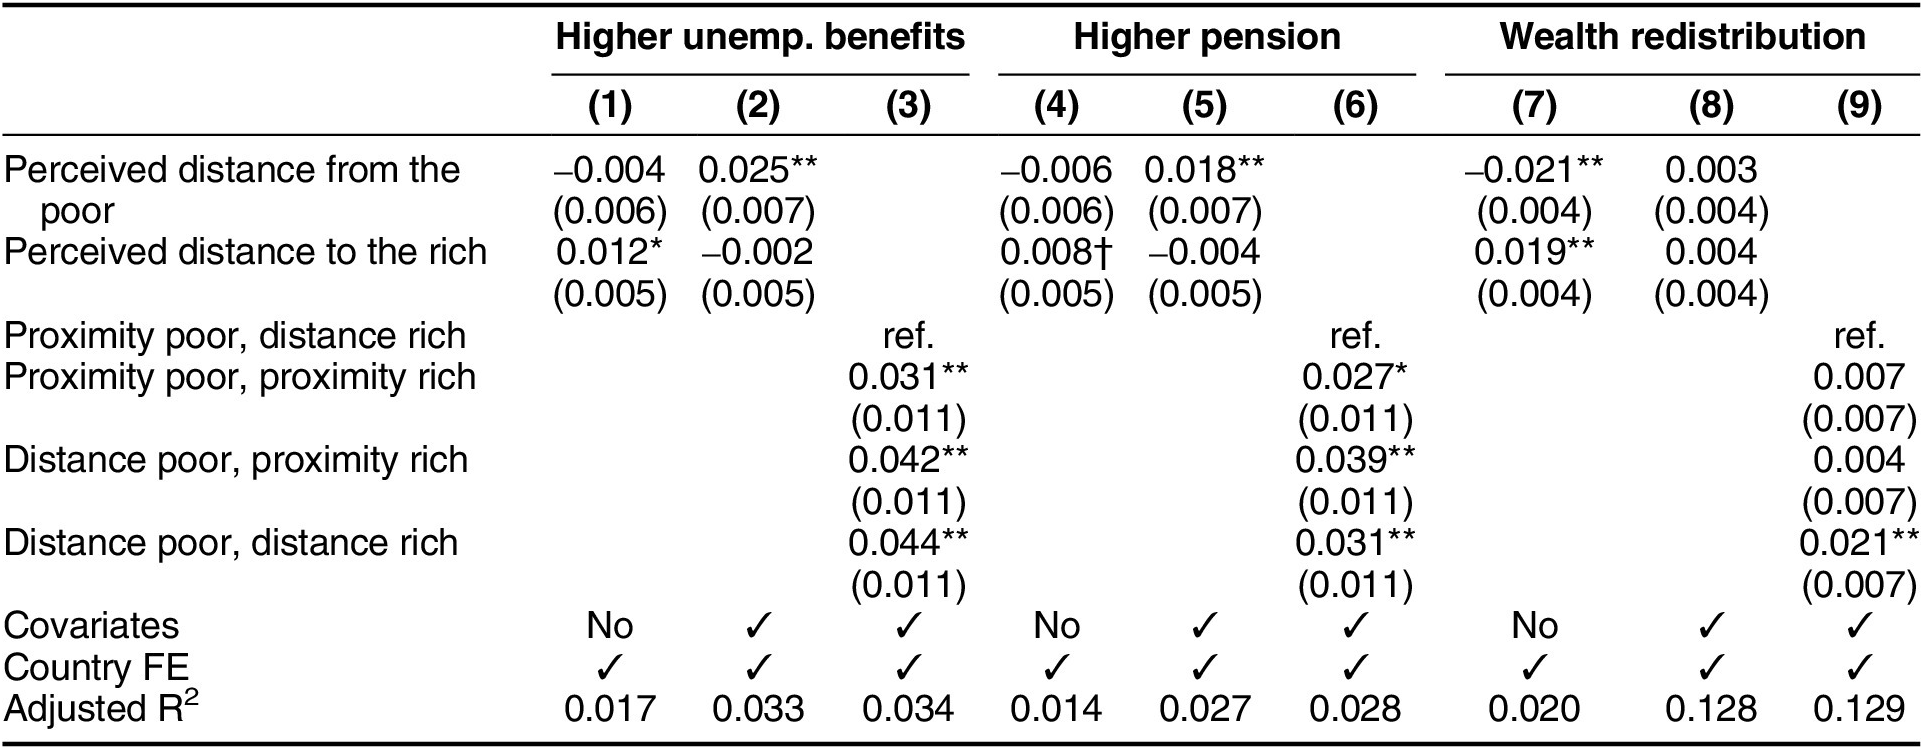
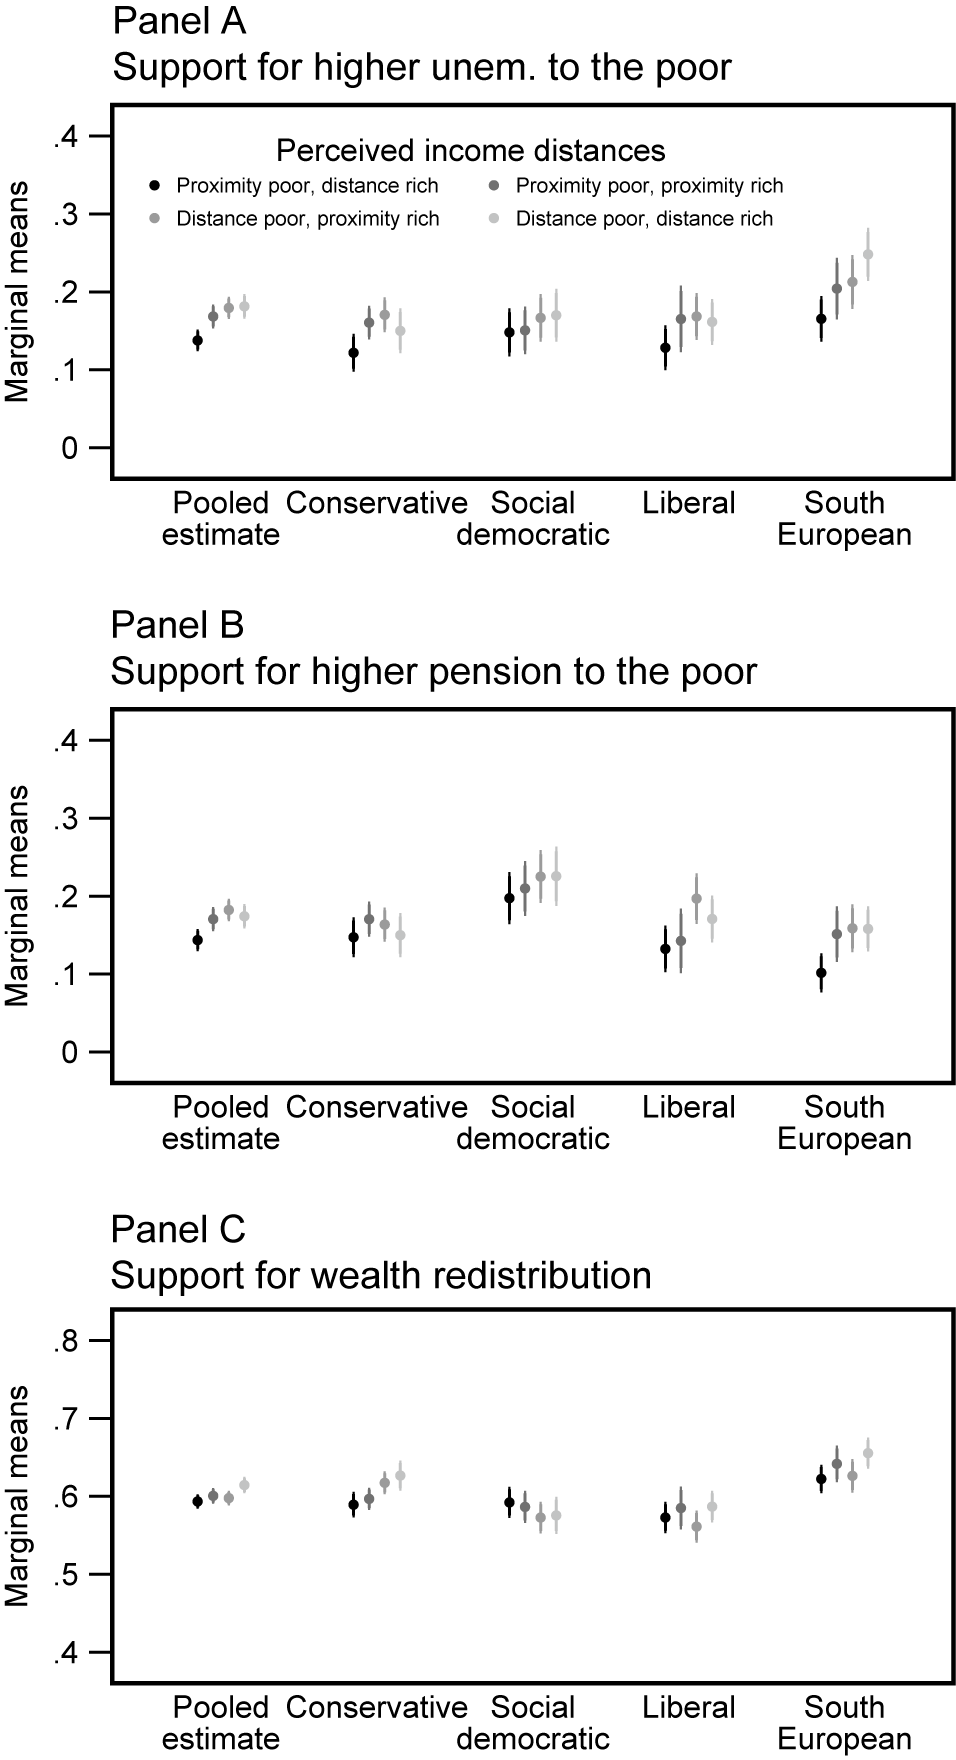


 Open access

