Introduction
Studies on in vitro fertilisation (IVF) currently focus on searching for new factors and mechanisms crucial for embryo quality and development. It is especially important in case of bovine embryos due to the worldwide use of assisted reproductive technologies (ART) in the beef and dairy industries. These technologies enhance the number of offspring from a single female and in addition accelerate genetic progress in animal husbandry. At present, ART account for about 266 000 bovine embryo transfers annually (International Embryo Transfer Society, 2006). The quality of cattle embryos produced in vitro is compromised (with a calving rate of 45–50%) when compared to embryos generated in vivo (Kruip and den Daas, Reference Kruip and den Daas1997). This can be accounted for by differences including oocyte quality after in vitro maturation (IVM), embryonic developmental potential and metabolism, survival after cryopreservation, gene expression profiles and higher lipid concentration in vitro. Knowledge of the specific genes involved and their expression patterns at the early stages of bovine embryogenesis is still limited. It is therefore essential to search for new factors and their effects on preimplantation development in order to achieve the best in vitro culture conditions.
Preimplantation development relies on interactions between a number of cytokines, growth factors and hormones. These include insulin-like growth factor-I and -II (IGF-I and IGF-II), growth factors from the epidermal growth factor (EGF), transforming growth factor (TGF-β), fibroblast growth factor (FGF) and platelet-derived growth factor (PDGF) families, growth hormone (GH), regulatory proteins such as STAT3 (signal transducer and activator of transcription) and their respective receptors (Kane et al., Reference Kane, Morgan and Coonan1997).
Interests in leptin as an embryonic growth factor has been growing over recent years. In the mature organism, leptin plays a well-documented role as a crucial energy balance and body metabolism regulator. A number of studies have also revealed an important function for leptin in reproduction and related processes such as sexual maturation and fertility. Leptin may have diverse regulatory actions with involvement in the preimplantation period of embryonic development as well as implantation (trophoblast invasion) and foetal growth (Fedorcsak and Storeng, Reference Fedorcsak and Storeng2003; Swain et al., Reference Swain, Dunn, McConnell, Gonzalez-Martinez and Smith2004; Craig et al., Reference Craig, Zhu, Dyce, Wen and Li2005; Yoon et al., Reference Yoon, Cha and Lee2005; Yang et al., Reference Yang, Cao, Bo, Peng, Liu and Duan2006). Transcripts for the leptin gene (LEP) and the leptin receptor gene (LEPR) were identified in several tissues or cell types related to reproduction (ovaries, testis, placenta, endometrium, granulosa and cumulus oophorus cells) (Cioffi et al., Reference Cioffi, Van Blerkom, Antczak, Shafer, Wittmer and Snodgrass1997) as well as human and mouse oocytes and preimplantation embryos (Antczak and Van Blerkom, Reference Antczak and Van Blerkom1997; Kawamura et al., Reference Kawamura, Sato, Fukuda, Kodama, Kumagai, Takinawa, Nakamura and Tanaka2002; Kawamura et al., Reference Kawamura, Sato, Fukuda, Kodama, Kumagai, Takinawa, Murata and Tanaka2003). LEP mRNA was detected in mouse blastocysts and the mRNA for two long leptin receptor isoforms (Ob-Ra and OB-Rb) was identified in mouse oocytes, zygotes, two-cell embryos, morulae and blastocysts (Kawamura et al., Reference Kawamura, Sato, Fukuda, Kodama, Kumagai, Takinawa, Nakamura and Tanaka2002). The LEPR gene transcript has not been observed in four- and eight-cell mouse embryos (Kawamura et al., Reference Kawamura, Sato, Fukuda, Kodama, Kumagai, Takinawa, Nakamura and Tanaka2002). Human embryos express LEPR at all preimplantation stages (Cervero et al., Reference Cervero, Horcajadas, Martin, Pellicer and Simon2004) whereas it is expressed in pig embryos from the four-cell stage onwards (Craig et al., Reference Craig, Zhu, Dyce, Wen and Li2005). To our knowledge, there is no published evidence of LEP and LEPR expression in bovine oocytes and embryos.
The influence of leptin on the development of the nascent embryo may start even prior to fertilisation and cleavage. Craig et al. (Reference Craig, Zhu, Dyce, Petrik and Li2004) showed that supplementation of pig oocyte maturation medium with 10 ng/ml of leptin significantly increases the proportion of oocytes reaching metaphase II (MII) and subsequently enhanced embryo developmental potential. On the other hand, an elevated concentration of leptin in the serum (59.48 ng/ml) appeared to reduce ovarian stimulation, response and follicle maturation in humans with associated poor embryo quality and pregnancy failure (Anifandis et al., Reference Anifandis, Koutselini, Stefanidis, Liakopoulos, Leivanditis, Mantzavinos and Vamvakopoulos2005), indicating that there is a need to maintain a certain physiological level of leptin. Moreover, biochemical analyses reveal a higher level of leptin in the culture medium of competent human blastocysts as compared to that of low-quality embryos (Gonzalez et al., Reference Gonzalez, Simon, Caballero-Campo, Norman, Chardonnens, Devoto and Bischof2000). The actions of leptin may involve both the paracrine and autocrine pathways. The protein has been identified in mouse oviduct fluid (Kawamura et al., Reference Kawamura, Sato, Fukuda, Kodama, Kumagai, Takinawa, Murata and Tanaka2003), pig oviduct epithelium (Craig et al., Reference Craig, Zhu, Dyce, Wen and Li2005) and human endometrium (Gonzalez et al., Reference Gonzalez, Simon, Caballero-Campo, Norman, Chardonnens, Devoto and Bischof2000) as well as human and mouse oocytes and preimplantation embryos (Antczak and Van Blerkom, Reference Antczak and Van Blerkom1997). The spatial distribution of leptin protein in mouse and human oocytes and preimplantation embryos is polarised within the oocyte and after fertilisation (Antczak and Van Blerkom, Reference Antczak and Van Blerkom1997). The authors showed that leptin was differentially distributed among the inner and the outer blastomeres of morula-stage embryos, in a pattern that persisted to the blastocyst stage. This discovery raised another question related to mammalian preimplantation development – the polarised distribution of regulatory proteins. The question remains open as to whether spatially differing protein distribution and gene expression results in embryo prepatterning, leading to the establishment of embryonic axes prior to the blastocyst stage. Protein distribution within oocytes and embryos as observed in human and mouse embryos has so far not been described in other mammalian species; however, it is a common feature of amphibian, reptile and bird oocytes (for review see Gurdon, Reference Gurdon1992).
With this in mind, the aim of the present study was to investigate the expression pattern of LEP and LEPR genes and to describe their protein distribution within bovine oocytes and preattachment embryos.
Material and methods
Unless otherwise indicated, all reagents were purchased from Sigma (St Louis, MO, USA).
In vitro production of bovine embryos
Bovine embryos were obtained according to the protocol described by Makarevich and Markkula (Reference Makarevich and Markkula2002) with minor modifications. Oocytes aspirated from bovine slaughterhouse ovaries were selected for IVM. IVM was carried out for 24 h at 39°C in a humidified atmosphere of 5% CO2. After maturation, oocytes were washed with IVF medium, placed in 475 μl of IVF medium and inseminated with bull sperm at a concentration of 1.5 × 10⁶ cells/ml. After 20 h of gamete co-incubation, cumulus cells were removed by pipetting and presumptive zygotes were transferred to SOFaaci embryo culture medium supplemented with essential and non-essential amino acids (Holm et al., Reference Holm, Booth, Schmidt, Greve and Callesen1999). Embryo culture was carried out at 39°C in a humidified atmosphere of 5% CO2, 5% O2 and 90% N2. On day 5 post insemination (pi) half the volume of culture medium was replaced with fresh SOFaaci. The cleavage rate was evaluated on day 2 pi (calculated as the number of cleaved embryos relative to the number of inseminated oocytes) and the percentage of embryos reaching the blastocyst stage was calculated on day 7 pi (calculated as the number of blastocysts relative to the number of inseminated oocytes).
Oocyte and embryo collection for gene expression analysis
The analysed material included immature and mature oocytes, zygotes, embryos at two-, four-, eight- –to 16-cell stages, morulae, expanding blastocysts (day 7) and hatched blastocysts (day 9). To increase the initial template concentration, pools of oocytes and embryos were prepared: oocytes (n = 60–100), zygotes (n = 20–50), two-cell embryos (n = 20–40), four-cell embryos (n = 20–50), eight- to 16-cell embryos (n = 20–60), morulae (n = 20–40), expanding blastocysts (n = 5–6) and hatched blastocysts (n = 5–6). The selected material was washed two times in phosphate buffered saline (PBS) + 0.25% polyvinylpirrolidone (PVP), placed in 1.5 ml tubes in a minimal volume of liquid, frozen in liquid nitrogen and stored at −70°C.
RNA extraction and cDNA synthesis
RNA was extracted with the Gen Elute™ Mammalian Total RNA Miniprep Kit according to the manufacturer’s protocol. The RNA for positive controls was extracted from reference tissues (bovine subcutaneous fat for the LEP gene and bovine pituitary for the LEPR gene) using a method described by Chomczynski and Sacchi (Reference Chomczynski and Sacchi1987) using Trizol (Invitrogen Co., Scotland, UK). Synthesis of complementary DNA was carried out according to the protocol described by Joudrey et al. (Reference Joudrey, Lechniak, Petrik and King2003). The cDNA samples were stored at −20°C. RNA extraction and cDNA synthesis efficiency were evaluated by PCR reaction with a set of primers designed to amplify bovine β-actin gene (McDougall et al., Reference McDougall, Beecroft, Wasnidge, King and Hahnel1998), which is used in our laboratory as a standard gene control of the reverse transcription efficiency from various bovine tissue samples.
Qualitative LEP and LEPR gene expression analysis
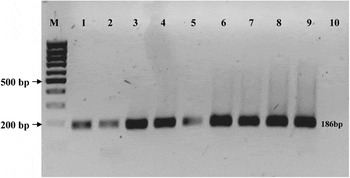
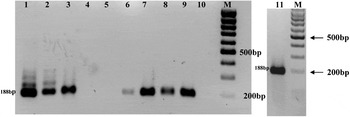
Each developmental stage was analysed for five independent samples (pools) and each sample was analysed in triplicate. The primers were designed to cover two neighbouring exons. Bovine LEP gene oligonucleotides were as follows: 5′-CACCAAAACCCTCATCAAGACAAT-3′ and 5′-GGAAGGCAGACTGTTGAGGA-3′, respectively (186 bp product, GenBank accession no. U50365; Figure 1). The LEPR gene amplification required a nested PCR reaction (nPCR). The primers included an external pair (5′-GTCTTGCATGCCATCAAAT-3′ and 5′-AAGTCCTCTTTCATCCAGCA-3′, 306 bp product) and an internal pair (5′-TCCTCCTGGAATCTCAAAGAACAC-3′ and 5′-ATGCCTTCCCTTCAATGTCATCT-3′, 188 bp product; GenBank accession no. BTU83512; Figure 2).
Detection of leptin mRNA in bovine oocytes and embryos: 1. immature oocytes; 2. In vitro-matured oocytes; 3. two-cell embryos; 4. four-cell embryos; 5. eight- to 16-cell embryos; 6. morulae; 7. expanding blastocysts; 8. hatched blastocysts; 9. positive control (fat); 10. negative control; M. molecular weight marker (GeneRuler 100 bp DNA Ladder, Fermentas).

Detection of leptin receptor mRNA in bovine oocytes and embryos: 1. immature oocytes; 2. in vitro-matured oocytes; 3. zygotes; 4. two-cell embryos; 5. four-cell embryos; 6. eight- to 16-cell embryos; 7. morulae; 8. expanding blastocysts; 9. hatched blastocysts; 10. negative control; 11. positive control (pituitary); M. molecular weight marker (GeneRuler 100 bp DNA Ladder, Fermentas).

The amount of cDNA taken to each PCR reaction was calculated as an equivalent of the same number of oocyte/embryo genomes. The PCR mix (20 μl) contained cDNA, Taq polymerase (0.5 IU; Qiagen, Hilden, Germany), dNTPs (2 mM; Eppendorf, Hamburg, Germany), primers (0.3 μM each) and reaction buffer (1.5 μM of MgCl2). The basic PCR conditions for the amplified products were the same and involved initial denaturation at 94°C for 5 min followed by 40 cycles of denaturation at 94°C for 30 s, a 30 s annealing (55.3°C for the LEP gene and 58.5°C for the external primers and 60°C for the internal LEPR gene primers), elongation at 72°C for 60 s and final extension at 72°C for 10 min. The products were visualised with ethidium bromide on 1.5% agarose gel. The specificity of the obtained product was verified by its digestion with restriction enzymes [Lep gene – HphI (NewEngland Biolabs, Ipswich, MA, USA) and LEPR gene – AluI (NewEngland Biolabs, Ipswich, MA, USA)].
Quantitative LEP and LEPR gene expression analysis – real-time PCR
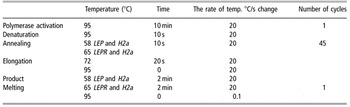
The analysis was performed on a Roche Light Cycler 2.0 system and the calculations were based on the ‘Second Derivative Maximum’ method (Roche Diagnostics, Mannheim, Germany). The H2a histone subunit was used as a reference gene (Robert et al., Reference Robert, McGraw, Massicotte, Pravetoni, Gandolfi and Sirard2002; Mamo et al., Reference Mamo, Baji Gal, Bodo and Dinnyes2007). During every PCR run each sample was amplified in two separated capillaries: one containing either LEP or LEPR primers and the other containing the H2a primers. This allowed calculation of the relative gene expression level. Each developmental stage was analysed for four to eight independent samples and each amplification was repeated three times. The reactions were carried out in 10 μl capillaries (Roche Diagnostics) and the PCR mix comprised 1 μl of Light Cycler Fast Start DNA master SYBR Green I® (Roche Diagnostics), 5 mM MgCl2 (Roche Diagnostics), 0.3 μM of primers and 2 μl of cDNA. For the LEP gene the same set of primers was used as for the qualitative PCR analysis and for the LEPR gene only the inner pair of the nPCR primer set was used (reaction conditions – Table 1).
Real-time PCR reaction conditions

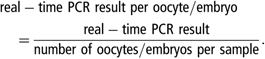
To allow quantitative analysis, calibration curves were created as 10-fold dilutions for both the reference gene and the studied genes. Product specificity was confirmed by melting analysis, a supplementary step at the end of each real-time PCR run. The melting temperature was determined by the product length (bp) and ranged between 82 and 99°C for LEP, 78 to 84°C for LEPR and 86 to 92°C for the H2a gene. The same volume of cDNA was added to each reaction mix. Because samples differed in the initial number of oocyte/embryo genomes, each result was recalculated for single oocyte/embryo according to the formula:
To eliminate variability between the collected samples (i.e. differences in RT-PCR efficiency), each LEP or LEPR expression result was related to the result of the same sample amplified with the reference gene primers. The obtained value allowed the estimation of relative gene expression levels corresponding to the relative mRNA content in each sample. This was calculated according to the following formula:

Oocyte and embryo immunofluorescent staining
The protocol of oocyte and embryo immunostaining was adopted (with some modifications) from Antczak and Van Blerkom (Reference Antczak and Van Blerkom1997). Zona pellucida (ZP) was removed by a brief incubation (5 s) in 60% acetic acid. Fixation and permeabilisation were carried out in PBS (pH 7.3) containing 2.5% paraformadehyde and 0.2% Triton X-100 for 15 min at 37°C followed by three times wash (5 min) in PBS at room temperature (20–23.5°C). The staining protocol involved a 30 min preincubation at room temperature in PBT (PBS + 3% bovine serum albumin (BSA) + 0.1% Tween 20). Oocytes and embryos were incubated with affinity-purified polyclonal rabbit primary antibody directed against either leptin [Ob (Y20); Santa Cruz Biotechnology Inc., Santa Cruz, USA] or the leptin receptor [Ob-R (H-300), Santa Cruz Biotechnology Inc.]. The primary antibodies (0.1 mg/ml) were diluted in PBT at a 1 : 1000 ratio. The incubation was carried out overnight at +4°C. After 10 washes in PBS + 0.1% Tween 20, oocytes/embryos were treated with the secondary antibody [goat anti-rabbit fluorescein isothiocyanate (FITC) conjugate (1.0 mg/ml, Santa Cruz Biotechnology Inc.)] in 1 : 200 dilution ratio in PBS + 0.1% Tween 20. The incubation was carried out in the dark for 60 min at room temperature (20–23.5°C), followed by 10 washes in PBS + 0.1% Tween 20. The detection specificity of antibody was verified by incubation with the secondary antibody only. Chromatin was visualised by DAPI staining (Vectashield mounting medium with DAPI; Vector Laboratories, Peterborough, England). Oocytes/embryos were mounted on well slides (1.5 mm/0.18 mm) in 40 μl of Anti Fade [20 mM Tris–HCl, pH 8.0, 90% glycerol, 2.3% 1,4-diazabicylo[2.2.2]octane (DABCO) antifade (Fluka)] with 15 μl of DAPI. Blastocyst DNA was marked with propidium iodide (PI, 0.5 μg/ml) as it allowed one to obtain better resolution of confocal images. Slides were stored at +4°C. The confocal analysis was carried out on a Zeiss Axiovert 200 M microscope, and the FITC fluorochrom was excited by 488 nM argon laser. Confocal images taken at intervals of 2.6 or 3.6 μm enabled the insight to the oocyte/embryo, as well as facilitated the three-dimensional reconstructions. The observed pattern of distribution was therefore independent of the oocyte/embryo orientation during examination. DAPI/PI staining was used to visualise chromatin – oocyte meiotic status, embryonic cell nuclei.
Statistical analysis
Some of the developmental stages displayed a very large range of variability in the gene expression levels; thus, there was every reason to expect heterogenous random error. Consequently (in order to stabilise the errors), a log transformation was carried out prior to data analysis. To analyse the differences between the stages, ANOVA analysis was followed by Games–Howell and Tukey HSD analysis when equal variance was not assumed (post-hoc test). Differences of P < 0.05 were considered significant. Data on mRNA expression were analysed using the Statistical Package for the Social Sciences (SPSS, 2006) for Windows software.
Results
To evaluate LEP and LEPR gene expression and protein distribution during bovine preimplantation development, 7341 oocytes and embryos were analysed in total. The panel included 1509 immature oocytes, 1595 mature oocytes, 131 zygotes and 4106 embryos at different developmental stages from two-cell embryos to hatched blastocysts. The average cleavage rate on day 2 pi was 81% and the percentage of oocytes reaching the blastocyst stage on day 7 pi was 34%.
Gene expression of leptin and its receptor in bovine oocytes and preimplantation embryos
Qualitative analysis
All of the analysed cDNA samples were positive for the β-actin gene. LEP mRNA was detected at all of the analysed developmental stages (Figure 1). The mRNA for the LEPR gene was found in oocytes (before and after IVM) and not detected in two- and four-cell embryos. For that reason zygotes were added to the panel of studied developmental stages and proved to be positive for the presence of the LEPR mRNA. Both genes were weakly expressed at eight- to16-cell stage as indicated by a weak band on the agarose gel (Figures 1 and 2). At later stages (morula, blastocyst and hatched blastocyst), LEPR transcript appeared to be more abundant (stronger bands, comparable to oocyte and zygote expression).
Quantitative analysis (real-time PCR)
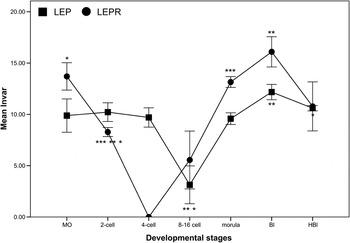
Real-time PCR was used to validate the results of qualitative gene expression analysis. It also enabled data to be gathered on the possible variation in LEP and LEPR mRNA content at the early stages of bovine development. The immature oocytes were excluded from analysis, since the objective was to analyse the quantitative changes during development under in vitro conditions. The repeated analysis of each sample demonstrated the reproducibility of the method. The transcription level for each gene was calculated relative to the H2a gene expression level. The presence of LEP mRNA was confirmed in all of the analysed stages, and the results were in full agreement with the qualitative data. LEPR gene expression analysis showed the presence of transcripts in in vitro maturated oocytes, two-cell embryos, morulae and in expanding and hatching blastocysts. The real-time analysis confirmed the absence of transcripts at the four-cell stage. The relative mRNA content of the LEP and LEPR gene showed some level of variation within pools representing the same developmental stage. This was particularly evident at the eight- to 16-cell stage where in the case of both genes 62.5% (5/8) of the samples displayed no expression at all. Statistical analysis revealed that the LEP gene transcript showed significantly lower expression at that stage as compared to blastocysts (P = 0.015) and hatched blastocysts (P = 0.045). The expression level at the eight- to 16-cell stage also was significantly lower when compared with the two-cell embryos (P = 0.069) (Figure 3). Similarly for the LEPR gene the transcript level in two-cell embryos was significantly lower than in matured oocytes (P = 0.055), morulae (P = 0.001) and blastocyst (P = 0.01) (Figure 3). These observed changes in transcript abundance support the data provided by the qualitative analysis and could explain the weaker band visible at the eight- to 16-cell stage.
Quantitative gene expression profile of leptin and its receptor during bovine embryonic development as analysed by quantitative PCR. MO – matured oocytes; Bl – blastocysts; HBl – hatched blastocysts. Error bars show mean±1.0 s.e.; dot/lines show means; *P < 0.05; **P < 0.01; ***P < 0.001.

Leptin and leptin receptor protein distribution within bovine oocytes and preimplantation embryos
All together the analysed material consisted of 319 immature oocytes, 279 in vitro-matured oocytes and 230 embryos of which 52 were two-cell, 38 were three-cell, 47 were four-cell, 44 were eight- to 16-cell, 18 were morula and 31 were hatched blastocyst.
Confocal analysis of oocytes and embryos allowed the precise detection and spatial localisation of leptin and its receptor during bovine embryogenesis. Confocal images taken at intervals of 2.6 or 3.6 μm enabled insight into the oocyte/embryo besides facilitating three-dimensional reconstructions. The observed pattern of distribution was therefore independent of the specimen’s orientation during examination.
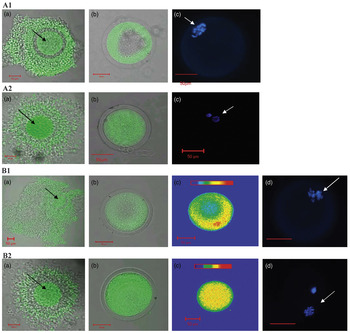
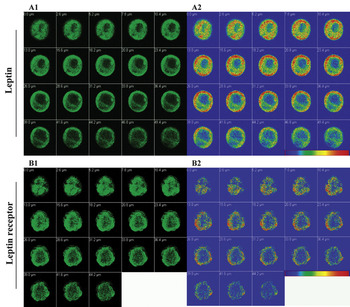
In immature oocytes leptin was concentrated in the form of a rim beneath the oolemma (not present in the centre of the ooplasm) (Figure 4 LEP: A1b). After evaluation of the relative intensity of fluorescence (pseudo-colour images) a similar tendency was also observed for the leptin receptor (Figure 4 B1b and B1c). After oocyte maturation (MII) both of the studied proteins became evenly distributed in the cytoplasm. This observation questions the nature of such rearrangements and possible site of protein entry. A group of immature and mature cumulus–oocyte complexes (COC) was stained with anti-leptin and anti-leptin receptor antibodies. The images showed an even distribution of both LEP and LEPR within all layers of the cumulus cells (Figure 4 LEP: A1a and LEPR: B1a). After IVM both proteins seemed to be localised only in the vicinity of the oocyte – in the corona radiata cells (Figure 4 LEP: A2a and LEPR: B2a). The maturation status of COCs was estimated on the basis of the level of cumulus cell dispersion – immature oocytes having the most compacted cells. Blastomere-specific differences in the distribution of leptin (Figure 5A1–A6 and Figure 6A1, A2) and the leptin receptor (Figure 5B1–B6 and Figure 6B1, B2) were evident from the two-cell-stage embryos onwards. The proteins were localised in the apical region of the outer blastomeres and the characteristic pattern observed at the two-cell stage remained persistent in subsequent stages. The relative fluorescence intensity was evaluated by the pseudo-colour images (Figure 5A4, B2 and B4), showing a clear protein segregation into the outer population of embryonic cells. This became visible from the four-cell-stage onwards, where the fluorescent signal was not detected in the central part of the embryos (Figure 5A3–A6 and B3–B6). Both proteins were restricted to the outer cell boundaries and so were not present in regions of blastomere adhesion. At more advanced stages this phenomenon became even more evident. Confocal sections of embryos at stages between 10-cell and morula clearly showed the polarised distribution of leptin and its receptor (examples of confocal scans presented in Figure 6). Three distinct levels of asymmetry were observed. Firstly, the embryo as a whole could be described as being polarised with respect to leptin and its receptor. Secondly, the distribution of leptin and leptin receptor was observed to be polarised within individual blastomeres, where the majority of the fluorescent signal was detected in the subplasmalemmal cytoplasm facing the perivitelline space. Thirdly, the evaluation of the fluorescence level expressed by a single blastomere revealed that they exhibit different protein contents, with the inner group of the cells showing virtually no positive staining. At the morula stage, the central part of the embryo was virtually free of the analysed proteins – no fluorescent signal detected (Figure 6). This tendency clearly proceeded to the blastocyst stage, leading to leptin and leptin receptor being distributed solely in individual trophoblast cells, but not in the inner cell mass (ICM) (Figure 5).
Protein distribution in bovine oocytes. Leptin: A1 before maturation: (a) cumulus-oocytes complex (COC), (b) denuded oocyte, (c) GVBD stage, DAPI staining; A2 after maturation: (a) COC, (b) denuded oocyte, (c) MII stage; Leptin receptor: B1 before maturation: (a) COC, (b) oocyte (c) pseudocolor image – polarised distribution, (d) GVBD stage, DAPI staining; B2 after maturation: (a) COC, (b) denuded oocyte, (c) pseudocolor image – even distribution, (d) MII stage, DAPI staining. White arrows point to chromatin and black arrows to oocytes within cumulus (granulose cells) masses. The relative intensity of fluorescence (pseudo-colour images) is indicated by colour bars (B1c and B2c) where blue and red represent the lowest and the highest levels of detectable fluorescence, respectively.

Protein distribution in bovine embryos: A. leptin. Two-cell embryo (A1 and A2), 10-cell embryo (A3 and A4) and blastocyst (A5 and A6); the ICM is indicated by arrows. B. Leptin receptor. Three-cell embryo (B1 and B2), morula (B3 and B4) and blastocyst (B5 and B6). Compilations of confocal and DIC images (A2, A5 and B1, B6); pseudo-colour images (A4, B2 and B4). The relative intensity of fluorescence is indicated by the colour bar, where blue and red represent the lowest and the highest levels of detectable fluorescence, respectively. Each image corresponds to one optical section.

Leptin and leptin receptor distribution in bovine embryos. Gallery of confocal sections of leptin-stained late morula/early blastocyst stage embryo (A1) and pseudo-colour representation of the same gallery (A2). Late morula embryo stained with anti-leptin receptor antibody (B1) and the same images in pseudo-colour representation (B2). The relative intensity of fluorescence is indicated by the colour bar, where blue and red represent the lowest and the highest levels of detectable fluorescence, respectively. Each image corresponds to one optical section.

Discussion
Knowledge of specific genes and their expression patterns at the early stages of bovine embryogenesis is still limited. A complex summary by Wrenzycki et al. (Reference Wrenzycki, Herrmann, Lucas-Hahn, Korsawe, Lemme and Niemann2005) points out that whilst transcripts of approximately 100 genes have been identified in the bovine embryo, studies of early mouse development have revealed 15 700 genes (Stanton et al., Reference Stanton, Macgregor and Green2003). There is even less information available on the expression of genes influencing embryonic growth and regulatory factors in cattle. Many investigations have highlighted the important role of leptin during preimplantation development in mouse and human and its implications as an essential growth factor in in vitro embryo culture systems. So far no published evidence exists on the LEP and the LEPR gene expression in bovine oocytes and early embryos; therefore this study aimed to follow through the temporal and spatial changes of their products on the level of mRNA and protein.
The results of our study showed for the first time the presence of LEP and LEPR gene transcripts during bovine preimplantation development including the oocytes before and after IVM. A recent paper shows leptin mRNA in bovine oocytes during all stages of nuclear maturation (van Tol et al., Reference van Tol, van Eerdenburg, Colenbrander and Roelen2008). At the time of embryonic development LEP mRNA was reported only in mouse (Kawamura et al., Reference Kawamura, Sato, Fukuda, Kodama, Kumagai, Takinawa, Murata and Tanaka2003) and human (Cervero et al., Reference Cervero, Horcajadas, Martin, Pellicer and Simon2004) blastocysts. We have showed its presence during the whole period of bovine embryogenesis (two-, four-, eight- to 16-cell embryos, morulae, blastocysts and hatched blastocysts). LEPR mRNA (possibly of maternal origin) was found in zygotes and two-cell embryos as revealed by real-time analysis. At the four-cell stage the transcript was not detected, suggesting either degradation or silencing of maternally derived mRNAs. The LEPR mRNA was transcribed again beginning from the eight- to 16-cell stage. The quantitative analysis shows a characteristic trend in the expression patterns of both genes, where the transcript slowly declines towards the time point of full embryonic genome activation (EGA), which in cattle takes place at the eight- to 16-cell stage. Following that we can observe a drastic increase in the mRNA content as the embryo develops towards the blastocyst stage. Moreover, the expression pattern observed for leptin shows characteristics of transcripts continuously required during embryogenesis. In case of such transcripts maternal mRNAs are slowly substituted by the mRNAs of the embryonic origin. A trough in expression is visible only around the EGA followed by an increase in transcription. In case of bovine embryos it is very difficult to accurately estimate the number of blastomeres above eight cells (which could also explain the variability visible at the eight- to 16-cell stage). The collected samples could therefore differ in the number of cells; thus the ones containing more than eight-cell embryos showed little or no expression (maternal mRNA degradation/silencing) and the ones closer to 16 cells exhibited high expression level due to the EGA. This replacement of embryonic transcript by maternal is even more evident in the LEPR gene expression profile, which showed a decline in the mRNA level beginning from matured oocytes through two-cell embryos, to a complete lack of transcription at the four-cell stage. The results are in agreement with other studies, indicating that many embryonic genes have a tendency to gradually decrease their mRNA levels towards the EGA. There are also suggestions that the noted decrease in transcripts abundancy in stages proceeding the EGA may be in part related to the decrease in activity or partial impairment of transcriptional mechanism. Transcription factors regulate embryonic gene expression and in stages prior to the EGA their mRNAs also undergo the same qualitative and quantitative changes as observed for the other embryonic transcripts. Analysis of the expression profiles of 15 transcription factors in bovine embryogenesis showed that majority of in vitro-derived embryos exhibited a sudden drop in mRNA level around the four-cell stage, reaching minimal value at the eight- to 16-cell stage (Vigneault et al., Reference Vigneault, McGraw, Massicotte and Sirard2004). Studies on the LEPR gene expression in mice, pig and human clearly show stage- and species-specific differences. However, when related to the time of embryonic genome activation, it becomes evident that the transcripts are not present at stages directly preceding the EGA. For example, pig EGA takes place at the four-cell stage and studies by Craig et al. (Reference Craig, Zhu, Dyce, Wen and Li2005) detected the LEPR gene transcript from the four-cell pig embryos onwards. In the mouse, major EGA occurs at the two-cell stage and according to Kawamura et al. (Reference Kawamura, Sato, Fukuda, Kodama, Kumagai, Takinawa, Nakamura and Tanaka2002) LEPR gene mRNA was observed in two blastomere embryos, morulae and blastocysts. In human development LEPR gene transcript was identified in oocytes and at all preimplantation stages (Cervero et al., Reference Cervero, Horcajadas, Martin, Pellicer and Simon2004); however, this study only reported a qualitative aspect of gene expression and thus the information on the possible drop in the mRNA level at the time of EGA was not available.
Our studies of LEP and LEPR protein localisation in the bovine embryo show that despite the quantitative changes in their transcript levels, the proteins are present at all developmental stages. It was particularly interesting to observe the uneven distribution of leptin and its receptor within the cytoplasm of bovine oocytes. Both proteins formed a rim beneath the oolemma of immature oocytes and became evenly distributed in the cytoplasm as the oocytes matured. Some explanation of this process may come from the COC staining, which showed that before maturation leptin and leptin receptor were present in all layers of follicular cells and after maturation became localised only in the corona radiata cells. Endocytosis could be the process responsible for protein transport to the oocyte. Gap junctions allow for the transportation of low molecular weight substances (e.g. metabolites, amino acids). Larger compounds enter via endocytosis and receptor-specific interactions. Some subpopulations of granulosa and corona radiata cells accumulate factors such as vascular endothelial growth factor (VEGF), TGF-β and leptin. Furthermore, these molecules were identified in balloon-like structures connected to the apical surface of granulosa cells (Antczak and Van Blerkom, Reference Antczak and Van Blerkom1997). Leptin is localised in human and mouse ovaries (Gonzalez et al., Reference Gonzalez, Simon, Caballero-Campo, Norman, Chardonnens, Devoto and Bischof2000) and in human follicular fluid (Welt et al., Reference Welt, Schneyer, Heist and Mantzoros2003) pointing the potential source of exogenous leptin and the site of entry. Studies show that mitochondria regularly migrate during oocyte maturation. In pig oocytes undergoing maturation mitochondria move along the microtubules towards the nucleus and align to form a layer surrounding chromosome bivalents, then after fertilisation they migrate again, this time to the vicinity of the pronuclei (Sun et al., Reference Sun, Wu, Lai, Park, Cabot, Cheong, Day, Prather and Schatten2001). It seems possible that such movements may stimulate cytoplasmic movement forcing other factors present in the ooplasm including LEP and LEPR to redistribute. The crucial role of leptin at the final stages of oogenesis may be supported by numerous studies relating it to the cascade of events associated with oocyte maturation. Experiments have demonstrated that leptin supplementation during IVM of bovine oocytes exerts long-term positive effects, as shown by the increased proportion of oocytes having the potential to develop to the blastocyst stage, increased cell numbers in blastocysts and reduced proportion of apoptotic cells (Boelhauve et al., Reference Boelhauve, Sinowatz, Wolf and Paula-Lopes2005). Recent studies show that addition of leptin during bovine COC maturation stimulates meiotic progression displayed by the extrusion of first polar body and has a positive effect on the number of oocytes reaching the MII stage (Paula-Lopes et al., Reference Paula-Lopes, Boelhauve, Habermann, Sinowatz and Wolf2007). The presence of LEPR mRNA and protein in oocytes and cumulus cells may suggest that both cell types are responsive to leptin. It is known that oocyte’s developmental potential is directly related to proper cytoplasmic maturation and even though most bovine oocytes resume meiosis in vitro and reach the MII stage, cytoplasmic maturation in vitro is generally compromised. Studies suggest that leptin may stimulate the secretion and synthesis of cumulus-cell-derived factors or convert the cumulus cells to become more responsive to leptin than the oocyte (Paula-Lopes et al., Reference Paula-Lopes, Boelhauve, Habermann, Sinowatz and Wolf2007). Studies also show that although LEPR mRNA is expressed in both oocytes and cumulus cells, maturation of bovine COCs in the presence of leptin increases LEPR and STAT3 transcript abundance in cumulus cells but not in the oocytes (Paula-Lopes et al., Reference Paula-Lopes, Boelhauve, Habermann, Sinowatz and Wolf2007). Furthermore, the authors also showed that leptin acts as a survival factor that rescues cumulus cells from committing to the apoptotic programme as its presence in culture increases the expression of antiapoptotic transcripts such as BAX and BIRC4. Our data showed the presence of both LEP and LEPR in bovine oocytes and COCs before and after IVM so it may support the notion of an enhancing role for leptin via cumulus cell-dependent mechanisms during oocyte development.
Uneven (polar) distribution of cytoplasmic components is a common feature of a variety of invertebrate and vertebrate oocytes, suggesting that it may be the norm among metazoa. Mammals, however, are regarded as an exception, showing no apparent functional polarity (Gurdon, Reference Gurdon1992). The uniform appearance of the ooplasm and the same size of blastomeres after first cleavage division seem to support the theory of a lack of polarity. Some studies, however, implicate that a few regulatory factors do exhibit polarity. Antczak and Van Blerkom (Reference Antczak and Van Blerkom1997) demonstrated by immunofluorescent analysis that leptin and STAT3 are polarised in mouse and human oocytes. It was reported that after fertilisation and during cleavage, polarity is maintained within the mouse and human embryo. In this case leptin mainly concentrated in one portion of the oocyte and extends from the plasma membrane into the subplasmalemmal cytoplasm. The authors localised leptin and its receptor in the apical surface of the outer blastomeres. This is similar to our finding where in two- and four-cell bovine embryos leptin and leptin receptor were localised in the outer boundary of the blastomeres. We found that the cell number increased, the proteins were detected only in the outer embryonic blastomeres – the internal part of the embryo was virtually free of any signal. This resulted in protein allocation solely to the trophoblast of the bovine blastocyst. So far little published evidence exists on the polarised distribution of regulatory proteins in the mammalian embryo; however, another study by Antczak and Van Blerkom (Reference Antczak and Van Blerkom1999) showed that factors such as TGF-β2, VEGF or pro- and anti-apoptotic proteins Bax and Bcl-x are also distributed in a polarised manner. A recent report by Johnson et al. (Reference Johnson, Alvarez, Borkhsenious and Kubisch2006) showed that a similar distribution pattern is true for interferon-tau (IFN-τ). Confocal analysis revealed that similar to LEP and LEPR, IFN-τ is localised only in the trophoblast cells of bovine blastocyst and no signal was detected from the ICM. This result is also interesting as IFN-τ is thought to be the primary signal for the establishment and maintenance of pregnancy by ruminant embryos. The presence of leptin and its receptor, as well as the expression of LEP and LEPR genes at the site of embryo attachment may support an important role for leptin in implantation. It was shown that leptin promotes angiogenesis by interactions with the two most crucial angiogenetic factors FGF-2 and VEGF (Cao et al., Reference Cao, Brakenhielm, Wahlestedt, Thyberg and Cao2001). The presence of leptin, IFN-τ and VEGF in the same group of cells is striking. Moreover, the presence of leptin receptor in mouse, bat (Zhao et al., Reference Zhao, Townsend, Schulz, Kunz, Li and Widmaier2004), rat (Smith and Waddell, Reference Smith and Waddell2002) and human (Castellucci et al., Reference Castellucci, De Matteis, Meisser, Cancello, Monsurro, Islami, Sarzani, Marzioni, Cinti and Bischof2000) placenta seems to support the idea of leptin’s importance at the later stages of trophoblast invasion as well as during foetal development. In addition to its expression in the developing embryo, leptin has also been detected in mouse uterine fluid (Kawamura et al., Reference Kawamura, Sato, Fukuda, Kodama, Kumagai, Takinawa, Murata and Tanaka2003) and found to be secreted by human endometrium (Gonzalez et al., Reference Gonzalez, Simon, Caballero-Campo, Norman, Chardonnens, Devoto and Bischof2000). In vitro studies on mice showed that leptin stimulates the secretion of β3-integrin and promotes cell adhesion to the extracellular matrix proteins (Yang et al., Reference Yang, Cao, Bo, Peng, Liu and Duan2006). The same study also demonstrated that various isoforms of the leptin receptor are present in the luminal epithelium of the mouse uterus. Castellucci et al. (Reference Castellucci, De Matteis, Meisser, Cancello, Monsurro, Islami, Sarzani, Marzioni, Cinti and Bischof2000) showed that both leptin and its receptor may influence trophoblast invasion, as long and short isoforms of the leptin receptor exhibit strong expression levels in the distal extravillous cytotrophoblastic cells of cell columns of human placenta. These authors also showed that leptin has the ability to modulate the expression of matrix metalloproteinases (MMP) that are important factors in implantation. Similar studies by Schulz and Widmaier (Reference Schulz and Widmaier2004) demonstrated that leptin significantly increases mouse trophoblast invasion by day 10 of in vitro culture and the observed effect was dependent on MMP. The authors also showed that a dose of leptin (50 ng/ml) corresponding to the highest plasma leptin levels during mouse pregnancy has the greatest effect on trophoblast invasion – above that level no additional stimulation was observed. Our data may support these findings as both LEP and LEPR proteins were allocated exclusively to the trophoblast cells.
In conclusion the results of this work complement available data on early embryonic development and provide further evidence for a role for leptin in mammalian development as numerous studies point to leptin as a potential embryonic growth factor. Embryos cultured in leptin-supplemented medium exhibit increased developmental potential, higher number of blastomeres, lower apoptotic index and higher expression level of transcription factor STAT3 and LEPR (Fedorcsak and Storeng, Reference Fedorcsak and Storeng2003; Kawamura et al., Reference Kawamura, Sato, Fukuda, Kodama, Kumagai, Takinawa, Murata and Tanaka2003; Craig et al., Reference Craig, Zhu, Dyce, Wen and Li2005). At the very early stages it is probably one of the crucial factors positively affecting embryonic developmental potential. At later stages, manifested by cell differentiation into the ICM and trophoblast, leptin of an embryonic origin may become one of the factors signalling and preparing uterus for implantation.
Acknowledgements
The authors would like to thank Dr Anne Segonds-Pichon (Bioinformatics Department of The Babraham Institute, Cambridge, UK) for her help with the statistical analysis and also the Electron and Confocal Microscopy Laboratory of the Department of Biology of A. Mickiewicz University, Poznan, Poland for making accessible the confocal laboratory and for assistance with microscopic imaging. The work was supported in part by The Polish State Committee for Scientific Research (KBN), project no. KBN - 2PO6 D 02127 and by The Centre of International Mobility (CIMO) awarded as a 5-month scholarship by the Finish Ministry of Education.