The areas of the medial parieto-occipital cortex (mPOC) have been extensively explored in anatomical and physiological studies, but their location, extent, and in some cases also their existence are still rather controversial in different species of primates. Methodological factors such as location within very deep sulci, which renders extensive sampling difficult, and the use of different criteria for parcellation have contributed to this disagreement. The aim of this review is to present the current view of the areal subdivision of mPOC obtained by using cyto- and myelo-architectural analysis, as well as analysis of neuro-anatomical connections and neuronal properties studied in anesthetized and awake, behaving monkeys.
The mPOC
The superior parietal lobule (SPL) in the primate brain occupies the medial part of the parietal lobe (Fig. 1, top). In the caudal part of SPL, between parietal and occipital lobes, there is a large region of cortex, the mPOC, hidden within the parieto-occipital sulcus (POs). This is a rather convoluted region that has always presented difficulties of interpretation in anatomical studies because it shows architectural distortions in any plane of section, making it difficult to recognize consistent cytoarchitectonic parcellations.
Brain location of the parietal occipital cortex. Top, posterior view of macaque brain (Macaca fascicularis). SPL: superior parietal lobule; IPL: inferior parietal lobule; IPs: intraparietal sulcus; Ls: lunate sulcus; POs: parieto-occipital sulcus; STs: superior temporal sulcus; Lf: lateral fissure; Cs: central sulcus; and Cal: calcarine fissure. Bottom, parcellations of the monkey mPOC based on cytoarchitecture in Cercopithecus by Brodmann (Reference Brodmann1909) and in Macaca by von Bonin and Bailey (Reference von Bonin and Bailey1947). Dashed lines limit the region of interest, areas 18 and OB are indicated in red, areas 19 and OA in green.

The pioneering cytoarchitectural studies of Brodmann (Reference Brodmann1909) at the beginning of last century described in the Cercopithecus a clear subdivision between the cortex of the occipital and parietal lobes. According to Brodmann (Reference Brodmann1909), the parieto-occipital cortex, located at the border between parietal and occipital lobes, is occupied by two areas, 18 and 19 (colored regions in Fig. 1, left). In the medial part of the parieto-occipital cortex, that is, in the cortex hidden within the POs, area 18 occupies the posterior bank of the sulcus and area 19 the anterior bank. Looking at the mesial surface of the hemisphere (left, bottom part of Fig. 1), this dichotomy is clearly visible, with area 18 located posteriorly, in the cuneate cortex, and area 19 anteriorly, in the precuneate cortex.
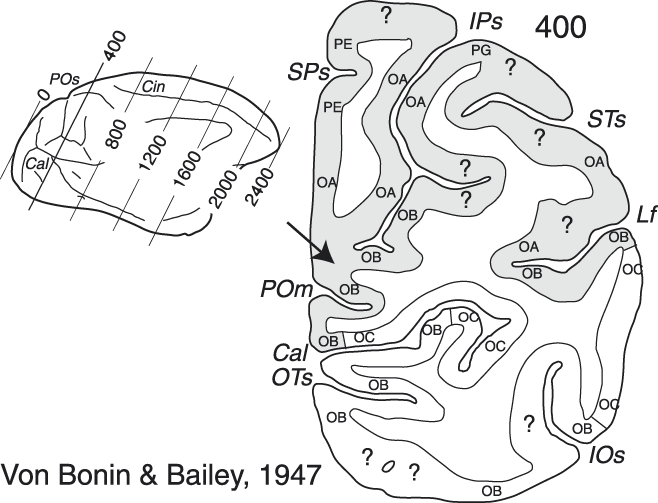
Forty years later, another seminal cytoarchitectural study described the mPOC areas in Macaca (von Bonin & Bailey, Reference von Bonin and Bailey1947). Von Bonin and Bailey re-named areas 17, 18, and 19 as areas OC, OB, and OA, respectively, while changing the proposed location of their borders slightly (Fig. 1, right). In the mPOC in particular, the territory of area OB was expanded, occupying a larger part of the mesial surface of the hemisphere (see the right, bottom part of Fig. 1). A detailed analysis of the coronal slices reported in that study showed that area OB occupied not only the posterior bank of the POs, but also the fundus and the ventralmost part of the anterior bank of the sulcus (see the right, bottom part of Fig. 1 and the cortical region indicated by the arrow in the right part of Fig. 2), whereas area OA occupied most of the remaining dorsal portion of the anterior bank of POs (Fig. 2, right; see also the medial view of the hemisphere in the bottom part of Fig. 1, right).
Cytoarchitectonic parcellation of the parietal occipital cortex. Left, mesial view of Macaca brain by von Bonin and Bailey (Reference von Bonin and Bailey1947). The oblique lines indicate the level of many near-coronal sections. Right, a section taken at the level of the parieto-occipital cortex, just anterior to the parieto-occipital sulcus. Gray area highlights the region of interest. Abbreviations: SPs: subparietal sulcus; IOs: inferior occipital sulcus; OTs: occipito-temporal sulcus; POm, medial parieto-occipital sulcus; and Cin: cingulate sulcus. Other details are as in Fig. 1.
Later, functional studies partly confirmed and partly modified the areal subdivisions proposed by Brodmann and by von Bonin and Bailey. Area 17, or OC, was recognized as a single area also from the functional point of view and was named area V1 (primary visual area) (Daniel & Whitteridge, Reference Daniel and Whitteridge1961; Van Essen et al., Reference Van Essen, Newsome and Maunsell1984). Areas 18/OB and 19/OA, instead, were functionally subdivided into different areas. Regarding the mPOC, which is the target of our review, area 18/OB was subdivided into two areas, named V2 and V3 (Zeki, Reference Zeki1969; Zeki, Reference Zeki1977; Van Essen & Zeki, Reference Van Essen and Zeki1978; Gattass et al., Reference Gattass, Gross and Sandell1981; Gattass et al., Reference Gattass, Sousa and Gross1988), whereas area 19/OA was initially considered as a single functional area named PO that occupied the entire anterior bank of POs (Gattass et al., Reference Gattass, Sousa, Covey, Chagas, Gattass and Gross1985) (Fig. 3A and 3B).
Brain location of the areas of the parieto-occipital cortex. (A and B) Mesial and dorsal views of monkey brain with POs, IPs, Ls, STs, IOs, and OTs partially opened (see gray regions to the right) to show the areas of the parieto-occipital cortex based on the study of Gattass et al., Reference Gattass, Sousa, Covey, Chagas, Gattass and Gross1985. (C and D) Mesial and dorsal views of monkey brain with POs, IPs, and Ls partially opened to show the areas of the parieto-occipital cortex based on the study of Colby et al., Reference Colby, Gattass, Olson and Gross1988. (E and F) Enlargements of mesial and dorsal views of monkey brain shown in C and D with the parcellation of the monkey mPOC based on the study of Galletti et al. (Reference Galletti, Kutz, Gamberini, Breveglieri and Fattori2003, Reference Galletti, Gamberini, Kutz, Baldinotti and Fattori2005). Gratings and colored areas limit the region of interest. The “minus” and the ‘plus’ signs indicate the lower and the upper visual field representations. Other details are as in Figs. 1 and 2.
Areas of the posterior bank of the parieto-occipital sulcus
Areas V2 and V3
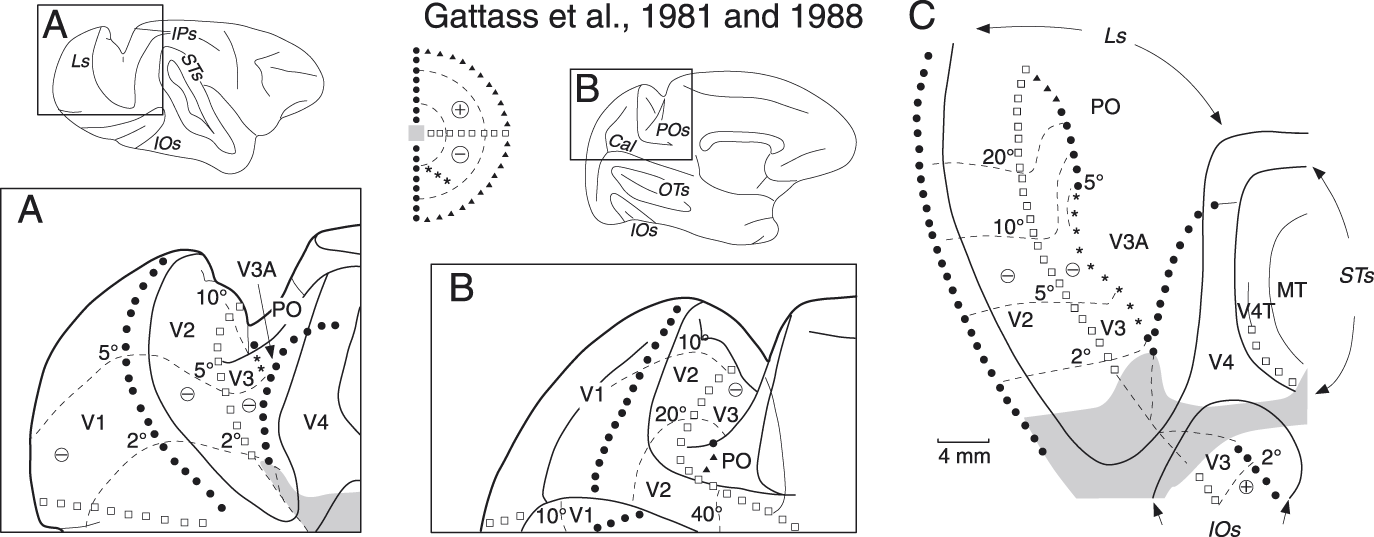
Many functional studies have reported the presence of two retinotopically organized visual areas, V2 and V3, in the posterior bank of the lunate and parieto-occipital sulci of the macaque (Zeki, Reference Zeki1977; Van Essen & Zeki, Reference Van Essen and Zeki1978; Gattass et al., Reference Gattass, Gross and Sandell1981; Gattass et al., Reference Gattass, Sousa and Gross1988). According to Gattass et al. (Reference Gattass, Gross and Sandell1981, Reference Gattass, Sousa and Gross1988), the parts of these areas located in the posterior bank of the lunate sulcus represent the central 10° of the contralateral lower visual field (see Fig. 4A and 4C) and those located in the posterior bank of the POs, the periphery of the contralateral lower visual field (see Fig. 4B and 4C). In both lunate and POs, area V2 borders on the primary visual cortex (V1) dorsally, where the vertical meridian is represented, and on V3 ventrally, where the horizontal meridian is represented (Fig. 4C). The representation in the anterior border of V3 is less clearly defined in that the vertical meridian is reported to be represented only in a small part of the medial extent of the area (see Fig. 4C). The upper visual fields of V2 and V3 are represented in the ventral part of the brain, below the level of the calcarine sulcus (Gattass et al., Reference Gattass, Gross and Sandell1981; Gattass et al., Reference Gattass, Sousa and Gross1988). Van Essen and co-workers (Van Essen et al., Reference Van Essen, Newsome, Maunsell and Bixby1986; Felleman & Van Essen, Reference Felleman and Van Essen1987; Felleman et al., Reference Felleman, Xiao and McClendon1997) considered the ventral part of V3 as a different cortical area, that they called VP, because this cortical region, contrary to the dorsal V3, was not directly connected with V1 and showed a different pattern of myeloarchitecture as well as of callosal and intrahemispheric connections. These authors suggested that area V3 was restricted to the dorsal half of the brain and lacked a complete representation of the visual field.
Retinotopic organization of areas V2 and V3. (A) Lateral view of monkey brain with POs, IPs, Ls, STs, and IOs partially opened. (B) Mesial view of monkey brain with POs, IOs, and OTs partially opened. Lateral and mesial views show the retinotopic organization of V2 and V3 in lunate and parieto-occipital sulci, respectively. Gray area in A represents the most central part of the visual field. (C) Bidimensional map of the parieto-occipital cortex, showing in particular the retinotopic organization of areas V2 and V3. The dashed lines are isoeccentricity lines. Black circles and white squares indicate the representation of the VM and HM meridians, respectively; triangles indicate the periphery of the visual field; the anterior border of V3 (stars) corresponds to the region of the visual field shown with stars in the representation of the contralateral hemifield represented between A and B (modified from Gattass et al., Reference Gattass, Gross and Sandell1981, Reference Gattass, Sousa and Gross1988). Other details are as in Figs. 1–3.
A series of electrophysiological experiments carried out in awake macaque monkeys in our laboratory allowed a detailed description of the visual topography of the cortex hidden within the mPOC (Galletti et al., Reference Galletti, Fattori, Gamberini and Kutz1999a; Galletti et al., Reference Galletti, Fattori, Kutz and Gamberini1999b; Galletti et al., Reference Galletti, Gamberini, Kutz, Baldinotti and Fattori2005). In the posterior bank of the POs, we recognized V2 and V3 as two strips of cortex which, in agreement with the literature (see Fig. 4B and 4C), represented the lower contralateral visual field at eccentricities <30°. According to Gattass and co-workers (Gattass et al., Reference Gattass, Gross and Sandell1981), V2 continued on the mesial surface of the occipital lobe and on the upper branch of the calcarine stem, representing progressively higher eccentricities up to the far periphery (60–70°). Area V3, instead, stopped at the medial margin of the POs, as previously reported by Gattass and co-workers (Figs. 3B and 4B) (Gattass et al., Reference Gattass, Sousa and Gross1988).
Fig. 5 shows some examples of the mapping studies that allowed us to achieve the conclusions reported above. Fig. 5A shows a very medial parasagittal section of the brain, taken a few mm from the midline. Here, V2 occupies the posterior bank and fundus of POs, the ventral convexity of the brain, and the upper branch of the calcarine sulcus. Receptive field at recording site 1, near V1/V2 border, is near the vertical meridian. Moving from recording site 1 to recording site 7, the receptive fields first approach and then touch the horizontal meridian at the border with area V6. As the recording sites move caudally along the ventral convexity of the brain (sites 7–11), the sequence reverses toward the vertical meridian (V1/V2 border in the upper branch of the calcarine stem). A similar sequence is observed in the ventral convexity of the brain in section B, taken some mm more lateral than section A (Fig. 5B). Here, again, the receptive fields at sites 9–12 move away from the horizontal meridian going caudally along the ventral convexity. In the dorsal part of POs, the receptive fields of V2 move from the vertical meridian (site 1, at the border with V1) to the horizontal meridian (site 4). Passing from site 4 to site 5, there is a sudden increase in receptive field size. Since the two sites were recorded in the same penetration and the receptive fields were located at the same eccentricity on the horizontal meridian, this is likely the border between the areas V2 and V3. This view is supported by the fact that in the ventralmost part of the posterior bank of POs the receptive fields remain larger than those of V2 at about the same location and eccentricity (compare site 4 with sites 5–8). It is worthwhile to note that at the border between V6 and V2–V3 there is always a representation of the horizontal meridian (Fig. 5A and 5B).
Visual topography of the medial part of area V3. (A, B, and C) Three parasagittal sections are shown on the left, taken at the levels indicated on the brain silhouettes reported between them. Crosses, open circles, and plus on the sections indicate recording sites in V1, V2/V3, and V6, respectively; the receptive fields mapped at these recording sites are shown on the right. The part of area V3 located in the POs is colored in green. V3 receptive fields are colored accordingly. Dashed lines on sections mark the limits between different cortical areas. (D) Visual field representation of the part of V3 located in POs (green). The colored region was obtained by outlining the external borders of superimposed receptive fields of V3 neurons recorded from four different cases. Some of the receptive fields reported in B and C are here outlined (the letter refers to the section where that receptive field belongs to, and the number indicates the number of receptive fields selected in the corresponding section). White squares and black circles represent the center of receptive fields located, respectively, in the vicinity of the horizontal and vertical meridians. Other details are as in Figs. 1–4.
Section C is taken at the lateral end of POs (Fig. 5C). Here, the V2–V3 border is located halfway in the posterior bank of POs, where the horizontal meridian is represented (sites 3/4). When V3 approaches V6 in the fundus of POs, the receptive fields approach the vertical meridian at progressively increasing eccentricities (sites 6 and 7). In the ventral part of the posterior bank of POs, V3 is located posteriorly (sites from 4 to 7), as in section B, and V6 merges with V3 anteriorly (sites from 8 to 11). At the V3–V6 border, there is a horizontal meridian representation dorsally (sites 4–8), at about 15° of eccentricity, and a vertical meridian ventrally, in the fundus of POs (sites 6 and 7), at about 30° of eccentricity. Note that, given their particular arrangement (see Fig. 5C), both V3 and V6 span from horizontal to vertical meridian representation, and both border V2 at the level of horizontal meridian representation.
Fig. 5D summarizes the data from four cases. It shows that within the POs the lateral part of V3, near lunate sulcus–POs junction, mainly represents the vertical meridian and nearby regions of the lower contralateral visual field up to eccentricities of about 30° (C6, C7). In contrast, the medial part of V3, near the interhemispheric midline, mainly represents the horizontal meridian and nearby regions, again up to about 30° of eccentricity (B5–B8). Our data well agree with those of Gattass et al., (Reference Gattass, Sousa and Gross1988), who reported that the anterior border of V3 represents the vertical meridian only in a small part of the medial extent of the area, where the lunate sulcus joins the POs (see Fig. 4C).
Areas of the anterior bank of the parieto-occipital sulcus
It is well known that the definition of areas is a process of constant refinement, and in many cases larger areas become gradually subdivided into smaller areas as the anatomical and physiological knowledge progresses. In line with this typical process, the area PO, that was at first reported to occupy the whole anterior bank of the macaque POs (Gattass et al., Reference Gattass, Sousa, Covey, Chagas, Gattass and Gross1985) (Fig. 3A and 3B), some years later was redefined as a smaller region, corresponding to the ventral part of the original PO (Fig. 3C and 3D). The re-defined PO only represented the periphery of the contralateral visual field beyond 20° of eccentricity, with the lower quadrant in the ventral part of the anterior wall of POs and the upper quadrant in the ventrocaudal precuneate cortex, on the mesial surface of the hemisphere (Fig. 3C and 3D) (Gattass et al., Reference Gattass, Sousa and Covey1986; Colby et al., Reference Colby, Gattass, Olson and Gross1988). According to this view, the horizontal meridian representation ran vertically along the medial part of the anterior bank of POs (Fig. 3C and 3D). Although the upper and lower field representations were found to be spatially segregated, area PO showed a complex visual topography without a point-to-point retinotopic organization, or a clear central to peripheral trend within the area.
Areas V6 and V6A
The history of areas V6 and V6A, like that of area PO, also reflects a process of refinement whereby large areas become subdivided into smaller ones. The term “V6” was first introduced by Zeki (Reference Zeki1986) to describe a visual cortical region delimited by strong callosal connections, which occupied almost the entire anterior bank of the POs, thus overlapping considerably with the original PO of Gattass et al., Reference Gattass, Sousa, Covey, Chagas, Gattass and Gross1985. A few years later, Galletti et al. (Reference Galletti, Battaglini and Fattori1991), recording from the same region in alert behaving monkeys, found a dorsal region containing visual and nonvisual cells and a ventral region containing only visual neurons. These results were reminiscent of those previously reported on anesthetized monkeys that described a visual area PO in the ventral part of the anterior bank of POs and a region less sensitive to the visual stimulation dorsal to it (Colby et al., Reference Colby, Gattass, Olson and Gross1988). Following electrophysiological studies carried out in awake macaque monkeys confirmed that the anterior bank of the POs contains two functionally distinct areas: a ventral one, that was named V6, and a dorsal one, named V6A (Fig. 3E and 3F) (Galletti et al., Reference Galletti, Fattori, Battaglini, Shipp and Zeki1996; Galletti et al., Reference Galletti, Fattori, Gamberini and Kutz1999a; Galletti et al., Reference Galletti, Fattori, Kutz and Gamberini1999b; reviewed in Galletti et al., Reference Galletti, Kutz, Gamberini, Breveglieri and Fattori2003).
V6 is a visual motion area whose neurons are very sensitive to the direction, orientation, and speed of motion (Galletti et al., Reference Galletti, Fattori, Battaglini, Shipp and Zeki1996) and to the real movement of objects in the visual space (Galletti & Fattori, Reference Galletti and Fattori2003). It is also an area that emphasizes the representation of the periphery of the visual field (Galletti et al., Reference Galletti, Fattori, Gamberini and Kutz1999a). At first glance, area V6 seems to correspond to the revised area PO of Colby et al., Reference Colby, Gattass, Olson and Gross1988. However, a more careful comparison suggested that this is unlikely to be the case (Galletti et al., Reference Galletti, Gamberini, Kutz, Baldinotti and Fattori2005). While PO was reported to represent only eccentricities higher than 20–30° and to contain a complex visuotopic map (Neuenschwander et al., Reference Neuenschwander, Gattass, Sousa and Piñon1994; Colby et al., Reference Colby, Gattass, Olson and Gross1988), V6 contains a point-to-point complete representation of the contralateral visual field, including the central 20° but with an over-representation of the visual field periphery (Galletti et al., Reference Galletti, Fattori, Gamberini and Kutz1999a). Also the location and extent of V6 do not exactly match those proposed for area PO (Fig. 3E and 3F) (Galletti et al., Reference Galletti, Gamberini, Kutz, Baldinotti and Fattori2005). As shown in Fig. 6A–6C, area V6 (yellow region), if seen in a coronal plane (Fig. 6B), occupies a “C”-shaped belt of cortex whose upper branch is located within the POs and the lower one within the medial parieto-occipital sulcus (POm), with the mesial surface of the brain as a junction zone between the two. The lower visual field is represented dorsally, in the ventral part of the anterior bank of POs (Fig. 6E), while the upper visual field is represented ventrally, in the dorsal bank of POm (Fig. 6D). Also area PO occupies a “C”-shaped belt of cortex (Fig. 3C and 3D), but in PO the “C” is horizontally, instead of coronally, displaced with the lower visual field represented laterally, within the POs, and the upper visual field medially, on the mesial surface of the brain (Colby et al., Reference Colby, Gattass, Olson and Gross1988). It is worthwhile to note that area PO, in contrast to V6, was not reported to include the cortex hidden within the POm (see Fig. 3C), although the inspection of sections reported by Colby and colleagues clearly shows that PO involved also the POm (see Figs. 2 and 3 of Colby et al., Reference Colby, Gattass, Olson and Gross1988). It results that the upper field representation in PO is located on the exposed mesial surface of the hemisphere (Colby et al., Reference Colby, Gattass, Olson and Gross1988), with the horizontal meridian representation running vertically along the anterior bank of POs (Fig. 3D). In contrast, the upper field representation of V6 is mostly hidden within the POm (Fig. 6D).
Brain location of areas V6, V6Av, V6Ad, and visual topography of V6 on 3D reconstruction of the brain. (A and C) Topographical arrangement of areas V6, V6Av, and V6Ad along the anterior bank of POs in medial (A) and dorsal (C) views of a macaque right hemisphere. Area V6 is represented in yellow, V6Av in blue, and V6Ad in pink. (B) 3D reconstructions of the caudalmost part of the SPL obtained from coronal sections. The part of SPL shown in B is that within the parallelepiped in A. In B, the occipital pole is cut away to show the anterior bank of the POs. Dorsal is up and mesial is on the left. (D and E) Mesial view and enlargement of a dorsal view of the brain of a macaque right hemisphere to respectively visualize the lower and upper field representation of area V6 in POm (D), and the lower field representation of area V6 in POs (E). White, orange, and red indicate the eccentricities represented in different parts of V6 according to the color coding shown in the middle. White squares and black circles represent the horizontal (HM) and vertical (VM) meridians of area V6, respectively; (F) center of gaze (modified from Galletti et al., Reference Galletti, Fattori, Gamberini and Kutz1999a; Pitzalis et al., Reference Pitzalis, Sereno, Committeri, Fattori, Galati, Tosoni and Galletti2013). Abbreviations: ARs: arcuate sulcus; Ps: principal sulcus; a: anterior; v: ventral; m: medial. Other details are as in Figs. 1–4.
As described in detail by Galletti and co-authors (Galletti et al., Reference Galletti, Fattori, Gamberini and Kutz1999a), most of the extent of V6 is devoted to the representation of the periphery of the visual field, the lower quadrant in the ventralmost part of the anterior bank of POs (Fig. 6E), and the mesial surface of the hemisphere (Fig. 6D), the upper quadrant mainly in the upper branch of POm (Fig. 6D). Moving laterally within the POs, the V6 moves down from the anterior bank to the fundus of POs, and then up along the posterior bank of POs where it merges with the cortex of area V3 (Figs. 5C and 6E). This part of V6, representing the central 20–30° of the lower visual field (Galletti et al., Reference Galletti, Fattori, Gamberini and Kutz1999a), was originally not attributed to PO (Colby et al., Reference Colby, Gattass, Olson and Gross1988; see Galletti et al., Reference Galletti, Gamberini, Kutz, Baldinotti and Fattori2005). Area V6 represents the horizontal meridian posteriorly and the vertical meridian anteriorly (Fig. 6E). As shown in the top part of Fig. 7, the receptive field size in V6 increases with eccentricity, as it is usual in visual areas.
Receptive-field size versus. eccentricity in the areas of the mPOC, and visual field representation in areas V6Av and V6Ad. Top, regression lines representing the receptive field size versus eccentricity in areas, V6 (466 cells), V6Av (586 cells), and V6Ad (325 cells). ANCOVA analysis established that the two regression lines of areas V6Av and V6Ad were significantly different in slope (F 905 = 14.73; P < 0.0001) and in elevation (F 905 = 49.23; P < 0.0001). Bottom, density maps of receptive-field distribution in areas V6Av and V6Ad. Color scale indicates the relative density of receptive fields covering that specific part of the visual field. In the white region, 140 (V6Av) and 120 (V6Ad) RFs are superimposed in the same grid square.
Area V6 is the target of strong projections directly from V1 (Galletti et al., Reference Galletti, Gamberini, Kutz, Fattori, Luppino and Matelli2001), with projecting cells mainly confined within layer 4B (Fig. 8A, see panels “a” and “b”). Layer 4B cells are known to receive from layer 4Cα, which in turn directly receives a magnocellular input from the lateral geniculate nucleus (Lund et al., Reference Lund, Lund, Hendrickson, Bunt and Fuchs1975). This input could be responsible for the strong orientation and motion direction selectivity observed in V6 (Galletti et al., Reference Galletti, Fattori, Battaglini, Shipp and Zeki1996). About half of the cortical inputs to V6 comes from the visual areas of the occipital lobe (V1, V2, V3, and V3A), the other half from the parietal areas of the ‘dorsal visual stream’: 30% from visual areas of the dorso-lateral visual stream (V4T, MT/V5, MST, and LIPv) and the remaining 20% from bimodal sensory (visual and somatosensory) areas of the dorso-medial visual stream (V6Av, MIP, and VIP; see Fig. 8B) (Galletti et al., Reference Galletti, Gamberini, Kutz, Fattori, Luppino and Matelli2001). Area V6 is not directly connected with the “ventral visual stream” or with the mesial and frontal cortices. It has been suggested that V6 transfers visual information relative to form and motion to parietal and frontal cortices involved in a visual guidance of action (Galletti et al., Reference Galletti, Gamberini, Kutz, Fattori, Luppino and Matelli2001). In fact, V6 is directly connected with area V6Av (Passarelli et al., Reference Passarelli, Rosa, Gamberini, Bakola, Burman, Fattori and Galletti2011), which in turn sends strong projections to area V6Ad (Gamberini et al., Reference Gamberini, Passarelli, Fattori, Zucchelli, Bakola, Luppino and Galletti2009) (see Fig. 8B), and it is well known that both V6Ad and the dorsal premotor cortex, that receives directly from V6Ad (Gamberini et al., Reference Gamberini, Passarelli, Fattori, Zucchelli, Bakola, Luppino and Galletti2009) (see Fig. 8B), are involved in the visual guidance of arm reaching movements and objects grasping (Caminiti et al., Reference Caminiti, Johnson, Galli, Ferraina and Burnod1991; Raos et al., Reference Raos, Umilta, Gallese and Fogassi2004; Fattori et al., Reference Fattori, Kutz, Breveglieri, Marzocchi and Galletti2005; Bosco et al., Reference Bosco, Breveglieri, Chinellato, Galletti and Fattori2010; Fattori et al., Reference Fattori, Raos, Breveglieri, Bosco, Marzocchi and Galletti2010; Gamberini et al., Reference Gamberini, Galletti, Bosco, Breveglieri and Fattori2011).
Laminar pattern of labeling in V1 after V6 tracer injection, and summary of connections of areas V6, V6Av, and V6Ad. (A) Caudal part of a parasagittal section taken at the level indicated on the brain silhouette at the bottom. Each single dot represents a retrogradely labeled cell. (a) Inset showing an enlargement of a part of the posterior branch of Cal (squared area on the section). Yellow triangles are single retrogradely labeled cells. Numbers and letters indicate the cortical layers. (b) Dark-field photomicrograph of the squared region of Cal cortex shown on the section, containing transported labeled materials after V6 injection. Scale bar, 1 mm. (B) Summary of connections of areas V6, V6Av, and V6Ad. The boxes representing different areas are organized approximately in a caudal to rostral sequence, from the bottom part of the figure to the top. The proportion of neurons forming each connection is indicated by the thickness of the bars linking different areas. Cortico-cortical afferents to area V6 are represented in yellow, to V6Av in blue, and to V6Ad in pink. Other details are as in Figs. 1–4.
Area V6 has also been recognized in the human brain (Pitzalis et al., Reference Pitzalis, Galletti, Huang, Patria, Committeri, Galati, Fattori and Sereno2006). Human V6, like macaque V6, is a retinotopically organized visual motion area that represents the contralateral visual field and emphasizes the periphery of the visual field. As in the macaque, human V6 is located in the POs and the relationships with neighboring areas are almost the same in the two species (see Fig. 9). In human, like in macaque, V6 abuts on area V6Av anteriorly, V2 posteriorly, and V3/V3A laterally. Details on brain location, functional organization, and properties of human V6 are fully described in the study by Pitzalis et al. in this issue.
Brain location of areas V6, V6Av, and V6Ad in monkey and human. Brain location of V6Av (blue) and V6 (yellow) areas in macaque (A and B) and human monkeys (C and D). A and B show also the location of macaque area V6Ad. A medial view of the inflated surface (left column) and a flat map of the posterior brain (right column) are shown. A and C show the typical topographical arrangement of areas V6Av, and V6 along the POs. B and D show the spatial relationship among areas V6Av, V6, and other early visual areas. Light and dark gray areas indicate gyri and sulci (modified from Gamberini et al., Reference Gamberini, Galletti, Bosco, Breveglieri and Fattori2011; Pitzalis et al., Reference Pitzalis, Sereno, Committeri, Fattori, Galati, Tosoni and Galletti2013). pIPs, posterior end of the intraparietal sulcus; l, lateral. Other details are as in Figs. 1–4.
An area very similar to V6, called dorso-medial area (DM), is also present in the medial parieto-occipital region of the New World monkeys (Rosa & Tweedale, Reference Rosa and Tweedale2001). Similar to macaque V6, DM has a point-to point retinotopic representation of the contralateral visual field, with the horizontal meridian located posteriorly and the vertical meridian anteriorly, and the most peripheral part of the upper quadrant on the medial surface of the hemisphere. DM, as V6 (Galletti et al., Reference Galletti, Fattori, Battaglini, Shipp and Zeki1996; Galletti & Fattori, Reference Galletti and Fattori2003), contains many orientation- and direction-selective cells (Baker et al., Reference Baker, Petersen, Newsome and Allman1981; Rosa & Schmid, Reference Rosa and Schmid1995). Moreover, area DM shows a pattern of cortical connections very similar to that of area V6 (Krubitzer & Kaas, Reference Krubitzer and Kaas1993; Beck & Kaas, Reference Beck and Kaas1999; Rosa & Tweedale, Reference Rosa and Tweedale2000; Rosa et al., Reference Rosa, Palmer, Gamberini, Burman, Yu, Reser, Bourne, Tweedale and Galletti2009).
Areas V6Av and V6Ad
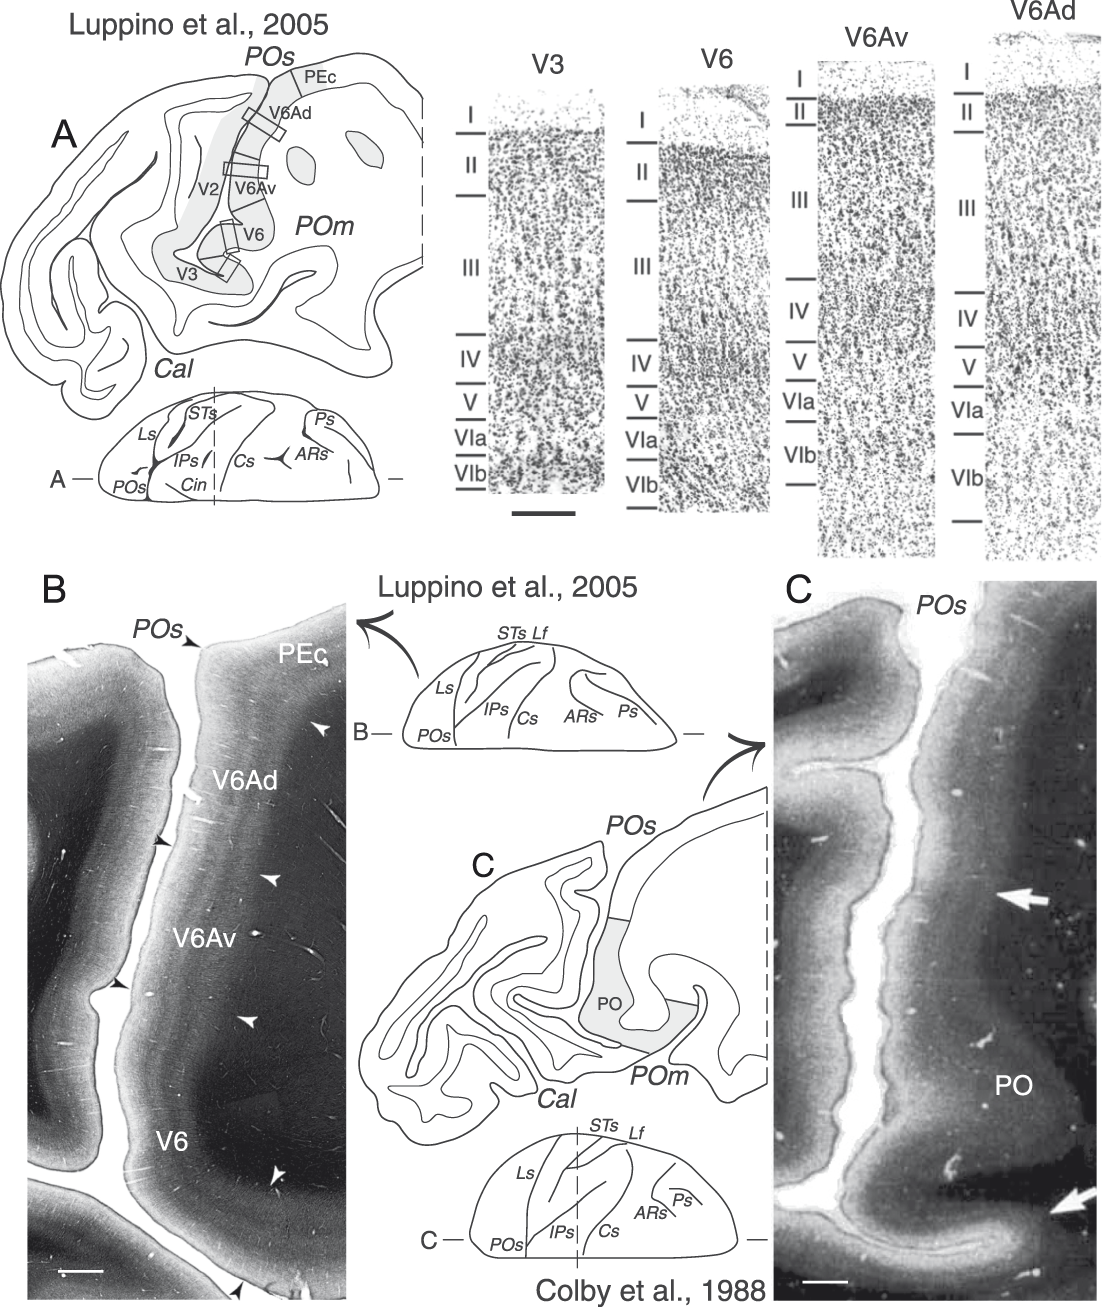
As reported above, electrophysiological studies on awake animals provided evidence that dorsal to V6, in the anterior bank of POs, there was a visuomor area called V6A (Fig. 3E and 3F) (Galletti et al., Reference Galletti, Fattori, Battaglini, Shipp and Zeki1996). In a recent study of Luppino et al., Reference Luppino, Hamed, Gamberini, Matelli and Galletti2005, the cyto- and myeloarchitecture of mPOC were analyzed in detail using coronal, horizontal, and parasagittal planes of section. This study allowed the recognition of different types of cortex in this convoluted part of the brain (see Fig. 10A and 10B). It was reported that the whole posterior wall of POs, the fundus of the sulcus, and the ventralmost part of the anterior wall of POs contained cortex of occipital type (thick and homogeneous layer IV, light layer V), whereas the dorsal part of the anterior wall of POs was occupied by cortex of parietal type (well developed layers III and V, layer IV subdivided into two sublayers), exactly as described by von Bonin and Bailey (Reference von Bonin and Bailey1947) (see Fig. 1, right; Fig. 2). A comparison between cyto- and myeloarchitecture of the anterior wall of the POs revealed that V6 matched the most strongly myelinated region in the ventralmost part of the anterior bank of POs. However, it was clear that the strong myelination continued anterior to the V6 border, overlapping also area V6Av (Fig. 10B). These data suggest that the strongly myelinated region called area PO (see Fig. 10C) (Colby et al., Reference Colby, Gattass, Olson and Gross1988) includes areas V6 and V6Av (compare Fig. 10B and 10C) (Luppino et al., Reference Luppino, Hamed, Gamberini, Matelli and Galletti2005). This hypothesis is supported by the fact that PO was reported to have a complex visual topography, as predicted by the inclusion in PO of the retinotopically organized V6 and the nonretinotopically organized V6Av (Galletti et al., Reference Galletti, Gamberini, Kutz, Baldinotti and Fattori2005; Luppino et al., Reference Luppino, Hamed, Gamberini, Matelli and Galletti2005). Further support comes from a comparison of the anatomical connections of PO and areas V6/V6Av. Apart from the shared connections, PO was reported to be directly connected with areas PGm, 7a, and PMd (Colby et al., Reference Colby, Gattass, Olson and Gross1988) whereas V6 was not connected with these areas (Galletti et al., Reference Galletti, Gamberini, Kutz, Fattori, Luppino and Matelli2001), but V6Av was connected with them (Passarelli et al., Reference Passarelli, Rosa, Gamberini, Bakola, Burman, Fattori and Galletti2011) (see Fig. 8B). It is therefore plausible that the connections with areas PGm, 7a, and PMd observed after PO injections are due to inclusion of area V6Av in the injection sites.
Cyto- and myeloarchitectural subdivisions of the anterior wall of the parieto-occipital sulcus. (A) Parasagittal section taken at the level of parieto-occipital sulcus, as indicated in the dorsal view of macaque brain shown under the section. Gray regions highlight the cortical parcellation reported by Luppino et al., Reference Luppino, Hamed, Gamberini, Matelli and Galletti2005. Boxes on the section drawing indicate the location of the photomicrographs shown on the right. Higher magnification views from the same section of cytoarchitectonic areas V3, V6, V6Av, and V6Ad. Scale bar (shown under V3), 200 μm. (B) Parasagittal section stained for myelin taken at the level of parieto-occipital sulcus (modified from Luppino et al., Reference Luppino, Hamed, Gamberini, Matelli and Galletti2005). Scale bar, 1 mm. (C) Parasagittal section stained for myelin taken at the level of parieto-occipital sulcus (modified from Colby et al., Reference Colby, Gattass, Olson and Gross1988). Scale bar, 1 mm. Arrows mark the borders between cytoarchitectonic areas. Other details are as in Figs. 1–4.
As shown in Fig. 6A and 6B, V6Av and V6Ad are two concentric belts of cortex (blue and pink regions, respectively) that encircle dorsally and anteriorly area V6. Hodological data showed that V6Av and V6Ad have distinct connectional patterns (Fig. 8B) (Gamberini et al., Reference Gamberini, Passarelli, Fattori, Zucchelli, Bakola, Luppino and Galletti2009; Passarelli et al., Reference Passarelli, Rosa, Gamberini, Bakola, Burman, Fattori and Galletti2011). Area V6Av receives strong inputs from visual- (V2, V3, V4, V6, and MST) and parietal- (PGm, V6Ad, and MIP) areas. Area V6Ad receives visual inputs from MST and V6Av, and other inputs from many parietal areas (MIP, PEc, PGm, LIP, VIP, AIP, PG, and Opt). In addition, a strong input to V6Ad arises from the frontal lobe, mainly from the premotor area F2 (that contains many reach- and grasp-related neurons, Caminiti et al., Reference Caminiti, Johnson, Galli, Ferraina and Burnod1991; Raos et al., Reference Raos, Umilta, Gallese and Fogassi2004) and F7 (more involved in oculomotor activity, Boussaoud et al., Reference Boussaoud, Jouffrais and Bremmer1998; Gregoriou et al., Reference Gregoriou, Luppino, Matelli and Savaki2005), and a weaker but consistent input arises from the prefrontal area 46 (known to be involved in working memory, Luebke et al., Reference Luebke, Barbas and Peters2010; Levy & Goldman-Rakic, Reference Levy and Goldman-Rakic1999). These anatomical studies suggest that V6Av is primarily a visual area that brings visual information from V6 to V6Ad, whereas V6Ad a visuomotor area that links parietal and frontal cortices. This flow of information constitutes the dorso-medial (or dorso-dorsal) stream (Galletti et al., Reference Galletti, Kutz, Gamberini, Breveglieri and Fattori2003; Rizzolatti & Matelli, Reference Rizzolatti and Matelli2003) that integrates different sensory inputs, in particular visual and somatosensory ones, likely for the control of reaching and grasping activities (Galletti et al., Reference Galletti, Fattori, Gamberini and Kutz2004; Gamberini et al., Reference Gamberini, Passarelli, Fattori, Zucchelli, Bakola, Luppino and Galletti2009).
A recent metaanalysis (Gamberini et al., Reference Gamberini, Galletti, Bosco, Breveglieri and Fattori2011) has taken into account the functional properties of about 4000 cells recorded from V6Av and V6Ad in awake animals. The results showed that visual neurons are significantly more represented in V6Av (69% in V6Av vs. 59% in V6Ad). The size of receptive field increases with eccentricity in both V6Av and V6Ad, but in V6Av the receptive fields are significantly smaller than in V6Ad at any value of eccentricity (Fig. 7, cyan and pink lines, respectively). Although both areas V6Av and V6Ad are not point-to-point retinotopically organized, V6Av mainly represents the peripheral part of the visual field while V6Ad mainly the central part of it (Fig. 7, lower panels; Fig. 11C). V6Av represents almost exclusively the lower visual field, whereas V6Ad represents both lower and upper visual fields, with a prevalence of the lower visual field representation (Fig. 7, lower panels and Fig. 11D). The horizontal meridian is represented at the border between V6Av and V6Ad (Fig. 11D).
Visuotopic organization in macaque areas V6 and V6A. (A and B) Dorsal and postero-medial views of a 3D reconstruction of a macaque right hemisphere showing in B the locations of areas V6, V6Av, and V6Ad in the anterior bank of POs, and the nearby area PEc on the dorsal surface of the SPL. The occipital pole was cut away, as indicated in the dorsal view of the hemisphere in A, to show the anterior bank of POs. (C) Distribution in V6A of visual cells with receptive fields in the central (<30°; blue dots) and peripheral (>30°; yellow dots) parts of the visual field, respectively. Yellow and blue areas in V6 indicate the eccentricities represented in different parts of V6 according to the color coding shown at the bottom. (D) Distribution in V6A of visual cells with receptive fields in the lower (green dots) or upper (red dots) visual field. White dots indicate receptive fields located on the horizontal meridian. Red and green areas in V6 indicate the visual field quadrants represented in different parts of V6 according to the color coding shown at the bottom. White squares and black circles represent the HM and VM meridians of area V6, respectively (modified from Galletti et al., Reference Galletti, Fattori, Gamberini and Kutz1999a; Pitzalis et al., Reference Pitzalis, Sereno, Committeri, Fattori, Galati, Tosoni and Galletti2013). Other details are as in Figs. 1–4.
Like area V6, also area V6Av has been recently recognized in the human brain (Pitzalis et al., Reference Pitzalis, Sereno, Committeri, Fattori, Galati, Tosoni and Galletti2013). Human V6Av, like macaque V6Av, is a visual area that mostly represents the periphery of the contralateral lower visual field. The relationships of V6Av with neighboring areas are almost the same in the two species (see Fig. 9D): in human, like in macaque, V6Av abuts on area V6 posteriorly and on V3A laterally. More details on brain location, functional organization, and properties of human V6Av are fully described in the study by Pitzalis et al. in this issue.
Many V6A cells are sensitive to somatosensory stimulation (Breveglieri et al., Reference Breveglieri, Kutz, Fattori, Gamberini and Galletti2002), with this type of cells being twice as common in V6Ad than in V6Av (Gamberini et al., Reference Gamberini, Galletti, Bosco, Breveglieri and Fattori2011). Most of these cells are modulated by the somatic stimulation of the arm/hand, in particular by the joint rotation (Gamberini et al., Reference Gamberini, Galletti, Bosco, Breveglieri and Fattori2011). The large majority of V6A cells are modulated by active arm movements, both in reaching- (Galletti et al., Reference Galletti, Fattori, Kutz and Battaglini1997; Fattori et al., Reference Fattori, Gamberini, Kutz and Galletti2001; Fattori et al., Reference Fattori, Kutz, Breveglieri, Marzocchi and Galletti2005) and grasping- (Fattori et al., Reference Fattori, Breveglieri, Marzocchi, Filippini, Bosco and Galletti2009; Fattori et al., Reference Fattori, Raos, Breveglieri, Bosco, Marzocchi and Galletti2010) tasks. Arm-related cells are uniformly distributed in V6Av and V6Ad (Gamberini et al., Reference Gamberini, Galletti, Bosco, Breveglieri and Fattori2011). Interestingly, however, cells sensitive to the precision grip are more present in V6Ad and cells sensitive to the whole prehension are more present in V6Av (Gamberini et al., Reference Gamberini, Galletti, Bosco, Breveglieri and Fattori2011). This fact, together with the high incidence of central visual field representation in V6Ad and the overrepresentation of the periphery in V6Av, suggests that V6Ad is more involved in the control of the final part of reach-to-grasp actions (Fattori et al., Reference Fattori, Raos, Breveglieri, Bosco, Marzocchi and Galletti2010) and V6Av in the visual analysis of the transport phase of these actions (Fattori et al., Reference Fattori, Raos, Breveglieri, Bosco, Marzocchi and Galletti2010; Gamberini et al., Reference Gamberini, Galletti, Bosco, Breveglieri and Fattori2011).
In conclusion, V6Av and V6Ad show a different distribution of several functional properties, peculiar architectural patterns, different topographical organizations of the visual domain, and partially distinct cortico-cortical circuits. In spite of these differences, V6Av and V6Ad also share several cortical (Fig. 8B) and subcortical (Gamberini et al., Reference Gamberini, Bakola, Passarelli, Burman, Rosa, Fattori and Galletti2015) afferences, as well as functional properties, so that it was suggested they work together in the online control of reach-to-grasp actions (Gamberini et al., Reference Gamberini, Galletti, Bosco, Breveglieri and Fattori2011).
A summary of mPOC organization
Fig. 12 summarizes the organization of parieto-occipital cortex according to data from the literature (Gattass et al., Reference Gattass, Gross and Sandell1981; Gattass et al., Reference Gattass, Sousa and Gross1988) and from our laboratory. In the mPOC, which is the target of this review, we found three retinotopically organized visual areas (V2, V3, and V6) and two visuomotor areas (V6Av and V6Ad) with a complex visual topography. The parts of areas V2 and V3 located in the posterior bank of the POs represent the contralateral lower visual field between 10° and 30° of eccentricity. However, while area V2 is a strip of cortex that represents the vertical meridian dorsally, at the border with V1, and the horizontal meridian ventrally, at the border with V3, area V3 shows a more complex visuotopic organization. It represents the horizontal meridian dorsally, at the border with V2, but the vertical meridian is represented ventrally only in the lateral part of POs, where V3 borders with the central representation of V6. In the medial part of POs, V3 represents only the horizontal meridian and nearby regions of the visual field. Here, V3 borders the horizontal meridian representation of V2 dorsally and that of V6 ventrally. As a whole, within the POs, area V3 represents the lower contralateral visual field between 10° and 30° eccentricities, with the regions near the vertical meridian represented laterally, and those near the horizontal meridian medially.
Flattened map of the mPOC. Flat map of the mPOC of the right hemisphere of the macaque atlas brain showing the spatial relationship among visual areas V2, V3, V3A, and V6, and the visuomotor parietal areas V6Av and V6Ad (boxed area on the top left). CARET software has been used for the 2D reconstruction (http://www.nitrc.org/projects/caret/, Van Essen et al., Reference Van Essen, Drury, Dickson, Harwell, Hanlon and Anderson2001). Light and dark gray areas indicate gyri and sulci, respectively. The dashed lines are isoeccentricity lines. Black circles and white squares indicate the representation of the VM and HM meridians, respectively; triangles indicate the periphery of the visual field; F, center of gaze; ?, likely location of the anomalous central representation of V3A. The location and topography of cortical areas are based on the studies of several authors (modified from Gattass et al., Reference Gattass, Gross and Sandell1981, Reference Gattass, Sousa and Gross1988; Galletti et al., Reference Galletti, Fattori, Gamberini and Kutz1999a; Galletti et al., Reference Galletti, Fattori, Kutz and Gamberini1999b; Pitzalis et al., Reference Pitzalis, Sereno, Committeri, Fattori, Galati, Tosoni and Galletti2013). Other details are as in Figs. 1–4, 6, and 9.
Area V6 is located rostral and laterally to V3. It represents both central and peripheral parts of the visual field, though highly emphasizes this latter, in a point-to-point fashion. The central representation is located laterally within the POs, in the posterior bank of the sulcus, where V6 merges with area V3, while the periphery is located in the ventral part of the anterior bank of POs. The far periphery (>60° of eccentricity) and the upper visual field representation are located on the mesial surface of the hemisphere and in the depth of the medial parieto-occipital sulcus. Areas V6Av and V6Ad are located rostral to V6, in the dorsal part of the anterior bank of POs and on the mesial surface of the hemisphere. V6Av mainly represents the periphery of the contralateral lower visual field, with the vertical meridian that borders on V6 and the horizontal meridian bordering on V6Ad. V6Ad represents mainly the central part of the visual field.
Open questions
Although the present data support the hypothesis of V3 inserting, at least partially, between V2 and V6 within the POs, the alternative hypothesis that V2, instead of V3, borders V6 can not be completely rejected. In fact, if we do not consider the change in receptive field size, the neurons we assigned to V3 in the medial part of POs (see Fig. 5B) could be assigned to V2. The receptive field sequence in the whole posterior bank of POs was coherent with this view, moving the receptive fields from the vertical meridian dorsally, at the border with V1 (site 1), to the horizontal meridian ventrally, in the fundus of POs (sites 8 and 9), and again toward the vertical meridian posteriorly in the ventral convexity of the brain. If this were the case, V3 would be limited to the lunate and the very medial part of POs (Fig. 5C) and would represent the peripheral 30° of the visual field only near the vertical meridian (see sites 4–7 in Fig. 5C and 5D), so lacking in the representation of the complementary part of the visual field near the horizontal meridian (see sites B5–B8 in Fig. 5D). To conclude, it remains an open question whether area V3 stops at the lateral end of POs and represents an asymmetric part of the visual field, or whether it occupies also the medial end of the sulcus so representing the whole lower quadrant of the visual field up to an eccentricity of about 30°. Additional work involving two- and three-dimensional reconstructions of data from single cases is needed to clarify this point.
Another issue that has not been resolved in our studies is the location of the central upper field representation of V6. We have never recorded cells in V6 with a receptive field located within the central 20° of the upper visual field. Since this part of the visual field is represented in what has been described as an anomalous central visual field representation in the medial part of area V3A, a cortical region that borders V6 (see “?” in Fig. 12) described by Van Essen and Zeki (Reference Van Essen and Zeki1978) in one case, we suggested (Galletti et al., Reference Galletti, Fattori, Gamberini and Kutz1999a) that this region is actually the central upper field representation of V6. In agreement with our view, this central field representation shows receptive fields larger than those of the lateral part of V3A, that is, receptive fields similar in size to those of area V6. As this cortical region was not covered by our recording sites, further experiments are needed to verify the validity of this hypothesis.
Acknowledgments
The authors wish to thank M. Verdosci, F. Campisi, L. Passarelli, and G. Placenti for technical assistance. This research was supported by European Union Grants, FP6-IST-027574-MATHESIS and FP7-IST-217077-EYESHOTS, and by Ministero dell'Università e della Ricerca and Fondazione del Monte di Bologna e Ravenna, Italy.