Introduction
The optical properties of nanoscale objects drastically change at the nanometer scale as a function of their size, morphology, and environment. Indeed, when the structure of a material exhibits variations on the order of or below the typical wavelength of light, new photonic or plasmonic modes emerge. When it exhibits variations of the order of the excitonic Bohr radius—a few nanometers, new excitonic states develop. Such considerations would have probably remained as research curiosities if the growing availability of new materials, such as photonic bandgap crystals, metallic nanoparticles, or quantum confined systems (quantum wells, quantum dots), had not triggered the need for new tools and new concepts for the exploration and understanding of this fascinating new realm.
Getting spectroscopic information at the nanoparticle scale, or even better, within individual nanoparticles or unit cells of an artificial material, is not simple because the required spatial resolution is one or two orders of magnitude smaller than the equivalent wavelength in a vacuum or in a medium. This information, however, is crucial in many applications (e.g., biosensors based upon plasmons or photodetectors relying on excitons), but using purely optical microscopy is not usually adequate at these scales. An alternative is to use fast electrons beams, taking advantage of the fact that electron energy-loss spectroscopy (EELS) and cathodoluminescence (CL) can be regarded as the nanometer analog of extinction and scattering/photoluminescence, respectively. These two techniques have for a long time faced similar problems: obtaining, with appropriate spatial and spectral resolutions and signal-to-noise ratio, access to the relevant energy range (IR-visible-UV). After a series of pioneering work both in EELSReference Batson1–Reference Khan, Cunningham, Lazar, Graham, Smith and McComb3 and CL,Reference Yamamoto, Araya and de Abajo4–Reference Jahn, Ristic and Calleja7 these problems have been solved in past yearsReference Yamamoto, Araya and de Abajo4, Reference Nelayah, Stéphan, Kociak, Garcia de Abajo, Henrard, Pastoriza-Santos, Liz-Marzan and Colliex8, Reference Bosman, Keast, Watanabe, Maaroof and Cortie9 for surface plasmons and more recently for quantum emitters.Reference Zagonel, Mazzucco, Tencé, March, Bernard, Laslier, Jacopin, Tchernycheva, Rigutti, Julien, Somguang and Kociak10
The present article is aimed at discussing some of the latest results and applications in mapping and understanding these excitations at the nanometer scale. The interested reader can refer to Reference Reference Garcia de Abajo11 for a deeper understanding of the theoretical background, Reference Reference Kociak, Stéphan, Walls and Colliex12 for a deeper understanding of technical issues, and References Reference Kociak, Stéphan, Walls and Colliex12 and Reference Colliex13 for information on other spatially resolved electron spectroscopy findings and applications.
Experimental and simulation techniques
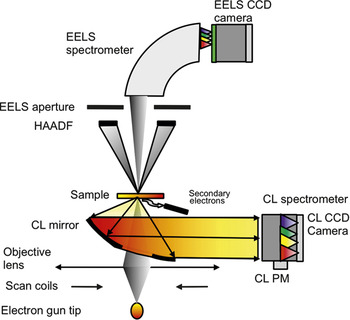
Figure 1 presents a simple system for performing both EELS and CL experiments that can be realized in a scanning (transmission) electron microscope, S(T)EM. A fast electron beam (1 keV to 30 keV for SEM, 40 keV to 300 keV for a STEM) ranging from a few nanometers to tenths of nanometers in diameter is scanned over the sample of interest. At each position of the beam, basically two different kinds of signals of interest can be detected. The first kind enables the recording of images of the sample: the high angle annular dark-field (HAADF) signal is roughly proportional to the projected mass under the beam, and the secondary or backscattered electron signals are related to the surface structure. The second kind enables the formation of spectral images (i.e., images with a spectrum in each pixel).Reference Jeanguillaume and Colliex14 The EELS signal is related to the energy lost by an electron through its interaction with a given sample. If the energy lost is in the near infrared/visible/ultraviolet (IR-vis-UV) range, EELS gives useful information on the optical properties of the sample, although the main use of EELS in a STEM has been the study of nanoscale chemistry through the analysis of higher energy ranges (see References Reference Kociak, Stéphan, Walls and Colliex12 and Reference Egerton15). When the energy absorbed from the electron is re-emitted in the form of light, a CL spectrum can be measured and gives yet another set of useful information on the optical properties. It is worth noting that every image, either 2D or 3D, can be usually recorded in parallel, allowing a direct, nanometer scale correlation between the structure and the spectroscopic signal, which is a decisive advantage of these techniques for precisely comparing the structure/optical property relations. While less widespread, another related setup where filtered images rather than spectra are acquired allows one to perform EELS spectral imaging.Reference Nelayah, Gu, Sigle, Koch, Pastoriza-Santos, Liz-Marzan and van Aken16, Reference Schaffer, Grogger, Kothleitner and Hofer17 Such a setup has been shown to have high performance for large imagesReference Kociak, Stéphan, Walls and Colliex12, Reference Nelayah, Gu, Sigle, Koch, Pastoriza-Santos, Liz-Marzan and van Aken16 (see Reference Reference Schaffer, Kothleitner and Grogger18 for a relevant review).
Spectral imaging of optical excitations in a scanning (transmission) electron microscope (STEM). Schematic of a STEM fitted with an electron energy-loss spectroscopy (EELS) spectrometer and a cathodoluminescence (CL) detection system. Note: CCD, charge-coupled device; PM, photo-multiplier.

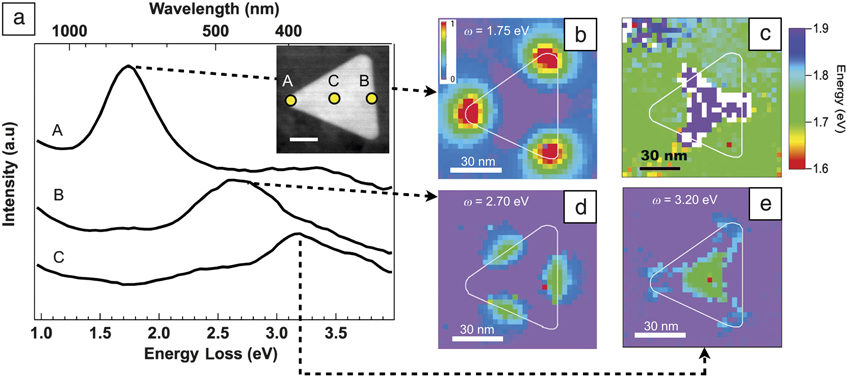
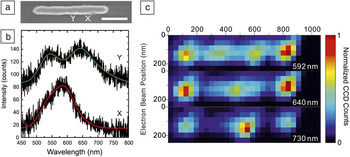
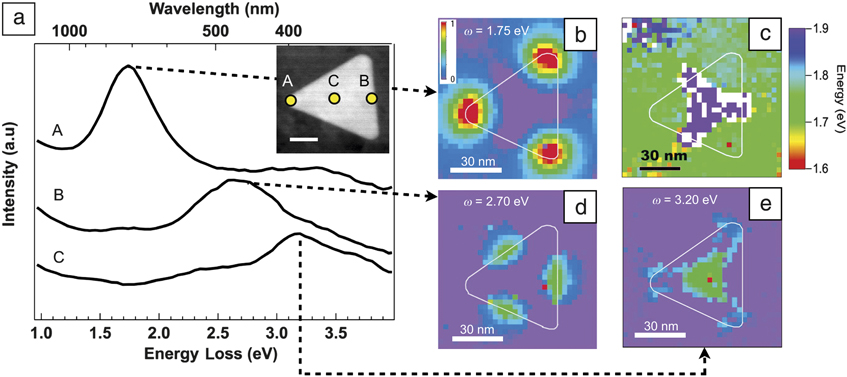
Figure 2a shows the capabilities of the spectral imaging EELS technique for mapping plasmons. (Figure 3a–b gives similar results in the case of CL on a gold nanoantenna.Reference Vesseur, de Waele, Kuttge and Polman19) In this example, a spectral image has been taken on a silver prism, the edge length of which is 70 nm,Reference Nelayah, Stéphan, Kociak, Garcia de Abajo, Henrard, Pastoriza-Santos, Liz-Marzan and Colliex8 as shown on the HAADF image. Examples of EELS spectra taken at positions A, B, and C show how well-separated resonances, spanning the near-infrared to ultraviolet regime, can be identified. As one spectrum is taken at each triangle position, and because each peak is well separated, one can automatically fit each of these peaks and plot the relevant information for each of them (see References Reference Nelayah, Stéphan, Kociak, Garcia de Abajo, Henrard, Pastoriza-Santos, Liz-Marzan and Colliex8, Reference Zagonel, Mazzucco, Tencé, March, Bernard, Laslier, Jacopin, Tchernycheva, Rigutti, Julien, Somguang and Kociak10, and Reference Kociak, Stéphan, Walls and Colliex12 for details). Hence, the energy peak position for the first excitation is plotted, showing an almost constant energy position value—similar results are observed for the other peaks. The intensity of these peaks changes dramatically over the triangle, and for each energy position, a different spatial distribution is seen. Such results are well reproduced by simulations using the boundary element method (see next section) of the EELS signal. It seems that EELS (and CL, see Figure 3a–b) provide a good image of a plasmon wave. The interpretation of such maps in these terms is described in the next section. It is worth noting that such a combination of spatial and spectral resolutions and signal to noise ratio could not be achieved with pure photon spectroscopy.
Nanoplasmonics with electron energy-loss spectroscopy (EELS). (a) EELS spectra acquired on a 70 nm silver nanoprism at positions indicated on the high-angle annular dark-field image (inset, scale bar 20 nm). Resonances spanning the near-IR/vis/UV (near infrared-visible-ultraviolet) range can be singled out at different positions of the beam on the nanoprism, despite the fact that the nanoprism is much smaller than the typical wavelength of light. (b–e) Maps of some physical parameters of interest extracted from a spectrum image taken on the same nanoprism. (b) Intensity and (c) energy maps of the first mode. Intensity maps for the (d) second and (e) third modes. Each mode has a well-defined energy (as clearly seen from (a) or (c) in the case of the first mode) with strongly different spatial distributions and can be identified as different orders of plasmonic standing waves (see References Reference Nelayah, Stéphan, Kociak, Garcia de Abajo, Henrard, Pastoriza-Santos, Liz-Marzan and Colliex8 and Reference Nelayah, Kociak, Stéphan, Geuquet, Henrard, de Abajo, Pastoriza-Santos, Liz-Marzan and Colliex37). Data adapted with permission from Reference Reference Nelayah, Stéphan, Kociak, Garcia de Abajo, Henrard, Pastoriza-Santos, Liz-Marzan and Colliex8.
Nanoplasmonics with cathodoluminescence. (a) Secondary electron map of a gold nanorod. Scale bar is 250 nm. (b) Spectra extracted from a spectrum image on the gold nanorod at points X and Y. Clear variations in the peak resonances are seen at different positions of the electron beam. (c) Intensity maps for the modes identified in (a). As for the electron energy-loss spectroscopy case (see Figure 2), the excitations can be identified as plasmonic standing waves. Adapted with permission from Reference Reference Vesseur, de Waele, Kuttge and Polman19. Note: CCD, charge-coupled device.

Linking electron and photon spectroscopies
In this section, we discuss the understanding of the EELS and CL spectra and their spatial distribution in the case where the optical phenomena can be accurately described by solving the Maxwell equations with known boundaries and constituent material dielectric functions.
For a long time, EELS has been considered as a way of measuring the optical properties of bulk materials (dielectric constants) or shown to be highly sensitive to surface plasmons.Reference Garcia de Abajo11 In situations characterized by high symmetry, such as spheres, planes, or cylinders, surface EELS signals have been shown to be proportional to polarizabilitiesReference Ferrell and Echenique20, Reference Kociak, Stéphan, Henrard, Charbois, Rothschild, Tenne and Colliex21 or Fresnel coefficients, but the equivalence with optics has been rarely noted until recently.Reference Taverna, Kociak, Charbois, Henrard, Stéphan and Colliex22–Reference Arenal, Stéphan, Kociak, Taverna, Loiseau and Colliex24 Moreover, although the theory of EELS was strong enough to provide useful simulation tools, such as the boundary element method (BEM)Reference García de Abajo and Aizpurua25 and the discrete dipole approximation (DDA),Reference Henrard and Lambin26 no universal theory linking EELS and optics existed. On the CL front, the pioneering work of Yamamoto not only pointed to the possibility of measuring polarizabilities, but also provided access to the electromagnetic field variation of a simple object (namely mapping the multipole distributions in a metal sphere) for the first time. However, the link between the spatial variations at given energies of EELS or CL was not recognized until recently,Reference de Abajo, Pattantyus-Abraham, Zabala, Rivacoba, Wolf and Echenique23 when it was realized that the photonic bandgap crystal eigenmodes could be mapped by EELS. As very similar results could be retrieved either theoretically or experimentally with pure optical spectroscopy, it was a first step toward showing that electron and photon spectroscopies were conceptually similar. The EELS signal was shown to be proportional to the density of electromagnetic states, a central quantity in near-field optics. This idea was extended to arbitrary structures for EELS (and CL in the case of non-absorbing media)Reference Garcia de Abajo and Kociak27 and later adapted to plasmonic structures in the case of CL.Reference Kuttge, Vesseur and Polman28 It was thus shown that EELS is very close to the electromagnetic local density of states (EMLDOS) projected along the electron trajectory (z) (zEMLDOS). Such a quantity, already used in the case of scanning near-field optical microscopy, finds a relatively simple interpretation in the case of non-dissipative structures. The case of a dissipative material is more cumbersome, as the very notion of eigenstates is ill-defined. Given the geometry and distribution of materials with various dielectric functions, the Maxwell equations give electrical field eigenfunctions along z for mode m,  at position r and energy ω and well-defined eigenenergies ωm. The zEMLDOS then yields:
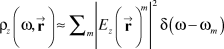
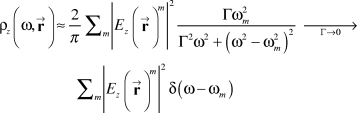
The zEMLDOS, and thus in a very good approximation, the EELS (and CL in the case of non-dissipative materials), is thus a map of the z-projected eigenfield of energy ωm. There are two points to be noted: First, such a consideration is a radical change of paradigm. Indeed, EELS has been, and still is, mainly used for characterizing material properties of samples of interest, while here, the proposed scheme links EELS to the electromagnetic field properties (as modified by the presence of structured materials). Second, apart from the vectorial form of the EMLDOS, a straightforward analogy can be made between scanning tunneling microscopy and spectroscopy (STM/STS) and STEM-EELS. The former aims at mapping eigenstates of the Schrödinger equation, while the latter aims at mapping eigenstates of the Maxwell equation.
In the case of a dissipative material, for which no well-defined eigenenergies exist, the correspondence between the EMLDOS and EELS is strictly establishedReference Garcia de Abajo and Kociak29 but needs some adaptation for CL.Reference Kuttge, Vesseur and Polman28 However, the eigenmode decomposition (Equation 1) is not well defined, and thus the physical interpretation of the EELS is not easy. Now, as already devised and detailed in the next paragraph, the expanding use of EELS and CL is related to mapping plasmons, excitations that are intrinsically dissipative. Also, experimental facts clearly argue for a description of plasmons in terms of eigenstates. This apparent contradiction can be solved by expressing the zEMLDOS for the field in the vicinity of a metallic particle, the dielectric constant of which is described within the Drude model in the case of small damping. In the Drude model, the dielectric constant is simply dependent on the bulk plasmon energy ωp and a damping factor Γ. The surface plasmons then arise at energies ωm (<ωp) and are damped by, essentially, Γ . In the case of low damping, an expression equivalent to Equation 1 is obtained despite the dissipation, as shown in Equation 2:Reference Boudarham30
Other innovative schemes using distributions of photon wavenumbersReference Rossouw, Couillard, Vickery, Kumacheva and Botton33 or polarizationReference Gu, Sigle, Koch, Ögüt, van Aken, Talebi, Vogelgesang, Mu, Wen and Mao34 have been used with success but without yet a formal justification.
Applications to the understanding of classical structures: Plasmons and photons
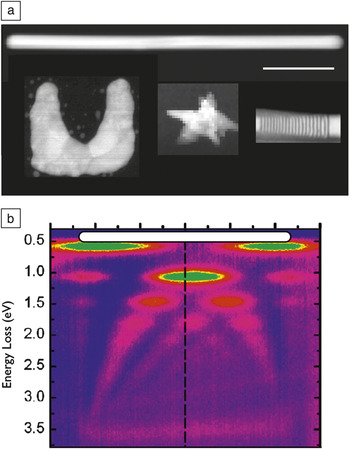
Knowing that spatially resolved EELS and CL are very good tools for mapping plasmons, what make them relevant over pure optical techniques? The optical techniques now have relatively good spatial resolution but also omnipotent control of polarization and phase that cannot be accessed by EELS, and only the polarization can be accessed by CL. Thus, it is not only the gain in spatial resolution that makes EELS/CL experiments much more suitable and the results probably more reliable below ∼100 nm, but it is also the possibility of knowing, for all precisely defined energies, the spatial variations of the related excitations and their link to the structure of the sample. In this respect, spectral imaging is a necessity. The first example is from the pioneering work of Yamamoto et al.,Reference Yamamoto, Araya and de Abajo4 who mapped the different multipole spatial distributions at different energies on a silver nanosphere of ca 50 nm using CL. It allowed for clear establishment of the energy/momentum (dispersion) relation. Such a description can be extended to less symmetric objects such as metallic nanowires, which are the simplest realization of nanoantennas.Reference Novotny and van Hulst35 From images such as those in Figure 3 (CL surface plasmon polariton mapping on a gold nanowire) and Figure 4 (EELS surface plasmon mapping), which can be established on nano-objects of various sizes (known with typically nanometric precision), dispersion relations can be determined. In these rather symmetric situations, this could also be done (with more difficulty) by optical techniques.Reference Dorfmüller, Vogelgesang, Weitz, Rockstuhl, Etrich, Pertsch, Lederer and Kern36 However, the EELS energy rangeReference Rossouw, Couillard, Vickery, Kumacheva and Botton33 spans the IR (≈2200 μm) to UV (>200 nm) regime all at once, which is difficult with pure optical means. On less symmetric systems, such as triangular silver nanoplatelets, the dispersion relation, compared to the structure (both edge length and thickness, which can be deduced from EELSReference Egerton15), can be established and reveals the exact nature of the underlying excitation, namely quasistatic stationary waves, which are fully symmetric in charge distribution with respect to the platelet’s horizontal plane of symmetry in the case of thin (typically less than 10 nm) triangles.Reference Nelayah, Kociak, Stéphan, Geuquet, Henrard, de Abajo, Pastoriza-Santos, Liz-Marzan and Colliex37 The excitations in the case of thick (>70 nm) and large (>500 nm) nanoparticles were recently described as being leaky whispering gallery modesReference Gu, Sigle, Koch, Ögüt, van Aken, Talebi, Vogelgesang, Mu, Wen and Mao34 (i.e., surface plasmons traveling on the edges of the nanostructures). More complex resonators can be explored, such as split ring resonators (SRRs) (see a scheme in Figure 5), which are the basic building blocks of many metamaterials.Reference Dolling, Wegener, Soukoulis and Linden38 Optical metamaterials are artificially structured materials with engineered electromagnetic properties that cannot be produced in natural materials. The archetype of such a property is the possibility to produce materials with a negative refractive index.
Typical applications of nanoscale electron optical spectroscopies. (a) A montage of different high-angle annular dark-field images of plasmonic nano-objects presented on the same scale. A quantum emitter stack (presented in Figure 7) is also displayed (lower right side) for comparison. The typical resonant wavelength (in vacuum) of the main modes of the structures are around 2200 nm for the silver nanorod,Reference Rossouw, Couillard, Vickery, Kumacheva and Botton33 1200 nm for the U-shape, lithographied silver split ring resonators (SRRs),Reference Boudarham, Feth, Myroshnychenko, Linden, García de Abajo, Wegener and Kociak39 and 890 nm for the gold nanostar,Reference Mazzucco, Stéphan, Colliex, Pastoriza-Santos, Liz-Marzan, Garcia de Abajo and Kociak44 much larger than the plasmon wavelength and even greater than the signal localization. Scale bar = 100 nm. (b) Dispersion relation of the plasmonic stationary waves over a straight, chemically grown nanoantenna (silver nanorod). Such a dispersion relation can be taken in a few minutes over the infrared to ultraviolet range, which would be impossible with pure optical spectroscopy. The color scale code ranges from zero electron energy-loss spectroscopy (EELS) intensity (blue) to maximum EELS intensity (green). Adapted with permission from Reference Reference Rossouw, Couillard, Vickery, Kumacheva and Botton33.

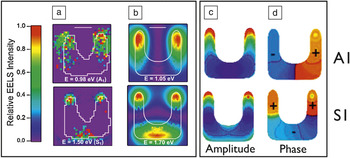
(a) Experimental intensity maps for the two first modes of a lithographed silver split ring resonator. The A1 mode is the first charge antisymmetric mode, and S1 is the first charge symmetric one. Scale bar is 50 nm. (b) Boundary element method simulated electron energy-loss spectroscopy (EELS) maps of the same modes. Experimental spatial variations are well reproduced by the simulations. The corresponding simulated eigencharges’ (c) amplitude and (d) phase are displayed. Color scale for the amplitude is zero for blue and maximum for red; the phase π (negative) is blue and 0 (positive) for red. These clearly reveal the charge stationary wave nature of the modes. Adapted with permission from Reference Reference Boudarham, Feth, Myroshnychenko, Linden, García de Abajo, Wegener and Kociak39.

Such small devices (typically well below half-wavelength dimensions) are intrinsically not emitting when operating in the visible range, and thus are rarely studied by CL. On the other hand, these are artificial materials that are usually fabricated by lithography techniques performed on a thick substrate that cannot be used with EELS. Schemes to adapt lithography to EELS experiments are described in References Reference Boudarham, Feth, Myroshnychenko, Linden, García de Abajo, Wegener and Kociak39 and Reference Koh, Fernandez-Dominguez, McComb, Maier and Yang40. Performing spectral imaging in individual SRRs is as important for the understanding of metamaterials as uncovering the energies and spatial distribution of electronic wave functions of individual atoms in real materials.Reference Zuo, Kim, O’Keeffe and Spence41, Reference Lemay, Janssen, van den Hout, Mooij, Bronikowski, Willis, Smalley, Kouwenhoven and Dekker42 This has been done, as shown in Figure 5. The excitations are stationary plasmonic waves, as confirmed by the simulations. The good agreement between the EELS experimental maps and BEM simulations allows us to consider that the simulations are a good representation of the experiments. Additional information can thus be extracted from the simulations, for example the phase of the excitations, not available from experimental EELS. In these split rings, the excitation spatial distribution is very close to that of a nanorod, but the energy dispersion clearly shows a deviation that can be attributed to the coupling between both legs of the structure.Reference Boudarham, Feth, Myroshnychenko, Linden, García de Abajo, Wegener and Kociak39 Finally, more complex distributions of resonators can be studied, in particular the coupling between nanoparticles.Reference Koh, Fernandez-Dominguez, McComb, Maier and Yang40, Reference Chu, Myroshnychenko, Chen, Deng, Mou and Garcia de Abajo43 One open question in coupled nanoparticles is the strength of the field in the gap between two particles, for the so-called bright mode—a dipolar mode that easily couples to free space light, per opposition to quadrupolar modes that hardly couple to light. As this mode couples to light, it has primarily an electrical eigenmode that is polarized along the direction linking the two particles, which, in practice, is perpendicular to the electron beam path (z). As the EELS and CL are close to the zEMLDOS, they will display zero intensity in the gap of the dimer and cannot be used efficiently for such studies.
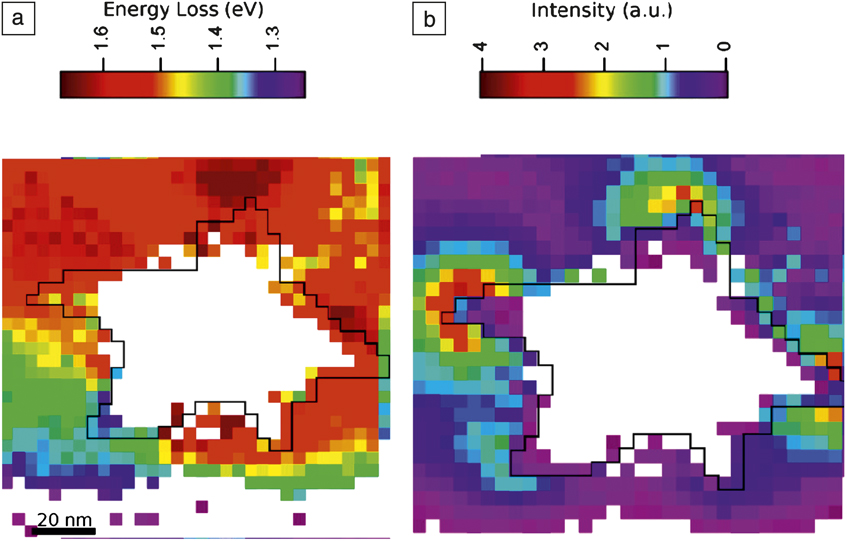
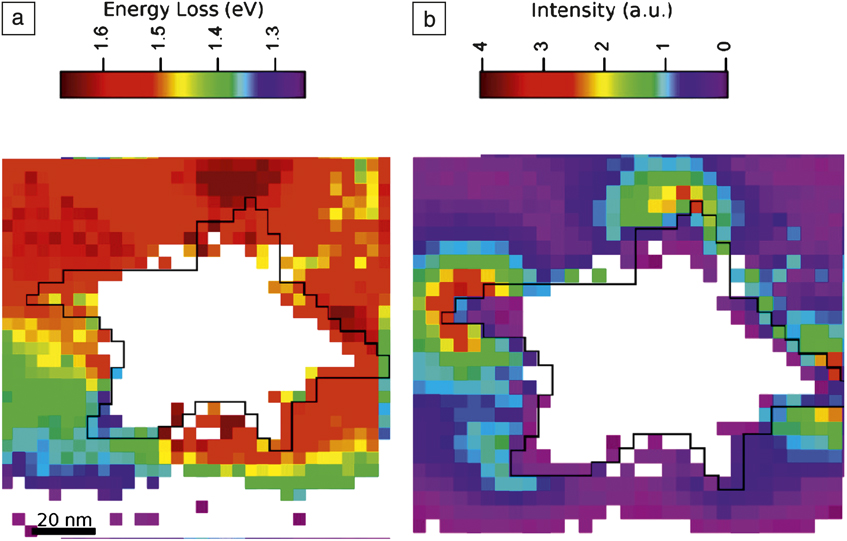
Spectral imaging EELS is also very well adapted to the study of plasmons at the scale of a few nanometers. Figure 6 shows an example of the energy position and intensity distribution of the EELS signal over a 100 nm diameter gold nanostar. It is striking to note that the plasmons not only peak on the tips, but their energies depend on which tip they are located on. This means that they are localized on a very short scale, much smaller than the wavelength and even much smaller than the whole metallic structure. This is in great contrast to the previous examples where, although the intensity peaked obviously at maxima of the oscillations, the excitations were delocalized over the entire object size—several hundreds of nanometers. This high spatial localization, analyzed in detail in Reference Reference Mazzucco, Stéphan, Colliex, Pastoriza-Santos, Liz-Marzan, Garcia de Abajo and Kociak44, can be attributed to the loss of spatial coherence between different tips linked together by a core larger than the optical skin depth (i.e., the typical distance over which the electromagnetic field is screened in a metal), thus impeding cross-talk between oscillations of two tips. Such effects, impossible to directly study with full optical methods,Reference Hao, Nehl, Hafner and Nordlander45 have implications on actual surface-enhanced Raman spectroscopy activity of these nanostars.Reference Rodriguez-Lorenzo, Alvarez-Puebla, Pastoriza-Santos, Mazzucco, Stéphan, Kociak, Liz-Marzan and de Abajo46
Electron energy-loss spectroscopy (EELS) mapping of the plasmonic tip modes of gold nanostars. (a) Energy position and (b) intensity of the tips modes of a nanostar. While each tip exhibits an enhanced EELS signal, their energies are different, even when separated by much less than the equivalent wavelength of light in vacuum. Adapted with permission from Reference Reference Mazzucco, Stéphan, Colliex, Pastoriza-Santos, Liz-Marzan, Garcia de Abajo and Kociak44.
Finally, although the spatial resolution needed is much less stringent than the one already shown for plasmons, it is worth emphasizing the relevance of using CLReference Takeuchi and Yamamoto47 and EELSReference de Abajo, Pattantyus-Abraham, Zabala, Rivacoba, Wolf and Echenique23, Reference Cha, Yu, Smith, Couillard, Fan and Muller48 for the analysis of photonic and plasmonic bandgap crystals and their defects.
Mapping of the emission of quantum emitters
Up to here, the problems considered have involved changes in optical properties of nanoparticles linked to a change in boundary conditions of the Maxwell equations. However, for various applications (LEDs, lasers, photodetectors), engineering the optical properties of semiconductors is commonly done by taking advantage of quantum confinement (namely changes in the Schrödinger equation boundary conditions). Studying such systems requires the knowledge of the structural properties down to the single atomic layer and of their optical properties down to the nanometer scale. In this regard, EELS combined with high-resolution imaging could be considered a natural solution. However, EELS suffers from genuine limitations: the energy resolution is limited, both because of technical issues (non-monochromaticity of the electron gun) and fundamental ones. It is known that the absorption signals such as EELS is larger than the related luminescence, and the size of the delocalized signalReference Gu, Sigle, Koch, Nelayah, Srot and van Aken49 is usually much larger than the size of individual nanostructures.Reference Couillard, Kociak, Stéphan, Botton and Colliex50 On the other hand, CL has a longstanding track record of mapping semiconductor emissions in bulk materials.Reference Strunk, Albrecht and Scheel6 It has been recently adapted to smaller structures and in particular with some success to semiconducting nanowires,Reference Jahn, Ristic and Calleja7 but without the relevant spatial resolution to access individual quantum confined structures. However, the application of CL at small scales has been limited by the weak collection efficiency of the commercial CL instrument and by the belief that the photon generation mechanism was highly delocalized in nature. This mechanism is often caused by charge carrier diffusion: electron-hole pairs at all energies are generated at the electron beam impact position. They migrate over their diffusion length and may recombine at various places with an emission energy related to the properties of the material at the recombination position rather than at the position of the electron beam.
Recently, using a high-throughput, dedicated STEM CL system, Zagonel et al.Reference Zagonel, Mazzucco, Tencé, March, Bernard, Laslier, Jacopin, Tchernycheva, Rigutti, Julien, Somguang and Kociak10 showed the possibility of singling out the emission wavelength of individual quantum discs (QDs) of nanometer sizes and spaced a few nanometers apart. They also showed the possibility of correlating this optical information to the size of the QDs measured with monolayer precision, opening the possibility to characterize quantum confined systems at their relevant length.
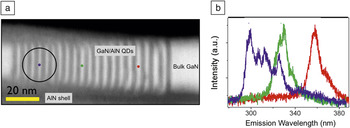
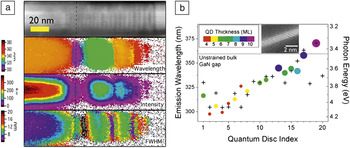
Figure 7 presents the output of a CL spectral imaging experiment on a stack of GaN/AlN cylindrical quantum discs embedded in a GaN/AlN nanowire. Spectra clearly display well-defined peaks appearing at different wavelengths for different electron beam positions. As a full spectrum with sometimes several peaks is taken at each pixel (typically 1 nm step size), the information is rather rich, and a first possibility is to map the wavelength position, the intensity, and the full width at half maximum of the most intense peak in each spectrum (Figure 8). The wavelength position map displays clear areas of constant values, while the intensity map clearly shows variations along and perpendicular to the wire direction. Some of this information can be directly related to an individual quantum well position (white contrast in the HAADF). A step further in the analysis can be done by using the full spectral-spatial information contained in a spectrum imageReference Kociak, Stéphan, Walls and Colliex12 and is discussed in detail in Reference Reference Zagonel, Mazzucco, Tencé, March, Bernard, Laslier, Jacopin, Tchernycheva, Rigutti, Julien, Somguang and Kociak10. The main output is that the emission wavelength of any quantum disc, as small as four monolayers, can be singled out even if the next one is less than 4 nm away. Here, it is worth noting that charge carrier diffusion, which usually broadens the CL spatial resolution in a bulk material, is severely reduced in quantum confined heterostructures and has been proven not to limit the spatial resolution in the present case.Reference Zagonel, Mazzucco, Tencé, March, Bernard, Laslier, Jacopin, Tchernycheva, Rigutti, Julien, Somguang and Kociak10
Cathodoluminescence spectral imaging of a stack of individual quantum emitters made up of GaN in AlN quantum discs (QDs) in a scanning transmission electron microscope. (a) High-angle annular dark field (HAADF) of a typical nanowire with embedded QDs. GaN appears brighter, AlN darker. The circle shows the best spatial resolution reported in a scanning electron microscope,Reference Jahn, Ristic and Calleja7 and the small colored spots show the typical probe size in the presented results. (b) Spectra extracted at positions noted in (a) from spectrum images. Adapted with permission from Reference Reference Zagonel, Mazzucco, Tencé, March, Bernard, Laslier, Jacopin, Tchernycheva, Rigutti, Julien, Somguang and Kociak10.

(a) Two-dimensional map extracted from the spectrum image of the principal emission peaks in a quantum emitter structure, featuring (from top to bottom) the high-angle annular dark field (HADDF) image, wavelength position, intensity, and full width at half maximum (FWHM) of the most intense peak. A direct correlation between the structure (HAADF) and some emission properties can be seen for some discs (e.g., the dashed line). (b) Using a systematic analysis of all data in the spectrum image (see Reference Reference Zagonel, Mazzucco, Tencé, March, Bernard, Laslier, Jacopin, Tchernycheva, Rigutti, Julien, Somguang and Kociak10 for details), every emission line can be singled out and attributed to a given quantum disc (QD) indexed from its position with respect to the left of the image. The QD emission wavelength can then be compared to its size, measured in monolayers (see inset). In addition, the emission wavelength dependence on the position of the QD, given by its index and thus its position along the nanowire, can be evaluated.

Comparison with their actual thickness measured in monolayers (see Figure 8b) showed dispersion with the size, as expected for quantum confinement. In addition, an effect of the local environment (pressure, local doping) can be seen. Indeed, for the same thickness and same environment, the theory predicts the same emission wavelength, which is not the case for different QDs with the same thickness yet different position along the nanowire, and thus different direct environment. It is worth noting that such measurements, made at the relevant scale, challenge current state-of-the-art simulation techniques because such complex structures are difficult to simulate.
Conclusion and outlook
This article has shown how powerful electron-based optical techniques and simulation tools can be used in unraveling the physics and optical properties of nano-objects, should they be classical or quantum in nature. In comparing both techniques, it is worth noting that by definition, all inelastic effects are reflected in energy loss events. Almost all electrons that have been inelastically scattered can be detected by electron energy-loss spectroscopy (EELS), the typical angle of inelastic scattering (tens or hundreds of microradians) being much smaller than the detection angle. Nowadays, with the availability of very high sensitivity EELS detection systems, this means that detecting an EELS signal is a very efficient process. In contrast, cathodoluminescence (CL) is a second-order process, and if the quantum efficiency is weak, the CL signal will also be weak. Moreover, the collection efficiency is usually very poor, because the space available to place a high numerical aperture collection system is small between the specimen and the objective lens pole piece. In the case of signals that have similar spectral profiles in EELS and CL, and for which the emission quantum efficiency is weak—typically plasmonic signals in small nanoparticles—EELS is always the technique of choice if energy resolution or access to the polarization is not of concern. On the other hand, for signals with sharp peaks and high quantum efficiency systems, for which energy resolution is relevant, CL may take the lead.
These techniques, which have been recently adapted to the study of standard samples for plasmonic, photonic, or quantum systems, will certainly play a decisive role in the understanding of new nano-optical devices. It should also be noted that the next generation of scanning transmission electron microscopes, encompassing both monochromators and aberration correctors, will allow us to obtain EELS spectra with very small influence of the zero loss signal (which usually obscures the signal at low energy loss), high spectral resolution, and still a high signal-to-noise ratio.Reference Rossouw, Couillard, Vickery, Kumacheva and Botton33 This is already popularizing the use of EELS for nano-optics.
However, the experiments described here are limited to linear and classical nano-optics. A few proposalsReference Garcia de Abajo and Kociak27 and the experimental realization of part of one of themReference Barwick, Flannigan and Zewail51 benefit from the combination of the spatial resolution of the electron beam and the high spectral resolution and the high intensity provided by a laser. Combining both of them clearly paves the way to another exciting field: non-linear and quantum nano-optics with fast electrons.
Acknowledgments
M.K. acknowledges all of the STEM group collaborators and students participating in the emergence of this topic in the group over the years, and in particular O. Stéphan, C. Colliex, L. Zagonel, J. Nelayah, S. Mazzucco, G. Boudarham, A. Gloter, and M. Tencé. He acknowledges useful collaboration and discussions with L. Henrard and coworkers, L. Liz-Marzan and coworkers over the years, and more recently the teams of M. Tchernycheva and M. Wegener. F.J.G.A is thankful to the groups of Orsay (C. Colliex), Vigo (L. Liz-Marzan), AMOLF (A. Polman), and Southampton (N. Zheludev) for many enjoyable interactions over the last years. W. Sigle, G. Botton, and the team of A. Polman are gratefully acknowledged for giving access to preprints and/or giving the right to reproduce their work. The authors acknowledge financial support from the European Union under the Framework 6 program under a contract for an Integrated Infrastructure Initiative. Reference 026019 ESTEEM, and French ANR (1010 BLAN 1016 ”HYNNA”) support.