Introduction
Attention deficit hyperactivity disorder (ADHD) is a prevalent and morbid neurobiological disorder estimated to affect up to 10% of children (Faraone et al. Reference Faraone, Sergeant, Gillberg and Biederman2003) and 5% of adults worldwide (Faraone & Biederman, Reference Faraone and Biederman2005). It is associated with a wide range of impairments across the life-cycle, including high rates of psychiatric co-morbidity, neuropsychological deficits, educational and occupational under-attainment, substance use disorders and smoking, accidents and injuries and premature death (Faraone et al. Reference Faraone, Asherson, Banaschewski, Biederman, Buitelaar, Ramos-Quiroga, Rohde, Sonuga-Barke, Tannock and Franke2015). Because the diagnosis of ADHD is entirely based on the clinical assessment of largely subjective symptoms, there has been a great interest in the field in validating an objective diagnostic test.
Several recent studies suggest that the pathophysiology of ADHD is related to abnormal brain activity at the functional network level (reviewed in Konrad & Eickhoff, Reference Konrad and Eickhoff2010). Anatomical, physiological, and clinical evidence indicates that functional networks spanning spatial and temporal scales form a critical feature of information processing in the brain (Bullmore & Sporns, Reference Bullmore and Sporns2009). It has been suggested that the coordination of such widely distributed brain activity is a function of the synchronization of network potential oscillations (Engel et al. Reference Engel, Fries and Singer2001; Buzsaki & Draguhn, Reference Buzsaki and Draguhn2004). This synchronization seems to govern the effective strength of connections between critical regions in the brain, providing a mechanism for the generation of diverse functional networks (Fries, Reference Fries2005; Makris et al. Reference Makris, Biederman, Valera, Bush, Kaiser, Kennedy, Caviness, Faraone and Seidman2007).
Our team developed Brain Network Activation (BNA) analysis (Shahaf et al. Reference Shahaf, Reches, Pinchuk, Fisher, Ben Bashat, Kanter, Tauber, Kerem, Laufer, Aharon-Peretz, Pratt and Geva2012; Reches et al. Reference Reches, Kerem, Gal, Laufer, Shani-Hershkovitch, Dickman and Geva2013a , Reference Reches, Laufer, Ziv, Cukierman, McEvoy, Ettinger, Knight, Gazzaley and Geva b , Reference Reches, Levy-Cooperman, Laufer, Shani-Hershkovitch, Ziv, Kerem, Gal, Stern, Cukierman, Romach, Sellers and Geva2014), which was shown to have potential diagnostic utility in ADHD (Shahaf et al. Reference Shahaf, Reches, Pinchuk, Fisher, Ben Bashat, Kanter, Tauber, Kerem, Laufer, Aharon-Peretz, Pratt and Geva2012). BNA is an EEG-event-related potential (ERP)-based tool that applies novel signal processing algorithm and network analysis methods to identify the dynamic spatio-temporal aspects of specific cognitive processes (Reches et al. Reference Reches, Laufer, Ziv, Cukierman, McEvoy, Ettinger, Knight, Gazzaley and Geva2013b ). The algorithm produces a display of qualitative BNA patterns as well as a quantitative similarity index (BNA score) providing information on cortical connectivity. BNA methodology has previously been shown to have potential diagnostic utility in ADHD (Shahaf et al. Reference Shahaf, Reches, Pinchuk, Fisher, Ben Bashat, Kanter, Tauber, Kerem, Laufer, Aharon-Peretz, Pratt and Geva2012) in a pilot feasibility study consisting of 13 adults with ADHD and 13 control subjects using a task to assess inhibitory control (Go/NoGo task). Here we reexamine the diagnostic accuracy of an advanced version of the BNA analysis tool, which utilizes a method termed Spatio Temporal Parcellation (STEP) for feature extraction (see Stern et al. Reference Stern, Reches and Geva2016). This new method indexes the efficiency of neuronal network activity for an individual subject against a control group (see details below), and allows for the examination of functional networks impairments in ADHD. We hypothesized that this advanced BNA measure would have diagnostic utility in ADHD.
Method
Subjects
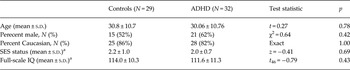
ADHD subjects were 34 right-handed outpatients (13 females, mean age 30.06 ± 10.76 years), recruited from the Clinical and Research Program in Adult ADHD at the Massachusetts General Hospital, and advertising in the local media. ADHD subjects met full criteria for the diagnosis of DSM-IV ADHD, with onset of symptoms in childhood and persistence of impairing symptoms into adulthood, as determined by a clinical evaluation supplemented by the ADHD module of the K-SAD-E (Orvaschel, Reference Orvaschel1994) completed by a study clinician with expertise in the diagnosis and treatment of adults with ADHD. Clinicians also completed the HAMA (Hamilton, Reference Hamilton1959) and HAMD (Hamilton, Reference Hamilton1960) with ADHD subjects to rule out active symptoms of depression and anxiety. Any co-morbidity as assessed through the SCID-IV (First et al. Reference First, Spitzer, Gibbon and Williams1997) was exclusionary. Patients did not receive pharmacological treatment for ADHD for at least 1 week before study entry. Controls were 29 right-handed healthy adults (14 females) of comparable age (30.8 ± 10.72 years) who did not meet the criteria for ADHD, as determined by a clinical evaluation supplemented by the ADHD module of the K-SAD-E (Orvaschel, Reference Orvaschel1994) completed by a study clinician with expertise in the diagnosis and treatment of adults with ADHD. Any other psychiatric ndisorder as assessed through the SCID-IV (First et al. Reference First, Spitzer, Gibbon and Williams1997) was also exclusionary. Social class was based on the two-factor (occupation and education) Hollingshead sytem ranging for 1 (highest) to 5 (lowest) (Hollingshead, Reference Hollingshead1975) (for full information on sociodemographic characteristics, see Table 1a ). All study procedures were approved by the Massachusetts General Hospital Institutional Review Board and all subject signed a written consent before participation.
Sociodemographic characteristics of control and attention deficit hyperactivity disorder (ADHD) subjects

SES, Socioeconomic status.
a Data not available for all subjects.
SES: Controls (N = 21), ADHD (N = 17); Full-scale IQ: Controls (N = 28), ADHD (N = 20).
Tasks and stimuli
We selected the visual Go-NoGo task since it is targeting response inhibition, executive functions and sustained attention (Simmonds et al. Reference Simmonds, Pekar and Mostofsky2008). In this task, a frequent ‘Go’ stimulus, which occupies 80% of all trials, requires the subject to perform a motor response each time it appears on the screen. A rare ‘NoGo’ stimulus (20% of all trials) requires the subject to refrain from responding.
Subjects were seated in a dimly lit room, at a distance of 70 cm from a 17-inch CRT screen, and were instructed to respond to the Go stimuli using a dedicated response box (Psychological Software Tools Inc., USA). The Go stimuli in our paradigm consisted of white English alphabetic letters (B, C, D, E, F, G) appearing in equal proportions, and the NoGo stimulus was a white X symbol. The stimuli were presented on the center of a black background computer screen for 150 ms and were located between two vertical white lines, which remained constant on the screen throughout the block. The ISI varied randomly between 1000 and 3000 ms in 250-ms steps. Four blocks of 90 stimuli each were presented and the duration of the task was approximately 12 min. A 10 trial practice block was run prior to the experimental session. The experiment was run using the ePrime software (Psychological Software Tools Inc.).
Behavioral analysis
Trials in which the reaction times (RTs) were less than 150 ms (an accepted plausible human RT) and greater than 4 s.d. from the mean (i.e. the mean for the condition) were removed from analysis. We computed two accepted task-related measures: RT for the Go trials and accuracy. For accuracy, we calculated a global error rate including the two types of possible errors in the Go-NoGo task: commissions (key presses in the NoGo stimulus) and misses (failure to respond to the Go stimulus). This error index is commonly used and considered to reflect the quality of inhibition of response (Greimel et al. Reference Greimel, Wanderer, Rothenberger, Herpertz-Dahlmann, Konrad and Roessner2011; Pandey et al. Reference Pandey, Kamarajan, Tang, Chorlian, Roopesh, Manz, Stimus, Rangaswamy and Porjesz2012).
EEG recording and pre-processing
EEG was recorded at a sampling rate of 250 Hz from 64 Ag/AgCl active electrodes (BioSemi Active Two system, The Netherlands) arranged on an electrode cap according to the international 10/20 system. In addition to the 64 channels, four electrodes were used for eye-movement monitoring: two were placed above and below the right eye, and the other two were placed at the outer canthus of both eyes. Last, two electrodes were placed on the mastoid bones behind the ears for offline re-referencing. After recording, EEG data were re-referenced to the linked mastoids, and bandpasse filtered between 0.5 to 30 Hz with a zero-phase lag FIR filter implemented in the EEGLAB toolbox for Matlab. Then, data underwent an independent component analysis (ICA) for blink artifact removal. Independent components representing blinks were identified and subtracted from the data (Delorme & Makeig, Reference Delorme and Makeig2004). Before running the BNA analysis, all datasets passed a final data quality (DQ) procedure designed to detect noisy EEG files that cannot go through further analysis, as accepted in EEG studies (see Appendix A for DQ details).
ERP and BNA analysis
After preprocessing, each EEG datafile was bandpass filtered into three distinct bands: δ (0.5–4 Hz), θ (3–8 Hz) and α (7–13 Hz).Each of these three bands is then epoched between −200 and 1200 ms around the stimulus trigger of each experimental condition, to create ERPs per frequency band. Trials with errors (misses and commissions) as well as trials with too low or too high RTs as indicated above (see Behavioral analysis) were rejected from the data prior to ERP averaging. Overall, 4.69% of trials were rejected due to behavioral errors or RT.
BNA analysis was carried out on the ERP responses that involved both the NoGo and the Go visual cues. The aim of the advanced BNA is producing a set of event-related microstates for each subject, each of which is characterized by a frequency band (δ, θ, α – see above), a scalp topography and a temporal activation range. These microstates are spatio-temporal parcells (hereafter ‘STEP’) of the ERP activity. A spatio-temporal ERP peak was defined as a local maximum of the amplitude. Each peak could therefore be described with basic attributes: amplitude, time, and spatial location (left-right and posterior-anterior). The goal of this segmentation stage was to reduce the subject's entire brain activity into a set of STEPs. After STEPs were defined for each subject in each frequency band, clustering was used to create an averaged network. The goal of clustering was to discover a set of group STEPs that represented a spatio-temporal event common to the group.
Finally, each STEP extracted from subjects’ ERPs is scored compared to the group's averaged STEP, similarly to the BNA method previously published. Scores are given for each subject on the three STEP characteristics mentioned above: amplitude, timing and topography. Subsequently, for assessing the diagnostic utility of the advanced BNA algorithm, the various spatial and temporal BNA scores were used as input to the Support Vector Machine (SVM) for a supervised classification, based on which the ADHD-controls separation is done. An SVM is one of the most commonly used machine learning techniques. It is aimed in processing big sets of features (i.e. the various network scores for each subject, in our case) of the two labeled population types (i.e. ADHD and controls) and model the best way to use these data in order to differentiate between the two populations, by selecting and weighting the features in the most adequate way. A more detailed description of the advanced BNA methodology can be found in Appendix B. For a more detailed description of the SVM and of the feature reduction techniques that were used, see Appendix C.
Ethical standards
The authors assert that all procedures contributing to this work comply with the ethical standards of the relevant national and institutional committees on human experimentation and with the Helsinki Declaration of 1975, as revised in 2008.
Results
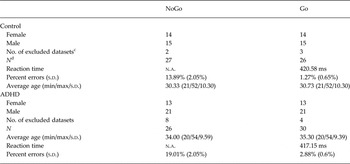
The sociodemographic and clinical characteristic of the sample are shown in Tables 1a and 1b . As shown Table 1a , there were no sociodemographic differences between the groups. Only subjects that met our a priori pre-defined EEG signal quality criteria were included (for further details see Appendix A, ‘The data quality criteria’). After removing subjects from analysis from each of the two experimental conditions based on these data quality criteria, the final sample included 26 healthy subjects and 30 ADHD subjects in the Go condition, and 27 healthy subjects and 26 ADHD subjects in the NoGo condition.
Age a and sex b of control and attention deficit hyperactivity disorder (ADHD) participants in the visual Go/NoGo task

None of the χ2 tests were significant (p > 0.05).
a None of the two-sample t tests for age between groups were significant (p > 0.05).
b χ2 tests of independence were performed to examine the relation between gender and group type.
c Number of datasets excluded from the study per group per task based on the signal quality criteria (see text for details).
d Total number of subjects included in the study per group per task.
Behavioral results
Only two trials in two different subjects were rejected for being too short, and 36 trials were rejected for being too long (see Method section for criteria), totaling 0.22% of trials rejected.
The global error rate for the ADHD group was significantly larger than the error rate of the control group (p = 0.02) (two-tailed) (5.8% ± 0.66% v. 3.6% ± 0.62%, respectively). When examined apart, however, misses and commissions did not differ significantly between the groups, although they both showed trends with ADHD having more errors than the controls (percent misses – ADHD: 2.88% ± 0.6%; Healthy: 1.27% ± 0.65%; p = 0.062 two-tailed; percent commissions – ADHD: 19.01% ± 2.05%; Healthy: 13.89 ± 2.05%; p = 0.084 two-tailed).
RTs for the Go trials did not differ significantly between the groups (417.15 ms for the ADHD group v. 420.58 ms for the controls, p = 0.6). We also assessed RT variability, with the idea that ADHD patients have momentary drops in performance throughout the test that increase the variability of their RTs. This analysis yielded a trend in the expected direction, however this trend was not statistically significant (80.9 ± 3.37 for the ADHD group v. 72.73 ± 3.62 for the controls, p = 0.1 two-tailed).
BNA results
Of the three score types from the advanced BNA algorithm (amplitude, timing, and topography), classification accuracy in terms of area under the curve (AUC) was the highest for the topography scores for both Go and NoGo results. As detailed further down, the NoGo condition yielded the best results for the repeated cross-validation test (see Appendix C) among the two conditions.
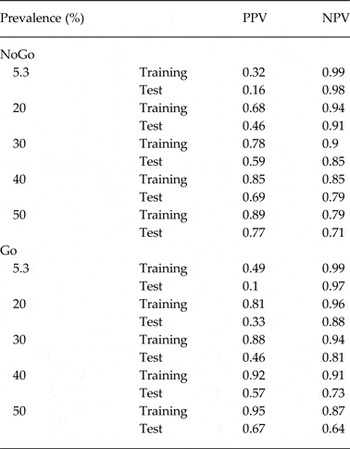
In the NoGo condition, the Topography Correlation Coefficient Aligned (TCCA) score yielded a training AUC of 0.84, sensitivity of 0.76, specificity of 0.91, positive predictive value (PPV) of 0.90 and test negative predictive value (NPV) of 0.80. In the Go condition the TCCA score yielded a training AUC of 0.92, sensitivity of 0.86, specificity of 0.95, PPV of 0.93 and test NPV of 0.85. As explained in Appendix C, we also performed a repeated cross-validation procedure (10 iterations of 10-fold cross validation), to probe how reliable the classification would be on test data. Test values separating patients from controls, especially in the NoGo condition [NoGo: sensitivity = 0.68 ± 0.05 (s.d.); specificity = 0.80 ± 0.06 (s.d.); PPV = 0.77 ± 0.06 (s.d.) and NPV = 0.72 ± 0.04 (s.d.); Go: sensitivity = 0.62 ± 0.04 (s.d.); specificity = 0.69 ± 0.07 (s.d.); PPV = 0.69 ± 0.05 (s.d.) and NPV = 0.65 ± 0.04 (s.d.)]. The PPV and NPV values reported here were assessed with the sample prevalence, which is roughly 50%. We note that these two values are highly sensitive to disease prevalence in the tested environment. As the prevalence drops, PPV values decrease and NPV values increase. Since the real prevalence of ADHD varies across clinics, corrected PPV and NPV estimates can be computed knowing the clinic's base rate of disease, under the assumption of unchanged sensitivity and specificity. Table 2 presents estimates for corrected PPVs and NPVs for prevalence values of: 5.3% (an estimated avegaed prevalence in the general population (see Polanczyk et al. Reference Polanczyk, de Lima, Horta, Biederman and Rohde2007), 10%, 20%, 30%, 40% and 50%. Corrected values were computed using the below equations, which derive from the confusion matrix (see e.g. Gambino, Reference Gambino1997):
 $${\rm PPV} = \displaystyle{{{\rm se} \times {\rm prev}} \over {{\rm se} \times {\rm prev} + (1 - {\rm sp}) \times (1 - {\rm prev})}},$$
 $${\rm NPV} = \displaystyle{{{\rm sp} \times (1 - {\rm prev})} \over {(1 - {\rm se}) \times {\rm prev} + {\rm sp} \times (1 - {\rm prev})}}.$$
Estimates of positive predictive values (PPV) and negative predictive values (NPV) computed based on the observed sensitivity and specificity for Go and NoGo classifications

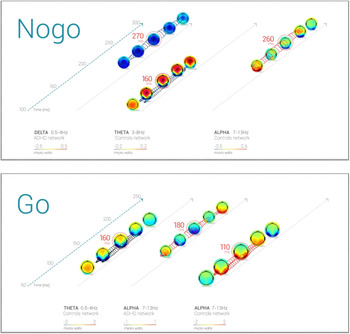
In the NoGo condition, the main contributors were: (1) a posterior θ N1; (2) an α central P2; and, importantly, (3) a central δ N2 (see Fig. 1). In the Go condition, the three most contributing features to the overall classification were: (1) α P1 component of the ERP distributed over the occipital scalp, slightly right-dominated; (2) a θ occipital N1, slightly left-dominated; and (3) an α posterior N1 (see Fig. 1). The best contributors to the ADHD-controls separation was the N2 response to the NoGo condition, which is known to represent inhibition of response. Furthermore, as can be seen in Fig. 1, the relative contribution of the N2 STEP to the overall classification is the greatest among all the contributing features, as defined by the normalized coefficients of the classifier.
Main contributing features to the classification. The figure depicts the Spatio Temporal Parcellation (STEP) of activity having the biggest contributions to the classification, as determined by the Support Vector Machine feature-selection procedure. Each STEP represents an encapsulated EEG activity at a specific frequency band, evolving during a specific time frame, and having a specific spatial distribution. The activation itself does not include the whole scalp topography, but is confined to the activity inside the chain of contours seen in and between the topographies (see Appendix B for the procedure of defining activity boundary). The peak latency of each STEP, from where values were extracted for the classifier, is marked with a circle around the relevant topography. Frequency band is depicted on the x-axis, time from stimulus onset is depicted on the inclined z axis. (a) NoGo condition; (b) Go condition. Note that the color range differs between frequency bands and capsule networks, for a better visualization (given that the values of activity used for the classification were projected onto the feature space and then normalized, there is no direct comparison of activation strengths).

In order to further test the contribution of the physiological EEG data to ADHD classification over merely the behavioral results of the same subjects to the same visual Go-NoGo task, we calculated the receiver-operating characteristics (ROCs) of the behavioral results as well. Results of the ROC analysis of behavioral data showed that none of the behavioral measures assessed yielded a high discriminability in the ROCs. The AUC values for the different behavioral measures ranged between 0.43 to 0.67 (hit RT: AUC = 0.52; commission RT: AUC = 0.43; percent misses: AUC = 0.61; percent commission: AUC = 0.64; percent all errors combined: AUC = 0.67).
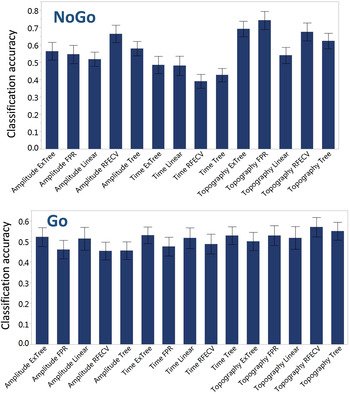
In order to further validate our selection of model, we turned to examine the distribution of the classification accuracy per subject across the 10 iterations of the classifier. As can be seen in Fig. 2, the mean classification accuracy, ranging between 0 and 1, was the highest for the selected topography score, with the FPR feature selection method (NoGo) and RFECV (Go), paralleling the reported AUC, sensitivity and specificity.
Comparing classification accuracy across all scores and feature reduction methods. The figure depicts the accuracy ratio averaged across subjects, for the 10 iterations of the classification. It can be seen that several models provide a visible separation between patients and control, but the topography score gives the best results among the classifiers [with the false positive rate (FPR) model in the NoGo condition, and the recursive feature elimination with cross-validation (RFECV) method in the Go condition].

Discussion
The main aim of the current study was to evaluate the diagnostic utility of an advanced BNA-based analysis as an objective supporting tool that can assist the clinician in obtaining more informed decisions in the process of ADHD diagnosis and management. Results showed that the advanced BNA algorithm used to identify neuronal activations associated with visual Go/NoGo tasks discriminated between ADHD and control subjects. As such, the BNA can complement the clinical evaluation with quantified neurological data of brain network activity. Furthermore, the very nature of the BNA methodology, which is based on a comparison of individual neural network activity to a reference normative group, allows for a constant development to improve its generalization across patient groups and enhance its clinical utility by refining the reference group characteristics. For example, reference networks can be created per gender (males and females apart), or for narrower age bins. Indeed, a recently published paper demonstrates preliminary evidence for clinical utility of BNA in the diagnosis of mild traumatic brain injury in young athletes using refined age bins such as 13- to 16-year-old patients (Kiefer et al. Reference Kiefer, Barber Foss, Reches, Gadd, Gordon, Rushford, Laufer, Weiss and Myer2015).
The feature reduction procedure maintained only a few main contributors to the actual classification from the large amount of individual spatio-temporal microstates (41 STEPs in the NoGo condition and 31 STEPs in the Go condition). Importantly, these major contributors largely overlap with well-established ERP components previously associated with ADHD. For example, studies of inhibitory processes in ADHD patients using tasks such as the Go/NoGo or the Stop Signal Task, reported atypical N1, P2, and N2 (Dimoska et al. Reference Dimoska, Johnstone, Barry and Clarke2003; Smith et al. Reference Smith, Johnstone and Barry2004; Johnstone et al. Reference Johnstone, Dimoska, Smith, Barry, Pleffer, Chiswick and Clarke2007; Groom et al. Reference Groom, Jackson, Calton, Andrews, Bates, Liddle and Hollis2008). These three ERP components were represented by the STEPs selected by our classifier in the NoGo condition to best differentiate patients from healthy controls, providing further validation to the advanced BNA tool.
Taken together, these results are consistent with the frontoparietal system dysfunction associated with ADHD (Cortese et al. Reference Cortese, Kelly, Chabernaud, Proal, Di Martino, Milham and Castellanos2012). They are also consistent with the role of posterior regions in sustaining attention (Fassbender & Schweitzer, Reference Fassbender and Schweitzer2006). These findings may also reflect ADHD-related deficits in motor output and response organization (Himelstein & Halperin, Reference Himelstein and Halperin2000) as well as deficits in inhibitory control (Hakvoort Schwerdtfeger et al. Reference Hakvoort Schwerdtfeger, Alahyane, Brien, Coe, Stroman and Munoz2012). Moreover, the activation patterns identified in each of the tasks identified are in accord with low-frequency activations in the δ-α range associated with the Go/NoGo task (Muller & Anokhin, Reference Muller and Anokhin2012). The distinct prefrontal clusters in each of the Go tasks described above were each co-activated with centro-parietal or fronto-central regions in accord with the role of the prefrontal cortex in cognitive control (Muller & Anokhin, Reference Muller and Anokhin2012).
While the advanced BNA algorithm is based on event-related activity analysis (ERP), it maximizes the information extracted from ERPs. It conjugates event-related activity in different frequency bands as well as in space, in addition to the traditionally peak and latency analysis. In the results presented here, for example, STEP activations representing the N2 component of the event-related activity can be seen in δ and in θ frequency bands at the same time, with slightly different scalp topographies.
The advanced BNA strength lies in its ability to score patients relative to a cohort of subjects with the same disorder. That is, scoring of subjects is done via comparison of individual brain activity with the clustered activity of the group. A classification cutoff can then be achieved, and can subsequently be used to assess the existence of a disorder in a new patient.
Interestingly, early components also comprised the ADHD NoGo network found by BNA in an auditory Go-NoGo task (Shahaf et al. Reference Shahaf, Reches, Pinchuk, Fisher, Ben Bashat, Kanter, Tauber, Kerem, Laufer, Aharon-Peretz, Pratt and Geva2012), showing differentiating features persist across different sensory modalities. In that study however, the NoGo N2 was less prominent than its relative contribution to classification in the current study, which is consistent with the N2 being larger in the visual modality than in the auditory modality (Nieuwenhuis et al. Reference Nieuwenhuis, Yeung and Cohen2004; Hakvoort Schwerdtfeger et al. Reference Hakvoort Schwerdtfeger, Alahyane, Brien, Coe, Stroman and Munoz2012).
Our findings need to be viewed in light of some methodological limitations. EEG-based methods such as the one presented here lack the ability to directly sample activity in sub-cortical regions. Because our sample was largely Caucasian and referred, our results may not generalize to community samples and other ethnic groups. Although our cross-validation methodology, complemented by a repeated cross-validation of 10 iterations, is considered sufficient to address overfitting, it would have been ideal to have had a separate sample for testing the cross-validated model.
Despite these considerations, results of this study suggest that the advanced BNA methodology can help differentiate between ADHD and healthy controls based on functional brain connectivity. Results also support a network-based approach to the study of ADHD.
Appendix A
The data quality (DQ) criteria
The purpose of the DQ procedure is to enable objective selection of individual EEG datasets with a good quality EEG to be included in the study. In this study two DQ measures were used. The first considers the variance across single trials and is the standard error (s.e.). The average s.e. value reflects the repeatability of a specific ERP time point across the single trials, i.e. the reliability of the ERPs. The second DQ measure was the signal-to-noise ratio (SNR) which reflects the strength of the ERP signal relative to baseline. Importantly, the DQ is computed for each trial type (experimental condition) apart. This is important since when considering the variability and repeatability of single-trials, one have to do so within the distribution of trials of the same type, as different conditions give ERPs with different shapes and different evoked potentials. This way of examining data quality per condition enhances the accuracy and sensitivity to noise, although it may result in a slightly different number of rejections across the examined conditions (i.e. Go and NoGo total N). Note, however, that unlike traditional ERP studies, the BNA does not compare Go to NoGo activity at any stage. Two independent models are run for the two conditions. This stems from the logic of the BNA method, according to which individual brain network activity for a certain cognitive function is compared to its normative model.
In order to obtain the s.e., the variance across the single trials was computed for each electrode and then normalized by the square root energy of the ERP. A smaller s.e. value indicates a higher quality EEG signal. A larger SNR value designates a higher quality signal. The decision whether to discard the data of a specific subject was based on a procedure that takes into account both thresholds. First, the subject was assessed based on the s.e. threshold. If the subject's data quality failed to meet the s.e. threshold, they were excluded from the study. However, if their data quality fell within the 90% and 95% confidence intervals of the s.e. measure distribution their data were compared against the SNR measure. To be included in the study the subject's data quality had to meet the SNR measure or fall within the 90% and 95% confidence intervals. In the latter case the subject's data was sent to review for further visual examination and final decision. This procedure was done before application of the STEP analysis in order to avoid a bias. For DQ, (see for example Reches et al. Reference Reches, Nir, Shram, Dickman, Laufer, Shani-Hershkovich, Stern, Weiss, Yarnitsky and Geva2016).
Appendix B
STEP analysis
The essence of the BNA analysis is the extraction of spectral, spatial, and temporal brain activation patterns common to a group of subjects, to which the brain activation of individual subjects may be compared. This is done in two main steps. First, we define a set of task-related functional microstate events across frequency bands and time-points, in all subjects composing the group, and then we cluster them in order to find the group's common characteristics. In a second step the individual subject events are matched to the group events, and various scores pertaining to the timing, amplitude and topography of the events are assigned to each subject (Makris et al. Reference Makris, Biederman, Valera, Bush, Kaiser, Kennedy, Caviness, Faraone and Seidman2007).
After pre-processing, event-related activity is computed for the main frequency bands (δ: 0.5–4 Hz, θ: 3–8 Hz and α: 7–13 Hz). In each band, events are defined in time and space by finding local peaks of activity, and their surroundings. A peak is an extremum ERP activity point in time and space and its surroundings are defined as all points around the peak with amplitude of over 50% of the peak's amplitude. These spatio-temporally defined microstates (STEPs) per frequency band are the building blocks of the BNA algorithm. They are then clustered to produce the group level common STEPs of activity per frequency band. Clustering is performed in the following three steps: (1) mapping all possible clusters, under a pre-defined constraint of temporal and spatial window sizes per frequency band; (2) selecting the best clusters representing at least 70% of the subjects composing the group. This is done by comparing the surrounding correlations across subjects for each cluster, the number of participating subjects in each cluster, and the distance between peaks of all subjects; (3) computing the group level STEPs.
After the group level microstates events are defined, individual subjects are scored for each STEP, relative to the means and STDs of the group STEP characteristics. For precise formulae of the scores see Stern et al. (Reference Stern, Reches and Geva2016).
Appendix C
Classification
Support Vector Machine (SVM) is a commonly used pattern recognition method from the field of machine learning, owing its origin to the work of Vapnik et al. (Reference Vapnik1995). The goal is to form a decision boundary between the classes (e.g. ADHD and Control groups), by representing the input data as elements in the multidimensional feature space and identifying the best separation boundary between the classes (a plane in the multi-dimensional space), such that the margins between this boundary and the nearest elements of each class are maximal. The kernel algorithm we employed to build the classifier's separation was a linear SVM. We used a repeated cross-validation technique with 10 iterations of the classifier, in order to obtain a distribution of classification accuracy per subject, for model examination purposes (see below). The success of a classifier is not measured with statistical tools that are used for common hypothesis-testing methods for null hypothesis to rejection, and is not expressed in significance p values. Rather, these models are validated on data.
A repeated cross-validation approach with 10 iterations of classification, each containing an inner 10-fold cross-validation folds, was applied to verify the reliability of the classification's results. In this technique, the classification is tested 10 times, on different partitions (folds) of the data. In each of these ten folds the data-points are divided into a training subset composed of 90% of the data, on which the classification model is constructed, and to a testing group composed of the remaining 10%, on which the model is subsequently tested. The overall classification is then evaluated by taking the mean of the 10 folds. This whole process was repeated 10 times (hence a repeated cross-validation). Between each of these 10 iterations of the classification process, the data are shuffled to insure a different 10-fold cross validation partition in each one of the iterations. The reason for which we opted to repeat the classification 10 times along with its inner 10-fold cross-validation, was a need to further validate the selection of the best model. Classification models are often validated against a second, external, dataset. The classification model is run again on the validation dataset, and accuracy is examined. We did not have access to such a number of datasets, and therefore applied the well-accepted 10-fold cross-validation procedure. However, since we had several feature reduction methods for each score (see below) among which the best classifier was selected, a supplementary justification for this model selection would be good. We therefore opted for a repeated cross-validation, in order to achieve a distribution of classification accuracy as a secondary validation of the classifier's success. In this approach, each of the SVM classifiers (score per feature reduction method) was run 10 times in a row. Note that in each iteration the subject order is shuffled, such that the inner 10-fold cross validation yields a different set of results each time. Accuracy was then computed per subject, and ranged from 0 to 1, indexing the ratio of correct classification (the ratio in which the classifier correctly identified the label of the subject as healthy or patient). With this accuracy distribution we would test for the best model, independently of the values based on which the selection was made, and that were reported in the Results. In this way we could test whether the model providing the best sensitivity, specificity and other predictive values would also be the most accurate.
A few accepted methods for feature selection and scoring were used within the classification process, and subsequently report the results of the feature selection strategies giving the best classification results. These strategies were FPR (univariate feature selection based on false positive rate) and RFECV (recursive feature elimination with cross-validation). The performance of the classifier is reported using the repeated cross-validation test mean sensitivity, test mean specificity, PPV, NPV, and the training mean AUC computed by the ROC function.
Acknowledgements
This study is part of ElMindA's Brain Disorders Management and Imaging Technology program, which is supported by the Office of the Chief Scientist (OCS), Israel under grant numbers 44486 and 41833.
Declaration of Interest
Dr Joseph Biederman is currently receiving research support from the following sources: The Department of Defense, Food & Drug Administration, Lundbeck, Merck, Neurocentria Inc., PamLab, Pfizer, Shire Pharmaceuticals Inc., SPRITES, Sunovion, and NIH. Dr Biederman's program has received departmental royalties from a copyrighted rating scale used for ADHD diagnoses, paid by Ingenix, Prophase, Shire, Bracket Global, Sunovion, and Theravance; these royalties were paid to the Department of Psychiatry at MGH. In 2016, Dr Joseph Biederman received honoraria from the MGH Psychiatry Academy for tuition-funded CME courses, and from Avekshan, Alcobra and AACAP. He has a US Patent Application pending (Provisional Number 61/233,686) through MGH corporate licensing, on a method to prevent stimulant abuse. In 2015, Dr Joseph Biederman received honoraria from the MGH Psychiatry Academy for tuition-funded CME courses, and from Avekshan. He received research support from Ironshore, Magceutics Inc., and Vaya Pharma/Enzymotec. In 2014, Dr Joseph Biederman received honoraria from the MGH Psychiatry Academy for tuition-funded CME courses. He received research support from AACAP, Alcobra, Forest Research Institute, and Shire Pharmaceuticals Inc. In 2013, Dr Joseph Biederman received an honorarium from the MGH Psychiatry Academy for a tuition-funded CME course. He received research support from APSARD, ElMindA, McNeil, and Shire. In previous years, Dr Joseph Biederman received research support, consultation fees, or speaker's fees for/from the following additional sources: Abbott, Alza, AstraZeneca, Boston University, Bristol Myers Squibb, Cambridge University Press, Celltech, Cephalon, The Children's Hospital of Southwest Florida/Lee Memorial Health System, Cipher Pharmaceuticals Inc., Eli Lilly and Co., Esai, Fundacion Areces (Spain), Forest, Fundación Dr Manuel Camelo A.C., Glaxo, Gliatech, Hastings Center, Janssen, Juste Pharmaceutical Spain, McNeil, Medice Pharmaceuticals (Germany), Merck, MGH Psychiatry Academy, MMC Pediatric, NARSAD, NIDA, New River, NICHD, NIMH, Novartis, Noven, Neurosearch, Organon, Otsuka, Pfizer, Pharmacia, Phase V Communications, Physicians Academy, The Prechter Foundation, Quantia Communications, Reed Exhibitions, Shionogi Pharma Inc, Shire, the Spanish Child Psychiatry Association, The Stanley Foundation, UCB Pharma Inc., Veritas, and Wyeth.
Dr Paul G. Hammerness receives royalties from the following publications: ADHD, Biographies of a Disease, Greenwood Press, 2009; Organize Your Mind, Organize Your Life, Harlequin Press/Harvard University, 2012; Straight Talk about Psychiatric Medications for Kids, Guilford Press 2016. Dr Hammerness also receives royalties from Massachusetts General Hospital, owner of a copyrighted questionnaire co-developed with Dr Timothy Wilens, licensed to Ironshore Pharmaceuticals. In the past 2 years Dr Hammerness has received a speaker fee from: Neos Therapeutics.
Boaz Sadeh, Ziv Peremen, Anbar Amit, Hadas Or-ly, Yaki Stern, Amit Reches and Amir B. Geva are employees of ElMindA Ltd, Herzliya, Israel.
Dr Stephen Faraone is supported by the K. G. Jebsen Centre for Research on Neuropsychiatric Disorders, University of Bergen, Bergen, Norway, the European Union's Seventh Framework Programme for research, technological development and demonstration under grant agreement no 602805 and NIMH grant 5R01MH101519.
In the past year, Dr Faraone received income, potential income, travel expenses and/or research support from Rhodes, Arbor, Pfizer, Ironshore, Shire, Akili Interactive Labs, CogCubed, Alcobra, VAYA Pharma, NeuroLifeSciences and NACE. With his institution, he has US patent US20130217707 A1 for the use of sodium-hydrogen exchange inhibitors in the treatment of ADHD. In previous years, he received income or research support from: Shire, Alcobra, Otsuka, McNeil, Janssen, Novartis, Pfizer and Eli Lilly. Dr Faraone receives royalties from books published by Guilford Press: Straight Talk about Your Child's Mental Health, Oxford University Press: Schizophrenia: The Facts and Elsevier: ADHD: Non-Pharmacologic Interventions. He is principal investigator of www.adhdinadults.com.