Introduction
This review focuses primarily on GABAergic and glycinergic receptors as the postsynaptic targets of amacrine cell inhibition. Although significant insights have come from work in other species, this review focuses on the nonprimate mammalian retina, whose retinas show significant circuit similarities (Masland, Reference Masland2001). The most recent work on this topic results from studies in rat and, especially, mouse. In fact, results in the mouse retina particularly dominate because of the powerful molecular tools that can be brought to bear in this species. Two general reviews of amacrine cells precede this one (Masland, Reference Masland1988; Kolb, Reference Kolb1997), and other reviews cover specific aspects and will be referred to where appropriate.
Amacrine cell classes and their neurotransmitters
Before discussing the receptor targets of amacrine cells, it is appropriate to first define the types of amacrine cells as well as the neurotransmitters that they express. Approximately 30 types of amacrine cells have been identified morphologically in mammalian retina (e.g., MacNeil & Masland, Reference MacNeil, Heussy, Dacheux, Raviola and Masland1998; MacNeil et al., Reference MacNeil and Masland1999; Lin & Masland, Reference Lin and Masland2006). In parallel, autoradiography, immunocytochemistry, and molecular biological techniques have been used to identify expression of neurotransmitters, their synthesizing enzymes, calcium-binding proteins, and transporters in amacrine cells. Together, these results have been used to simplify amacrine cells into two general categories: wide-field amacrine cells that express GABA and narrow-field amacrine cells that express glycine (Pourcho & Goebel, Reference Pourcho and Goebel1983; Menger et al., Reference Menger, Pow and Wässle1998). Although GABA and glycine are now recognized as the primary neurotransmitters of amacrine cells, the first amacrine cell neurotransmitter that was found was acetylcholine (Masland & Livingstone, Reference Masland and Livingstone1976) and its nicotinic receptors were localized in the inner plexiform layer (Zucker & Yazulla, Reference Zhou and Lee1982). Subsequently, these cells were shown to be the morphologically distinct starburst amacrine cells in several species (Famiglietti, Reference Famiglietti1983; Tauchi & Masland, Reference Tauchi and Masland1984, Pourcho & Osman, Reference Pourcho and Osman1986; Voigt, Reference Voigt1986). Shortly thereafter, these cholinergic amacrine cells also were shown to express GABA or its synthetic enzyme, glutamic acid decarboxylase (Brecha et al., Reference Brecha, Johnson, Peichl and Wässle1988; Kosaka et al., Reference Kosaka, Tauchi and Dahl1988; Vaney & Young, Reference Vaney and Young1988). Amacrine cells also can be distinguished from one another by colocalization and presumably co-release of dopamine or other neuromodulators/neurohomones; for example, somatostatin, Substance P, Neuropeptide Y, serotonin vasoactive intestinal polypeptide, endocannabinoids. For example, the GABAergic A17 amacrine cells colocalize serotonin, and, in addition to acetylcholinergic (starburst) amacrine cells, dopaminergic A18 amacrine cells colocalize GABA. Neuropeptides also commonly colocalize GABA, that is, substance P in A22 amacrine cells is almost certainly its secondary transmitter (GABA is primary). The bulk of the literature, however, examines the receptors of GABA and glycine and, as a consequence, this review will focus on these targets. Discussion of other less well-characterized neurotransmitters and their receptors can be found in other reviews [ATP/P2X and Y (Ward & Fletcher, Reference Ward and Fletcher2009); endocannabinoids (Yazulla, Reference Yazulla, Studholme and Pinto2008); Endorphin (Gallagher et al., Reference Gallagher, Witkovsky, Roux, Low, Otero-Corchon, Hentges and Vigh2010); Neuropeptide Y (D’Angelo & Brecha, Reference D’Angelo and Brecha2004); somatostatin/Neurokinin (Casini et al., Reference Casini, Catalani, Dal and Bagnoli2005)].
Ionotropic GABAergic and glycinergic receptor targets of amacrine cells
Amacrine cell receptor targets can be either GABAergic or glycinergic, and they occur in approximately equal proportions throughout the inner plexiform layer. The ionotropic GABA and glycine receptors (GlyRs) are pentameric structures, which are assembled from combinations of subunits. All bind ligand and open a chloride conductance that in the mature retina lead to hyperpolarization in the postsynaptic cell (Cascio, Reference Cascio2006). Both ionotropic GABAA receptors and GABAC receptors (GABAARs and GABACRs) and metabotropic GABAergic, GABAB receptors (GABABRs), are found in the inner retina, and the evidence is strong that they are all postsynaptic targets of amacrine cells. Until very recently, only ionotropic glycinergic receptors had been identified as amacrine cell targets. A new study in salamander retina suggests that there is a metabotropic GlyR that may play a role in inner retinal function (Hou et al., Reference Hou, Duan and Slaughter2008).
GABAA receptor subunits
Nineteen different GABAAR subunits have been identified in mammals. They are divided into: α1–α6, β1–β3, γ1–γ3, δ, ε, θ, and π (Olsen & Sieghart, Reference Olsen and Sieghart2009). Although this subunit variety could results in ∼150,000 receptor combinations, only 12 are reported in high frequency (Whiting et al., Reference Whiting, Bonnert, McKernan, Farrar, Le Bourdellès, Heavens, Smith, Hewson, Rigby, Sirinathsinghji, Thompson and Wafford1999) and with one of two general GABA receptor configuration: two α, two β, and one γ; two α, one β, and two γ. The combinations of GABAAR subunits differ throughout the central nervous system (CNS) including the retina and show differential pharmacological sensitivities and importance in mediating a variety of behaviors (for reviews, see Korpi et al., Reference Korpi, Gruender and Luddens2002; Wafford et al., Reference Wafford, Macaulay, Fradley, O’Meara, Reynolds and Rosahl2004). Nusser and colleagues have examined many facets of GABAAR-mediated responses in the CNS including the phasic versus tonic nature of inhibition, receptor number, location, and occupancy (reviewed in Farrant & Nusser, Reference Farrant and Nusser2005; Nusser, Reference Nusser, Sieghart and Somogyi2009). In particular, Nusser et al. (Reference Nusser1998) show that subunit combinations (GABAA δ subunit) confer high affinity and prolong response time course to GABA in the cerebellum. How these different subunits and/or distribution mediate differences in inhibition in the retina has yet to be directly addressed.
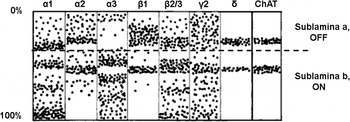
Distribution of GABAA receptor subunits in the sublaminae of the inner plexiform layer. 0% refers to the margin of the inner nuclear layer and 100% to the margin of the ganglion cell body layer. Figure modified from Grünert (Reference Grünert1999).

The expression of GABAAR subunits in the mammalian retina has been explored primarily by Grünert and Wässle and their colleagues (reviewed in Wässle et al., Reference Wässle, Koulen, Brandstatter, Fletcher and Becker1998; Grünert, Reference Grünert1999; Yang, Reference Yang2004). The most common subunit combination in the retina is two α, two β, and one γ (Wässle et al., Reference Wässle, Koulen, Brandstatter, Fletcher and Becker1998). A summary diagram (Fig. 1; modified from Grünert, Reference Grünert1999) shows the current view of the expression pattern of GABAAR subunits in the retina. Most GABAA subunit expression has either stratified hot spots or laminar specificity in the inner plexiform layer. For example, expression of GABAAR α1, β2/3, and γ2 subunits, while relatively ubiquitous throughout inner plexiform layer, has denser expression patterns within several sublaminae. Expression of GABAAR α2 and β1 subunits is concentrated in sublamina a (OFF sublamina) of the inner plexiform layer, although they each have expression within the choline acetyltransferase (ChAT) band in sublamina b (ON sublamina). The GABAAR α3 subunit tends to predominate in the inner plexiform layer sublamina b (ON) and appears to avoid its ChAT band. The delta subunit has the most laminar specificity, and expression coincides with ChAT bands in both inner plexiform sublaminae.
GABAAR subunit expression is localized on specific cell classes in the inner retina. GABAAR α1 and β2/3 subunits are localized on bipolar, amacrine, and ganglion cells. GABAAR α2, α3, and γ2 subunits are reported to be expressed by dopaminergic amacrine cells. Synaptic clusters of GABAAR α1, α2, and α3 are found on the dendrites of individual Alpha ganglion cells. On rod bipolar cells, there is morphological evidence that GABAAR γ2 coassembles with α1 and independent evidence that it also colocalizes with β2/3. This leads to the hypothesis that the most likely conformation of GABAARs on rod bipolar cells is α1, β2/3, γ2, although the α3 receptor also is expressed (Fletcher et al., Reference Fletcher, Koulen and Wässle1998).
GABAC receptor subunits
By comparison to GABAARs, the GABACR subunit composition is significantly simpler. Five subunits have been identified: ρ1–ρ5 (Enz, Reference Enz and Cutting2001; Chebib, Reference Chebib2004). Although the GABA ρ subunits form GABACRs on the neuronal membrane, their exact subunit composition in the mammalian retina has yet to be determined. Studies in heterologous systems indicate that homopentameric channels comprised of GABACRρ1 subunits have channel kinetics similar to the native receptor. Expression of GABACR ρ2 and ρ3 has been reported in the retina (Enz et al., Reference Enz1995; Wegelius et al., Reference Wegelius, Pasternack, Hiltunen, Rivera, Kaila, Saarma and Reeben1998; Enz & Cutting, Reference Enz, Brandstatter, Hartveit, Wässle and Bormann1999), and it is clear that the expression level of ρ3 is low relative to ρ1 and ρ2. The relative abundance of GABACR ρ1 and ρ2 has not been definitively described. Nonetheless, ρ1 and ρ2 probably form heteromeric native GABAc channels. The bulk of evidence from biochemical and molecular manipulations of the GABACR ρ1 subunit indicates that it is the critical element in receptor assembly (reviewed in Enz, Reference Enz and Cutting2001). These data are reinforced by the observation that elimination of the ρ1 subunit through gene targeting eliminates all ρ subunit expression in the retina, and all 1,2,5,6-tetrahydropyridine-4yl) methyphosphinic acid (TPMPA)-sensitive GABA currents in bipolar cells (McCall et al., Reference McCall, Lukasiewicz, Gregg and Peachey2002). This dependence on the GABACR ρ1 subunit in the retina may not be the case in more central targets where ρ2 expression appears to be independent of ρ1 (Schlicker et al., Reference Schlicker, McCall and Schmidt2009).
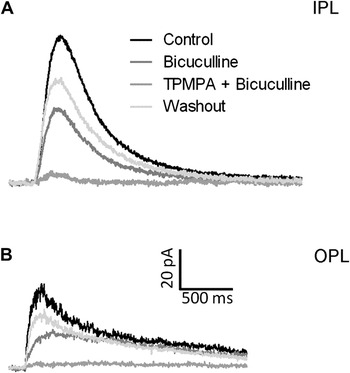
The primary location of GABACRs in the retina is on bipolar cells. Both immunohistochemistry and responses to localized GABA application show that the contribution of GABACRs is weighted to the axon terminal (Shields et al., Reference Shields, Tran, Wong and Lukasiewicz2000; Fig. 2). That said a systematic analysis of the contribution of GABAA and GABAC at the dendritic versus axonal terminals across cone bipolar cell classes has not been performed. While there is a single report of TPMPA-sensitive currents in rabbit ON alpha ganglion cells (Rotolo & Dacheux, Reference Rotolo and Dacheux2003a), this observation has not been replicated in other species (Sagdullaev et al., Reference Sagdullaev, McCall and Lukasiewicz2006).
(A) GABA evoked currents in rod bipolar cells when GABA is focally applied to their axon terminal in the inner plexiform layer or (B) on their dendritic arbor in the outer plexiform layer. The pharmacological manipulations (Bicuculline, Bicuculline + TPMPA) indicate that the currents are mediated by a combination of GABAARs and GABACRs. Figure modified from Hermann et al. (Reference Hermann, Heflin, Hammond, Lee, Wang, Gainetdinov, Caron, Eggers, Frishman, McCall and Arshavsky2011).

GlyR subunits
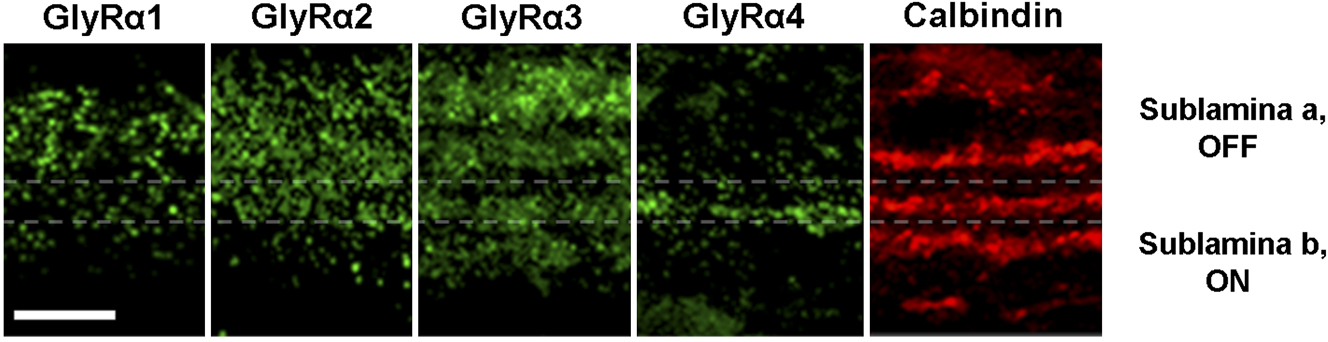
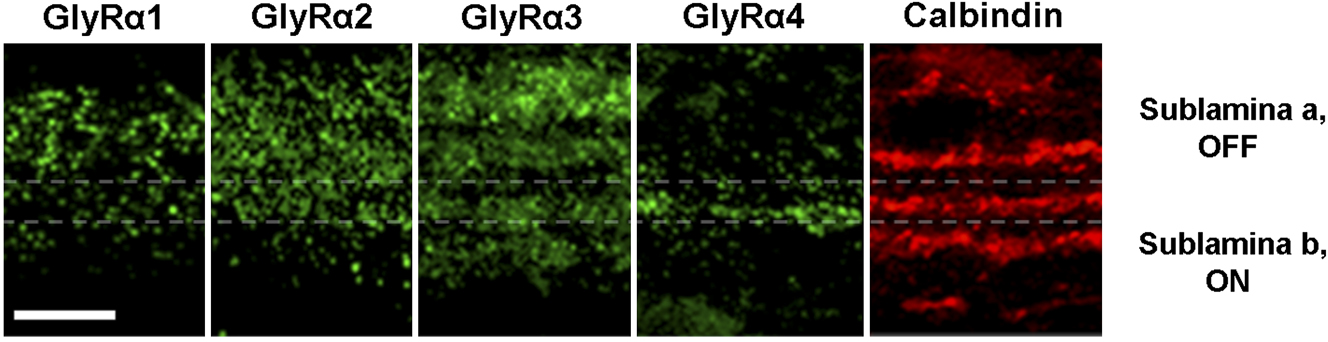
Five different ionotropic glycinergic subunits have been identified. There is a single β subunit and four α subunits (α1, α2, α3, and α4). Like GABA receptors, the GlyR is a heteropentameric structure, and the predominant subunit composition when the receptor is located synaptically is three β and two α subunits. Homomeric GlyR configurations may exist but have not been definitively described in vivo. All five subunits are expressed in the inner plexiform layer. GlyRβ subunits are expressed throughout the inner plexiform layer, which is expected since all synaptic receptors appear to require the β subunit for targeting the membrane. The four GlyRα subunits show distinct expression patterns across the inner plexiform layer sublaminae (Fig. 3 adapted from Nobles et al., Reference Nobles, Zhang, Muller, Betz and McCall2012; see also Heinze et al., Reference Heinze, Harvey, Haverkamp and Wässle2007). The glycine α1 subunit is expressed primarily in the inner plexiform layer sublamina a (OFF), whereas α2 is expressed ubiquitously throughout both sublaminae. Glycine α3 subunit expression forms four distinct bands, two in the inner plexiform layer sublamina b (ON) and two within sublamina a (OFF). The glycine α4 subunit is expressed throughout the inner plexiform layer with highest density in a single band that is localized near the ChAT-positive band in the ON sublaminae (Heinze et al., Reference Heinze, Harvey, Haverkamp and Wässle2007). These subunits also show distinct decay kinetics with GlyRα1, the fastest 5.9 ms, followed by GlyRα3, GlyRα2, and the slowest, GlyRα4 66 ms (reviewed by Wässle et al., Reference Wässle, Heinze, Ivanova, Majumdar, Weiss, Harvey and Haverkamp2009). This differential distribution of GlyR subunits in addition to the diverse kinetics (Webb & Lynch, Reference Webb and Lynch2007) makes it likely that they, like GABAA and GABAC receptors, will subserve inhibition in different retinal circuits. At this point, however, we have only begun to determine a functional correlation of visual response characteristics across the GlyR alpha subunits in the retina (See Nobles et al., Reference Nobles, Zhang, Muller, Betz and McCall2012).
Distribution of Glycine alpha receptor subunits in the inner plexiform layer of wild type mouse retina serial sections relative to calbindin positive bands to show sublamination. The position of choline acetyltransferase expression in the inner plexiform is indicated by dashed lines. The distributions shown here are similar to those published for these receptor subunits using the same antibodies in: Grunert & Wassle, 1993; Grunert, 1999, 2000; Haverkamp et al., Reference Haverkamp, Müller, Harvey, Harvey, Betz and Wässle2003, Reference Haverkamp, Muller, Zeilhofer, Harvey and Wässle2004; Heinz et al., 2007; Majumdar et al., 2007; Wassle et al., 2009. GlyRα1 subunits are located primarily in sublamina a (OFF) but also can be seen to a lesser extent in sublaminae b (ON), where they colocalize with A-type ganglion cells (Majumdar et al., Reference Majumdar, Heinze, Haverkamp, Ivanova and Wässle2007). GlyRα2 subunits are primarily located in sublamina a (OFF). GlyRα3 subunits are localized in both sublaminae but expression is absent from the ChAT bands, whereas GlyRα4 subunits colocalize with the ON ChAT band (lower dashed line). Scale bar = 10μm. Figure modified from Nobles et al. (Reference Nobles, Zhang, Muller, Betz and McCall2012).
Immunohistochemistry and electrophysiology studies have demonstrated GlyRα-specific glycinergic input in different retinal neurons (reviewed in Wässle et al., Reference Wässle, Heinze, Ivanova, Majumdar, Weiss, Harvey and Haverkamp2009). The cell class distributions are consistent with the laminar expression pattern described above. OFF and rod bipolar cells receive glycinergic input solely via GlyRα1, although ON cone bipolar cells do not appear to receive any glycinergic inputs. Alpha ganglion cells receive their glycinergic inputs primarily via GlyRα1, although they may receive input via GlyRα2 as well (Nobles et al., Reference Nobles, Zhang, Muller, Betz and McCall2012). Narrow-field glycinergic amacrine cell classes 5, 6, and 7 (Menger et al., Reference Menger, Pow and Wässle1998; also encompassed in the broadly stratifying narrow-field amacrine cell class of MacNeil et al., Reference MacNeil and Masland1999; Weiss et al., Reference Weiss, O’Sullivan, Heinze, Chen, Betz and Wässle2008) and GABAergic wide-field–displaced amacrine cells receive synaptic GlyRα2-mediated input (Majumdar et al., Reference Majumdar, Weiss and Wässle2009). GlyRα3 appears to be responsible for synaptic glycinergic currents in AII amacrine cells (Weiss et al., Reference Weiss, O’Sullivan, Heinze, Chen, Betz and Wässle2008). Using an exclusion paradigm, glycinergic spontaneous inhibitory postsynaptic currents (sIPSCs) of ON starburst amacrine cells are not altered in mouse mutants of GlyR α1, α2, or α3 subunits and, therefore, they must express GlyRα4 (Heinze et al., Reference Heinze, Harvey, Haverkamp and Wässle2007; Majumdar et al., Reference Majumdar, Weiss and Wässle2009).
Interactions within and among GABA and GlyR subunits
Whether there are significant interactions within and among retina GABA and GlyRs have not been thoroughly examined. Studies in other parts of the CNS show little evidence for any transcriptional/translational control of individual GABAA subunits on other GABAergic or glycinergic subunits (reviewed by Mohler et al., Reference Molnar, Hsueh, Roska and Werblin1998). Instead, altered expression of GABAA subunits primarily changes pharmacological sensitivities and/or current kinetics. One notable result is the dependence of GABAAR expression on its β3 subunit. Elimination of expression of this subunit caused the loss of ∼50% of the GABAARs in the brain (changes in the retina were not noted). If the individual roles of GABAA subunit-specific receptors are to be examined in the retina, it will be important to first demonstrate that the retina is similar to the rest of the CNS and GABAAR subunit expression is independent.
Interactions of mammalian GABAA and GABAC subunits have not been reported in vivo, and experiments using mammalian subunits expressed in a heterologous system show no interactions between GABAA and GABACR subunits (reviewed in Enz, Reference Enz and Cutting2001). This may differ in nonmammalian retina (Qian & Ripps, Reference Qian and Ripps1999). A potential interaction has been reported between the GABAergic and glycinergic systems in the retina of the spontaneous mouse mutant, spastic (Yazulla et al., Reference Yazulla1997), which harbors a mutation in the GlyR β subunit. As expected from the role of the β subunit in GlyR targeting, there is a decline in glycine subunit immunoreactivity. Unexpectedly, there is a decrease of GABA in the inner plexiform layer as well. Although these data indicate some interaction between the glycinergic and GABAergic systems, they do not support interactions at the subunit level.
Metabotropic GABAergic and glycinergic receptor targets of amacrine cells
GABABRs are metabotropic G protein-coupled receptors, which activate inward rectifying K+ channels and suppress voltage-gated Ca2+ channels (reviewed by Padgett & Slesinger, Reference Padgett and Slesinger2010). A functional GABABR is heterodimer composed of two distinct seven-transmembrane subunits, termed GABAB1 and GABAB2. Each has several splice variants, and the confirmed GABABR subtypes in the retina are GABA(B1a, B2) and GABA(B1b, B2) (Benke et al., Reference Benke, Michel and Mohler2002). Immunolabeling shows that GABABRs are expressed at the terminals of both amacrine cell and ganglion cells, where they are positioned as targets of amacrine cells (Koulen et al., Reference Koulen, Sassoe-Pognetto, Grünert and Wässle1998b). There is no histological evidence that GABABRs are expressed in bipolar cells, although an electrophysiological study suggests GABABR-mediated feedback to these cells in salamander. This requires direct expression of GABABR on bipolar cells or a serial inhibitory circuit with a GABABR-mediated input onto a glycinergic amacrine cell presynaptic to the bipolar cell (Song & Slaughter, Reference Song and Slaughter2010). A recent study by the same laboratory (Hou et al., Reference Hou, Duan and Slaughter2008) found that in the presence of strychnine, glycine evoked a G protein cascade-mediated response in salamander bipolar cell and ganglion cells. This results in a suppression of protein kinase A (PKA)-induced voltage-gated calcium currents and in bipolar cells a reduction of glutamate release. The gene that underlies this glycinergic metabotropic receptor has not been identified and its presence in mammalian retina has not been verified.
GABA and GlyR targets of amacrine cells in the inner retina
This section divides amacrine cell receptor targets by the postsynaptic inner retinal cell class (e.g., bipolar, amacrine, or ganglion cells) on which they are expressed. Each section briefly describes how subclasses within each of these postsynaptic cell types are defined; the GABA and/or GlyRs that they express and whenever possible the presynaptic amacrine cell classes that provide the input. Within these sections, the type of inhibitory circuit in which each receptor participates also is discussed when possible (e.g., reciprocal, feedforward, and serial).
For a variety of reasons, four amacrine cell classes have been the primary targets of study in the retinal circuit. These are: the narrow-field glycinergic AII amacrine cell and three wide-field amacrine cells, the GABAergic/acetylcholinergic, starburst amacrine cell, the GABAergic/serotonin-accumulating A17 or S1/S2 amacrine cell, and the dopaminergic amacrine cell. Because of the intensity scrutiny given to these amacrine cells, we know the most about their postsynaptic receptor targets and also about the presynaptic receptor targets that they express. Throughout the following sections, there is a focus on these four amacrine cell classes, as the amacrine cell that is the target of other amacrine cells as well as the amacrine cell that targets bipolar cells (AII and A17 amacrine cell classes) and ganglion cells (starburst and dopaminergic amacrine cell classes).
Bipolar cell classes
Structure, function, and inhibitory inputs define bipolar cell classes
Bipolar cell axon terminals are the postsynaptic targets of GABA and glycinergic amacrine cell inputs. The type and distribution of amacrine cell inputs depend on bipolar cell class. Bipolar cells are divided into two general functional groups based on their mechanism of excitatory signal transduction and their axon termination pattern in the inner plexiform layer sublaminae. Depolarizing (ON) and hyperpolarizing OFF bipolar cells depolarize to increments and decrements of light, respectively. This is attributed to differences in the expression of the postsynaptic glutamate receptors that they express on their dendritic tips; metabotropic glutamate receptor 6 in ON bipolar cells and AMPA/kainate receptors in OFF bipolar cells. Within the inner plexiform layer, ON bipolar cell axon terminals ramify in sublamina b (ON), whereas OFF bipolar cell axon terminals ramify in the sublamina a (OFF). These features position the bipolar cells as the excitatory presynaptic partners of the ON, OFF, or ON/OFF amacrine and ganglion cells. This synaptic organization sets up what have been called the parallel ON and OFF parallel pathways of the retina. As the postsynaptic target of different classes of amacrine cells, bipolar cells receive either feedforward inhibition within the ON or OFF functional pathways or crossover inhibition across a functional pathway (Molnar & Werblin, Reference Mohler, Luscher, Fritschy, Benke, Benson and Rudolph2007). A recent review by Eggers and Lukasiewicz (Reference Eggers, McCall and Lukasiewicz2011) discusses these inhibitory inputs and how the excitatory and inhibitory inputs are matched temporally and how they shape bipolar cell output. Here, the focus is on the subunit composition and distribution of GABA and GlyRs and their presynaptic amacrine cell partners, with a particular emphasis on the two best studied A17 and AII amacrine cell classes.
Distribution of GABAergic and glycinergic receptors across bipolar cell functional class
In addition to the bipolar cell classification scheme described above, within the ON bipolar cell class, a further distinction is made relative to the presynaptic photoreceptor partner. ON bipolar cells can be driven primarily by rod photoreceptors (rod ON bipolar cells), while all the others are driven by cone photoreceptors (cone ON bipolar cells). Almost all OFF bipolar cells are driven by cone photoreceptors, although there is increasing evidence of a rod to OFF bipolar cell pathway (first noted by DeVries & Baylor, Reference DeVries and Baylor1995; Soucy et al., Reference Soucy, Wang, Nirenberg, Nathans and Meister1998). Work from several laboratories indicates a general rule with respect to the relative GABAergic and glycinergic receptor expression and inhibitory currents that can be evoked by amacrine cell inputs at bipolar cell axon terminals. In all mammalian retinas, rod ON bipolar cells express GABAA, GABAC (Euler & Wässle, Reference Euler and Wässle1998; Fletcher et al., Reference Fletcher, Koulen and Wässle1998; Wässle et al., Reference Wässle, Koulen, Brandstatter, Fletcher and Becker1998; Shields et al., Reference Shields, Tran, Wong and Lukasiewicz2000; Eggers & Lukasiewicz, Reference Eggers and Lukasiewicz2006; Eggers et al., Reference Eggers and Lukasiewicz2007), and GlyRs (Gillette & Dacheux, Reference Gillette and Dacheux1995; Frech & Backus, Reference Frech, Perez-Leon, Wässle and Backus2004; Eggers & Lukasiewicz, Reference Eggers and Lukasiewicz2006; Ivanova et al., Reference Ivanova, Muller and Wässle2006; Eggers et al., Reference Eggers and Lukasiewicz2007; Morkve & Hartveit, Reference Morkve and Hartveit2009). GABAC receptor-meditated currents are dominant, with GABAA receptors mediating a relatively smaller proportion of the GABA-evoked current. The glycine-evoked current represents the smallest component of inhibition in rod ON bipolar cells. On the other end of the spectrum, glycine α1/β subunit-mediated inhibitory inputs are most prevalent in OFF bipolar cells and GABAA, and then, GABAC receptor-mediated currents contribute in declining proportions. The cone ON bipolar cell inhibitory inputs are derived from GABAA and GABAC receptors in close to equal proportions. In mouse cone ON bipolar cells, there is no glycine-mediated current (Eggers & Lukasiewicz, Reference Eggers and Lukasiewicz2006; Ivanova et al., Reference Ivanova, Muller and Wässle2006; Eggers et al., Reference Eggers and Lukasiewicz2007, but see Zhou & Dacheux, Reference Zhou and Dacheux2005). The study of the structural microcircuitry of cat bipolar cells (McGuire et al., Reference McGuire, Stevens and Sterling1984) suggests that these rubrics may be too simple, and it may be necessary to include not just the receptor type but also the type of inhibition that it mediates. For example, across cat cone bipolar cells, the proportions of chemical synapses that form reciprocal synapses with amacrine cells versus those that form nonreciprocal synapses vary by morphological class and similarities appear between cone ON and OFF bipolar cells (McGuire et al., Reference McGuire, Stevens and Sterling1984). Thus, their role in shaping the excitatory signal could vary significantly and next step in the evolution of our understanding of these circuits should include characterizations of both structure and function (e.g., see Grimes et al., Reference Grimes, Zhang, Graydon, Kachar and Diamond2010).
Current kinetic properties of amacrine receptor targets
There are general differences in the kinetics of GABAergic and glycinergic inhibitory currents, their sensitivities to ligand, and in their amacrine cell presynaptic inputs. This leads to the hypothesis that the receptor classes mediate different temporal inhibitory characteristics. The work of Eggers and colleagues (reviewed in Eggers & Lukasiewicz, Reference Eggers, McCall and Lukasiewicz2011) demonstrates that the temporal characteristics of the inhibitory receptors and their bipolar cell circuits are matched. For example, GABAA and GABAC receptors differ significantly in their sensitivities to GABA, the kinetics of their currents, as well as their desensitization properties (Amin & Weiss, Reference Amin and Weiss1994; Feigenspan & Bormann, Reference Feigenspan and Bormann1994; Wotring et al., Reference Wotring, Chang and Weiss1999; Shields et al., Reference Shields, Tran, Wong and Lukasiewicz2000). In general, this results in fast GABAA receptor-mediated currents that desensitize quickly in the continued presence of neurotransmitter. The higher sensitivity, slow kinetics, and desensitization properties of GABACR-mediated currents are much more suited to tonic/maintained inputs. If evoked simultaneously, the GABAA receptor-mediated currents have peaked and begun to decay before the peak of GABAC receptor-mediated currents. The kinetics of the α1β GlyR-mediated currents in bipolar cells are similar to the GABAA receptor-mediated currents (Eggers & Lukasiewicz, Reference Eggers and Lukasiewicz2006; Ivanova et al., Reference Ivanova, Muller and Wässle2006; Eggers et al., Reference Eggers and Lukasiewicz2007); they have fast onset and offset times. However, the amacrine cell classes that target these receptors differ in their lamination pattern and dendritic extents. As described above, GABAergic amacrine cells are wide field and ramify in a single sublamina of the inner plexiform layer, whereas glycinergic amacrine cells are narrow field and ramify diffusely throughout the inner plexiform layer. Thus, although the temporal characteristics mediated by similar postsynaptic receptor configurations should be the same regardless of their presynaptic partner, the spatial characteristics of their presynaptic partner may create functional variety, as described in the following sections.
The GABAA and GABAC receptors of the rod ON bipolar cell are the primary targets of the GABAergic A17/S1or S2 amacrine cells
Under dark-adapted conditions where retinal signaling originates in rod photoreceptors, the rod ON bipolar cell conveys the majority of information to the inner retina. Kolb and Nelson (Reference Kolb, Cuenca and Dekorver1983) were the first to describe the functional connectivity of the rod ON bipolar cell in the cat retina. They found that the sustained response of the rod ON bipolar cell at light onset provided input to several different amacrine cell morphological classes, among them the A17, as well as, the AII, A6, A8, and A13 amacrine cells. Prior to this, Ehinger and Floren (Reference Ehinger and Floren1976) had observed that cells in the rabbit and cat retina accumulated indoleamine. The results of a number of studies (Sandell & Masland, Reference Sandell and Masland1986; Vaney, Reference Vaney, Nelson and Pow1986; Wässle & Chun, Reference Wässle, Chun and Muller1988) concluded that the A17 amacrine cell was one of the indoleamine-accumulating cells in the cat and the equivalent of the S1 amacrine cell in the rabbit retina. In addition, these amacrine cells were observed to express GABA or one of the chemicals in its synthetic pathways (Pourcho & Goebel, Reference Pourcho and Goebel1983; Wässle & Chun, Reference Wässle, Chun and Muller1988). Although the S1/S2 terminology is retained in the rabbit literature, the A17 morphological equivalent in the rodent retina (N.B. these amacrine cells do not accumulate indoleamine) is called A17. When important, the S1/S2 distinction will be made, and elsewhere, the term A17 will be used.
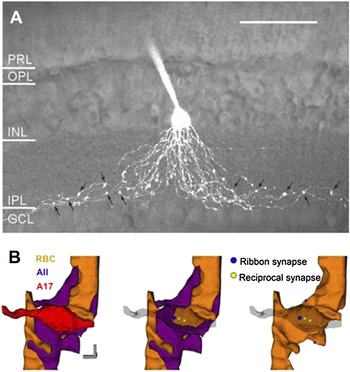
The A17 amacrine cell is part of a specialized synapse with the rod ON bipolar cell axon terminal, called a dyad (Raviola & Dacheux, Reference Raviola and Dacheux1987; Strettoi et al., Reference Strettoi, Dacheux and Raviola1992). It is comprised of a presynaptic ribbon specialization on the rod ON bipolar cell and two postsynaptic partners, the AII and A17 amacrine cells. At this synapse, the AII is the excitatory postsynaptic target of the rod ON bipolar cell. In contrast, the A17 is both an excitatory postsynaptic target and also provides a reciprocal GABAergic reciprocal feedback onto the same rod ON bipolar cell (cat, Freed et al., Reference Freed, Smith and Sterling1987; salamander, Lukasiewicz & Werblin, Reference Lukasiewicz, Eggers, Sagdullaev and McCall1994). In a recent study utilizing the power of two-photon microscopic imaging in conjunction with electrophysiological assessments, Grimes et al. (Reference Grimes, Zhang, Graydon, Kachar and Diamond2010) were able to record and then reconstruct the A17 at the electron microscopic level. As can be seen in Fig. 4 (modified from Grimes et al., Reference Grimes, Zhang, Graydon, Kachar and Diamond2010), the A17 soma is located at the bottom of the inner nuclear layer and has long thin neurites with varicosities that extend into sublamina b (ON) of the inner plexiform layer. Each varicosity receives an excitatory input from a rod ON bipolar cell and at the same location returns a GABAergic reciprocal feedback input. These synaptic interactions, localized to the varicosities are emblematic of the A17 amacrine cell processes, and most varicosities are found apposed to rod ON bipolar cells. The postsynaptic receptors at this reciprocal synapse on the rod ON bipolar cell terminal are both GABAC and GABAA (Protti & Llano, Reference Protti, Gerschenfeld and Llano1998; Hartveit, Reference Hartveit1999; Matsui et al., Reference Matsui, Hasegawa and Tachibana2001; Zhou & Dacheux, Reference Zhou and Dacheux2005; Molnar & Werblin, Reference Mohler, Luscher, Fritschy, Benke, Benson and Rudolph2007). Among the postsynaptic GABAARs, electron microscopic analyses verify that varicosities are found in apposition to GABAA α1Rs, and immunohistochemistry suggests that GABAAα3Rs are located at other varicosities (Fletcher & Wässle, Reference Fletcher and Wässle1999). The complete subunit composition of the GABAA receptors that contain the α1 and α3 subunits at these synapses is unknown. In the thalamus, α1 combines with β2 and γ2, whereas α3 combines with β3 and γ2. Here too, these subtypes are differentially located (Sieghart & Sperk, Reference Sieghart and Sperk2002), and their inhibitory postsynaptic currents decay differently with α3, β3, γ2 currents slower than those mediated by α1, β2, γ2 (Mozrzymas et al., Reference Mozrzymas, Barberis and Vicini2007; Schofield & Huguenard, Reference Schofield and Huguenard2007; Jia et al., Reference Jia, Goldstein and Harrison2009). If the scenario in the thalamus and the retina is similar, then the GABAA α1 and α3 containing receptor inputs would govern very different inhibitory synaptic currents and modulate different temporal aspects of the visual response.
(A) A two photon image of a fluorescent dye filled A17 amacrine cell (arrows point to varicosities where synaptic feedback is likely to occur). Scale bar 50 μm (B, left). Schematic representations based on serial electron microscopic reconstruction of the A17 amacrine cell (red) and its synaptic relationships with AII amacrine cells (purple), rod bipolar cells (gold). (B, middle and right) The relationships of synaptic ribbons and inhibitory synapses, which are likely sites of reciprocal feedback with the A17 varicosity transparent (middle) and with the AII profile removed (right). Scale bar 500 nm. Figure modified from Grimes et al. (Reference Grimes, Zhang, Graydon, Kachar and Diamond2010).

The localization of GABAA and GABACRs relative to one another in rod ON bipolar cells appears independent (Fletcher et al., Reference Fletcher, Koulen and Wässle1998; Koulen et al., Reference Koulen, Sassoe-Pognetto, Grünert and Wässle1998a), and their presynaptic inputs could arise from distinct GABAergic amacrine cells. Consistent with this idea, there is no predilection for either S1 or S2 amacrine cells presynaptic to either GABAA or GABACRs (Fletcher et al., Reference Fletcher, Koulen and Wässle1998; Fletcher & Wässle, Reference Fletcher and Wässle1999). The only difference observed is that the positioning of S2 amacrine cell input suggests that it provides local lateral inhibitory signals, whereas S1 inputs should provide more distal inhibitory inputs (Zhang et al., Reference Zhang, Stone, Zhou, Ohta and McMahon2002). Because indoleamine-accumulating cells are not found in the rodent retina, it is not clear whether these are cells equivalent to the rabbit S1/S2, although amacrine cells with A17-like morphology have been observed (Perry & Walker, Reference Perry and Walker1980; Menger & Wässle, Reference Menger and Wässle2000; Grimes et al., Reference Grimes, Zhang, Graydon, Kachar and Diamond2010).
Other properties of bipolar cell receptor targets of A17 and other amacrine cells
In addition to the type of amacrine cell presynaptic to these receptor targets, there are several other factors that contribute to the role of the receptor target in visual processing. These issues have been described in detail by Eggers and colleagues and by Diamond and colleagues (reviewed in detail in Eggers & Lukasiewicz, Reference Eggers, McCall and Lukasiewicz2011). First, the characteristics of amacrine cell neurotransmitter release can contribute to the timing of postsynaptic receptor inhibition. For example, inhibition may be brief or prolonged depending on whether neurotransmitter release is synchronous or asynchronous. The position of the postsynaptic receptor target relative to the synapse also can determine its role in inhibition. There is good evidence that A17 amacrine cells activate GABAARs synaptically (Singer & Diamond, Reference Singer and Diamond2003; Chavez et al., Reference Chavez and Diamond2006) and GABACRs are activated both synaptically and extrasynaptically at a nonreciprocal synapses (Chavez et al., Reference Chavez, Singer and Diamond2010). If these extrasynaptic receptors have no direct presynaptic input, they can only contribute inhibition via neurotransmitter spillover. Thus, their role will be limited to cases when inhibitory neurotransmitter release is maximal and/or prolonged. A final consideration resides within the spatial summation properties of the A17 amacrine cell itself and whether it provides local or long-range lateral inhibition. The morphological data from the rabbit described above (Zhang et al., Reference Zhang, Stone, Zhou, Ohta and McMahon2002) as well as physiological results (Bloomfield, Reference Bloomfield1992, Reference Bloomfield1996) argue that the S1 amacrine cell should mediate long-range inhibition, and that the S2 is more likely a modulator of local inhibition. Nelson and Kolb (Reference Nelson and Kolb1985) noted that estimates of cat A17 receptive field extent differed and depended on stimulation protocol. That is, the receptive field diameter is much larger when measured with a slit of fixed diameter is presented sequentially across the visual field versus a slit centered on the receptive field whose width is systematically increased. This mismatch, and modeling suggests that the high axial resistance between varicosities should attenuate signal propagation (Ellias & Stevens, Reference Ellias and Stevens1980; Grimes et al., Reference Grimes, Zhang, Graydon, Kachar and Diamond2010) and leads to the idea that A17 amacrine cells have little capacity for spatial integration. Most recently, Diamond and colleagues have tackled this question and demonstrated that in the reciprocal rod ON bipolar cell/A17 amacrine cell circuit, large-conductance Ca21-activated potassium, channels control calcium influx via L-type voltage-dependent calcium channels and work in conjunction with the cable properties of the A17 neurites to compartmentalize its outputs and keep individual reciprocal synaptic dyads independent (at >20 μm) (Chavez et al., Reference Chavez and Diamond2006; Grimes et al., Reference Grimes, Li, Chavez and Diamond2009, Reference Grimes, Zhang, Graydon, Kachar and Diamond2010). Recent work also shows that GABA release by A17 amacrine cells is similarly controlled by a calcium-dependent mechanism mediated by both L-type voltage-dependent and AMPA-sensitive calcium channels (Chavez et al., Reference Chavez and Diamond2006; Grimes et al., Reference Grimes, Li, Chavez and Diamond2009).
Although the role of the A17 amacrine cell in a reciprocal feedback circuit has been known since original descriptions of its synaptic interactions in the cat retina (Kolb & Nelson, Reference Kolb, Cuenca and Dekorver1983), only recently, it has been appreciated that its GABAergic reciprocal inhibitory mechanism sets it up to act as a parallel processor, potentially governing over 100 independent rod ON bipolar cell microcircuits (Grimes et al., Reference Grimes, Zhang, Graydon, Kachar and Diamond2010). Further, A17 amacrine cell inputs have been shown to locally modulate the glutamate release of the rod ON bipolar cell, which in turn controls temporal properties of their output (Tachibana & Kaneko, Reference Tachibana and Kaneko1988; Hartveit, Reference Hartveit1999; Dong & Hare, Reference Dong and Hare2003). Although these postsynaptic GABA receptor partners of this reciprocal feedback circuit are both GABAA and GABACRs (Euler & Wässle, Reference Euler and Wässle1998; Fletcher et al., Reference Fletcher, Koulen and Wässle1998; Fletcher & Wässle, Reference Fletcher and Wässle1999; Hartveit, Reference Hartveit1999) their individual roles have not yet been integrated into this evolving view of the A17 circuit.
Taking a different tack, Eggers and colleagues have examined the control of direct inhibition onto bipolar cell terminals by serial inhibition (Eggers & Lukasiewicz, Reference Eggers and Lukasiewicz2006, Reference Eggers and Lukasiewicz2010; Eggers et al., Reference Eggers and Lukasiewicz2007). Their results show that direct GABAergic inputs are controlled by amacrine cell to amacrine cell serial inhibition, and that this synaptic organization controls both the magnitude of these direct inputs, as well as spatial aspects of this inhibition (discussed in detail in amacrine cell targets of amacrine cells).
In summary, the postsynaptic receptors of amacrine cells at the rod ON bipolar cell axon terminal provide inhibitory modulation that governs the amount and timing of its glutamate release. Each receptor type is unlikely to be activated by the same A17 amacrine cell input, and the receptor types, themselves, may not be located at equivalent distances relative to the presynaptic ribbon.
Is there reason to think that there is an A17 equivalent that targets cone bipolar cells?
There are approximately nine different morphological types of cone bipolar cells (see reviews by Wässle, Reference Wässle2004; Strettoi et al., Reference Strettoi, Raviola and Dacheux2010). There is ample evidence for reciprocal synapses (some from the AII amacrine cells) and GABAergic currents onto cone bipolar cell axon terminals. Across cone bipolar cells in the cat (McGuire et al., Reference McGuire, Stevens and Sterling1984) and in calbindin-immunoreactive cone bipolar cells in the rabbit (Kim et al., Reference Kim, Jung, Kang, Jeon, Cha, Kim and Chun2010), the percentages of identified and unidentified inhibitory inputs have been quantified. In some cone bipolar cells, nearly, 50% of the inhibitory inputs remain unidentified (McGuire et al., Reference McGuire, Stevens and Sterling1984; Strettoi et al., Reference Strettoi, Dacheux and Raviola1992), and a cone pathway equivalent to the A17 has not been identified. That said there are observations that suggest that feedback inhibition should be present. In the mouse, as well as other species, GABACRs are expressed on cone ON and OFF bipolar cells. Given the properties of the current mediated by this receptor, it is likely that it performs a feedback control on the cone bipolar cells, as it does in rod ON bipolar cells. Especially, in the ON pathway, GABACR-mediated input onto cone bipolar cells controls their glutamate release. Its absence (in GABACR knockout mice relative to wild type) or pharmacological block increases the spontaneous activity of ON-center ganglion cells (Freed et al., Reference Freed and Sterling2003; Lukasiewicz et al., Reference Lukasiewicz and Werblin2004) and the absence of GABACR-mediated input alters their gain in the intensity domain (Sagdullaev et al., Reference Sagdullaev, McCall and Lukasiewicz2006). There has been a recent focus on the blue cone bipolar cell and its excitatory synaptic circuitry in a number of species (Breuninger et al., Reference Breuninger, Puller, Haverkamp and Euler2011 in mouse and reviewed in Puller & Haverkamp, Reference Puller and Haverkamp2011). It should now be straightforward to define their inhibitory receptors and presynaptic inhibitory inputs. A recent investigation of the synaptic organization of cone ON bipolar cells and dopaminergic amacrine cells (Contini et al., Reference Contini and Raviola2010) shows a reciprocal organization, on what is most likely to be the mouse CB3 also referred to as type 5 bipolar cell (Pignatelli & Strettoi, Reference Pignatelli and Strettoi2004; Ghosh et al., Reference Ghosh, Bujan, Haverkamp, Feigenspan and Wässle2004; respectively, where the cone ON bipolar cell provides excitatory input to the dopaminergic amacrine cell, which feeds back a GABAA-meditated inhibition, similar to the A17 circuit.
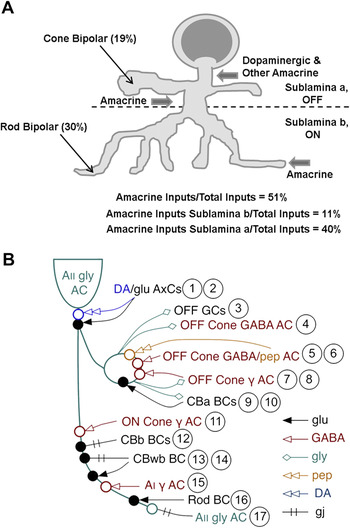
The majority of the identities of the amacrine cells that target the bipolar cells remain to be defined. One new approach uses large volumes of neural tissue to reconstruct local neural circuits. The outcome has been called the connectome and, to date, has been used to reconstruct a representative portion of the AII amacrine cell circuit in rabbit retina (See Fig. 5B; modified from Anderson et al., Reference Anderson, Jones, Watt, Shaw, Yang, Demill, Lauritzen, Lin, Rapp, Mastronarde, Koshevoy, Grimm, Tasdizen, Whitaker and Marc2011) and mouse starburst amacrine cells and their direction selectivity circuit (Briggman et al., Reference Briggman, Helmstaedter and Denk2011). The power of this approach is in the breadth of coverage, although the final overview will depend on the coupling of these results with functional properties and their impact upon visual function.
Schematic diagrams of synaptic inputs of AII amacrine cells in rabbit retina. (A) The diagram highlights the percentages of the AII inputs from rod and cone bipolar cells, as well as the inputs from amacrine cells in sublaminae a (OFF) and b (ON) of the inner plexiform layer. The percentage of total inputs to the AII are listed below the figure. Part (A) adapted from Strettoi et al. (Reference Strettoi, Raviola and Dacheux1992). (B) The diagram highlights the variety of cell type specific inputs on (arrows) and outputs (diamonds) from the AII reconstructed from serial electron microscopic serial sections. Part (B) adapted from Anderson et al. (Reference Anderson, Jones, Watt, Shaw, Yang, Demill, Lauritzen, Lin, Rapp, Mastronarde, Koshevoy, Grimm, Tasdizen, Whitaker and Marc2011).

GlyRs are the postsynaptic target of AII amacrine cells
In addition to the A17, the AII amacrine cell plays a critical role in the transfer of the visual signals from the rod photoreceptors primarily under dark-adapted conditions. The AII amacrine cell is a narrow-field glycinergic amacrine cell that is the conduit between the rod pathway at the level of rod ON bipolar cell output and both the ON and OFF ganglion cells. Its bistratified dendrites ramify in both sublaminae of the inner plexiform layer. It transfers excitatory information via gap junctions to cone ON bipolar cells, as well as to other AII amacrine cells, and transfers inhibitory information to cone OFF bipolar cells.
GlyR alpha 1 mediates AII inhibition onto rod ON bipolar cells
A glycinergic input onto rod ON bipolar cells has been observed (Chavez & Diamond, Reference Chavez, Grimes and Diamond2008), and it is mediated by GlyRs composed of α1 subunits (Ivanova et al., Reference Ivanova, Muller and Wässle2006; Morkve & Hartveit, Reference Morkve and Hartveit2009). The exact composition of the GlyRs on rod ON bipolar cells has been addressed by characterizing their biophysical and pharmacological properties on the axon terminals themselves (Morkve & Hartveit, Reference Morkve and Hartveit2009). These results point to a combination of heteromeric α1/β and homomeric α1 receptors. Questions that remain include the relative location of hetero- and homomeric receptors relative to their presynaptic input(s), whether they are targeted by inputs from one or more amacrine cell classes and if so, the differences in their neurotransmitter release properties. Unfortunately, similar analyses on cone OFF bipolar cells are unlikely, due to the small size of their axon terminals. Other strategies will be required to determine if their presynaptic input comes solely from the AII.
GlyR alpha 1 mediates AII inhibition onto OFF cone bipolar cells
Under conditions that favor signaling through the rod pathway, the AII participates in a reciprocal glycinergic synapse with cone OFF bipolar cells in a number of species (Figure 5A; Kolb & Nelson, Reference Kolb and Nelson1983, Strettoi et al., Reference Strettoi, Raviola and Dacheux1992, Chun et al., Reference Chun, Han, Chung and Wässle1993, Merighi et al., Reference Merighi, Raviola and Dacheux1996), via a postsynaptic receptor on the cone OFF bipolar cell that expresses the α1 subunit. As described above, the consensus of opinion is that the AII targets α1 subunit-containing glycinergic receptors (Sassoe-Pognetto et al., Reference Sassoe-Pognetto, Wässle and Grünert1994; Ivanova et al., Reference Ivanova, Muller and Wässle2006; Eggers & Lukasiewicz, Reference Eggers and Lukasiewicz2010) on most cone OFF bipolar cells classes (McGuire et al., Reference McGuire, Stevens and Sterling1984; Tsukamoto et al., Reference Tsukamoto, Morigiwa, Ueda and Sterling2001). Glycinergic currents are prominent only in cone OFF bipolar cells and present to a more limited extent in rod ON bipolar cells, (Ivanova et al., Reference Ivanova, Muller and Wässle2006; Eggers & Lukasiewicz, Reference Eggers and Lukasiewicz2010). In contrast, Wässle and colleagues used GlyR subunit knockout and mutant mice (GlyRα1, GlyRα2, and GlyRα3) and compared the kinetic properties of their spontaneous glycinergic inhibitory postsynaptic potentials to wild type across bipolar cell classes. Their results showed that only the α1 mutant, Glra1spd-ot (hereafter referred to as Glra1 mutant), cone OFF bipolar cells and rod ON bipolar cells had significant reductions in glycinergic spontaneous inhibitory postsynaptic currents (Ivanova et al., Reference Ivanova, Muller and Wässle2006).
In summary, it is clear that the GlyRα1 subunit is the direct postsynaptic target of the AII amacrine cell on both rod ON and cone OFF bipolar cells. Although a great deal of information is known about the interactions between bipolar cells and the AII or A17 amacrine cells, significantly, less is known about the role of the other amacrine cell inputs that target bipolar cells, which are estimated to be as high as 70% certain bipolar cell classes (McGuire et al., Reference McGuire, Stevens and Sterling1984; Sterling & Lampson, Reference Sterling, Freed and Smith1986; Strettoi et al., Reference Strettoi, Novelli, Mazzoni, Barone and Damiani1994). Given the results of the survey of spontaneous inhibitory postsynaptic currents across the glycine alpha subunit receptor mutant mice, it is clear that regardless of the identity of the presynaptic amacrine cell, the bipolar cell GlyRα1 subunit is the postsynaptic target. This would imply that if there are differences in the roles of these inputs in shaping the bipolar cell output, they must rely on the characteristics of the type of inhibition, glycine release, or the synaptic/extrasynaptic location, rather than the postsynaptic receptor target.
Amacrine cell classes
Amacrine cells not only provide inhibitory input to bipolar and ganglion cells (described below) but also are targets of other amacrine cells. The amacrine to amacrine cell interactions are thought to provide a rich diversity of modulatory possibilities and complexity in processing the visual image, including contrast (Jarsky et al., Reference Jarsky, Cembrowski, Logan, Kath, Riecke, Demb and Singer2011) and light adaptation (Hermann et al., Reference Hermann, Heflin, Hammond, Lee, Wang, Gainetdinov, Caron, Eggers, Frishman, McCall and Arshavsky2011), direction selectivity (Wei et al., Reference Wei, Hamby, Zhou and Feller2011), as well as other topics discussed in this volume. The 30 different morphological amacrine cell types produce a dilemma as far as defining individual interactions. One strategy is to identify general morphological or functional amacrine cell classes, examine the role of their GABA and glycinergic inhibitory inputs onto postsynaptic cells, and generalize from there. The extent of GABAergic or glycinergic amacrine cell dendritic spread and its correlation with wide- and narrow-field amacrine classes provides one such general categorical approach.
Serial inhibition and synapses indicate amacrine cells as targets of other amacrine cells
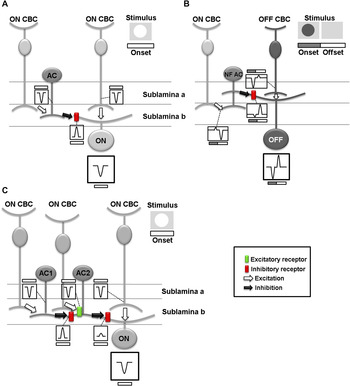
Direct inhibitory input produces outward currents that hyperpolarize the postsynaptic target. In this way, it modulates any excitatory signal and contributes to the magnitude and timing of its target’s output. When this occurs as a result of amacrine cell input to either a bipolar or ganglion cell (Fig. 6A), the result is a decrease in their glutamate release and a generally lower level of excitation in the circuit.
Schematic diagrams of amacrine cell (AC) mediated inhibitory mechanisms that modulate excitatory signaling. Arrows indicate excitatory or inhibitory inputs. Boxes indicate inward or outward currents in the postsynaptic target. Stimuli evoking the response are shown in the upper left corner and also above each current trace. Transient current kinetics are shown for simplicity. (A) Feedforward inhibition: AC inhibitory input to a ganglion cell (GC) induces an outward current in the GC that reduces the cone bipolar cell (CBC) induced inward current and results in less total excitation in the GC than if its response depended solely on CBC input. (B) Crossover inhibition from ON to OFF pathway (N.B. stimulus is a luminance decrement): A signal originating from an ON CBC is transferred via a bistratified, narrow field (NF) AC to an OFF GC. Input from an ON CBC induces an outward current at stimulus onset and an inward current at offset in a NF AC. The NF AC inverts this signal creating in its GC target an inward current at stimulus onset and an outward current at offset. A signal also originates in an OFF CBC creating stimulus evoked currents of the same direction as the NF AC input. These signals reinforce each other, enhancing GC excitation at stimulus onset and inhibition at offset. (C) Serial inhibition: AC1 input generates an outward current in AC2 and modulates its CBC induced inward current. This reduces the total depolarization of AC2, which reduces its inhibitory output to and the magnitude of the outward current in the GC. Figure adapted from Nobles et al. (Reference Nobles, Zhang, Muller, Betz and McCall2012).

Serial inhibition is created when one inhibitory neuron is the postsynaptic target of another inhibitory neuron. As shown in Fig. 6C, if an amacrine cell (AC1) targets another amacrine cell (AC2), its inhibitory output is modulated and should generally heighten excitation in the circuit. Serial GABAergic control of glycinergic output or glycinergic control of GABAergic output has been observed directly in cone bipolar cells (Eggers & Lukasiewicz, Reference Eggers and Lukasiewicz2010; Russell & Werblin, Reference Russell and Werblin2010) and/or indirectly in ganglion cells (Caldwell et al., Reference Caldwell and Daw1978; Wässle et al., Reference Wässle, Schafer-Trenkler and Voigt1986). In this circuit, the target (AC2) inhibitory output is controlled by the balance between its excitatory (ON CBC) and inhibitory (AC1) inputs (Fig. 6C). If the target amacrine cell’s presynaptic inhibition is decreased, then its inhibitory output increases creating a net increase in inhibition within the circuit. There is morphological evidence that glycinergic amacrine cells receive glycinergic inputs (Koontz & Hendrickson, Reference Koontz and Hendrickson1987; Hendrickson et al., Reference Hendrickson, Koontz, Pourcho, Sarthy and Goebel1988; Pourcho & Owczarzak, Reference Pourcho and Owczarzak1991a,Reference Pourcho and Owczarzakb; Haverkamp et al., Reference Haverkamp, Müller, Harvey, Harvey, Betz and Wässle2003, Reference Haverkamp, Muller, Zeilhofer, Harvey and Wässle2004). However, because strychnine is the only glycine antagonist, the opportunity to observe functional glycinergic control of glycine is limited. This also holds true for GABAAR control of GABAAR inputs because bicuculline is the only selective GABAAR antagonist.
In addition to direct and serial synaptic inhibitory mechanisms, a form of inhibition called crossover is found in the retina (discussed below). It is clear that the inner retinal circuitry also may include even more complexity, such as nested feedback or feedforward circuits and concatenated inhibition, which have been observed using the connectome approach (Anderson et al., Reference Anderson, Jones, Watt, Shaw, Yang, Demill, Lauritzen, Lin, Rapp, Mastronarde, Koshevoy, Grimm, Tasdizen, Whitaker and Marc2011). All this provides strong evidence of amacrine cell targets of other amacrine cells. At present, we are only at the threshold of understanding how this complexity is organized and its contribution to visual processing at multiple adaptation levels and signaling modalities.
AII amacrine cells as serial circuit elements
Studies in which the morphology and synaptic inputs to AII amacrine cells have been defined using serial electron microscopic reconstruction show that many conventional synapses along their somas and dendrites (Sterling et al., Reference Sterling and Lampson1988; Kolb et al., Reference Kolb and Nelson1991; Strettoi et al., Reference Strettoi, Dacheux and Raviola1992) are the targets of both GABAergic and glycinergic inputs from amacrine cells (Kolb et al., Reference Kolb and Nelson1991; Grünert & Wässle, Reference Grünert1993). Transgenic reporter mice in conjunction with immunohistochemistry also have been used to demonstrate glycinergic amacrine cell circuits (Majumdar et al., Reference Majumdar, Heinze, Haverkamp, Ivanova and Wässle2007). In their recent Tour de force publication of the connectome of AII amacrine cells in the rabbit retina (Anderson et al., Reference Anderson, Jones, Watt, Shaw, Yang, Demill, Lauritzen, Lin, Rapp, Mastronarde, Koshevoy, Grimm, Tasdizen, Whitaker and Marc2011), Marc and colleagues show numerous instances of synapses on identified AII amacrine cells at every level of the inner plexiform layer. Their results suggest that AII cell lobular appendages in the inner plexiform layer sublamina b (ON) and arboreal dendrites in sublamina a (OFF) are postsynaptic to at least five different amacrine cell classes. Consistent with these morphological data, electrophysiological studies show that both GABAergic and glycinergic currents can be evoked in AII amacrine cells (Boos et al., Reference Boos, Schneider and Wässle1993; Gill et al., Reference Gill, Veruki and Hartveit2006; Veruki et al., Reference Veruki, Gill and Hartveit2007; Weiss et al., Reference Weiss, O’Sullivan, Heinze, Chen, Betz and Wässle2008).
GlyRα subunit contributions to synaptic function via spontaneous inhibitory postsynaptic current analysis have been studied in GlyRα subunit mutant and knockout mice. In the GlyRα3 knockout AII amacrine cells, no glycinergic spontaneous inhibitory postsynaptic currents were recorded and glycine-evoked currents had significantly lower amplitude. Further, glycinergic spontaneous inhibitory postsynaptic currents and evoked currents in both GlyRα2 KO and GlyRα1 mutant AII amacrine cells were similar to wild type. These straightforward results strongly support the hypothesis that the AII amacrine cell synaptic GlyRs are primarily mediated by GlyRα3 subunits. This, however, differs from the conclusion of Veruki and Hartveit and their colleagues (Gill et al., Reference Gill, Veruki and Hartveit2006; Veruki et al., Reference Veruki, Gill and Hartveit2007) who interpret their results in rat AII amacrine cells as a contribution from GlyRα1 receptor subunits. It is possible that both the GlyRα1 and GlyRα3 subunits play a role, but we are left with the mystery of the presence of GlyRα1-like currents in the AII amacrine cells in GlyRα1 mutant mice.
GABAergic currents also have been observed in AII amacrine cells, although their subunit composition has not been defined. As an additional complication, the identity of the exact amacrine cell types that provide the input and the distribution of their inputs have not been defined, although some progress has been made (Anderson et al., Reference Anderson, Jones, Watt, Shaw, Yang, Demill, Lauritzen, Lin, Rapp, Mastronarde, Koshevoy, Grimm, Tasdizen, Whitaker and Marc2011). While the AII receives both glycinergic and GABAergic direct inputs from other amacrine cells, the function of these inputs on its light-evoked response are not clear. Results from Bloomfield and colleagues (Xin & Bloomfield, Reference Xin and Bloomfield1999; Volgyi et al., Reference Volgyi, Xin and Bloomfield2002) suggest that indirect GABAergic inputs modulate the AII receptive field spatial organization but did not observe a role for direct glycinergic or GABAergic inputs. The AII amacrine cells receive inputs from dopaminergic amacrine cells (Voigt & Wässle, Reference Voigt and Wässle1987; Boos et al., Reference Boos, Schneider and Wässle1993; Frech et al., Reference Frech and Backus2001; Zhou & Dacheux, Reference Zhou and Dacheux2004), which are localized to their soma and lobular appendages (Strettoi et al., Reference Strettoi, Dacheux and Raviola1992). GABAARs are located at this synapse, and there is strong evidence that synaptic signaling to the AII receptor is GABAergic, while dopaminergic signaling occurs extrasynaptically (Puopolo et al., Reference Puopolo, Hochstetler, Gustincich, Wightman and Raviola2001; Contini & Raviola, Reference Contini, Lin, Kobayashi, Okano, Masland and Raviola2003). Here too, the exact role of the GABAergic input in light-evoked responses has not been defined, although the control of light adaptation is a well-known role of dopamine (Witkovsky, Reference Witkovsky2004).
Other narrow-field amacrine cells as amacrine cell targets
In the cat, Pourcho and Goebel (Reference Pourcho and Goebel1985) were the first to show that tritiated glycine accumulated in AII, A4, and A8 amacrine cell classes in the cat. Menger et al. (Reference Menger, Pow and Wässle1998) extended this observation to the rat and Heinze et al. (Reference Heinze, Harvey, Haverkamp and Wässle2007) to mouse retinas. As a result, we know that in the retina, there are at least 10 different narrow-field glycinergic amacrine cells and also that GlyRs are found on many of these amacrine cell classes (Pourcho & Owczarzak, Reference Pourcho and Owczarzak1991a,Reference Pourcho and Owczarzakb; Kolb & Nelson, Reference Kolb and Nelson1996; Menger et al., Reference Menger, Pow and Wässle1998; Haverkamp et al., Reference Haverkamp, Müller, Harvey, Harvey, Betz and Wässle2003; Heinze et al., Reference Heinze, Harvey, Haverkamp and Wässle2007; Wässle et al., Reference Wässle, Heinze, Ivanova, Majumdar, Weiss, Harvey and Haverkamp2009). This leads to the conclusions that glycinergic amacrine cells are targets of other glycinergic amacrine cells and that they could participate in serial inhibitory circuits. In particular, type 3 amacrine cells closely localize both GlyRα2 (Wässle et al., Reference Wässle, Heinze, Ivanova, Majumdar, Weiss, Harvey and Haverkamp2009) and GlyRα4 (Heinze et al., Reference Heinze, Harvey, Haverkamp and Wässle2007), although they are unlikely to be expressed at either the same synapse or receptor complex (Wässle et al., Reference Wässle, Heinze, Ivanova, Majumdar, Weiss, Harvey and Haverkamp2009). Using GlyRα mutant/knockout mice, a role for GlyRα2 has been observed as a synaptic target of other narrow-field amacrine cells (e.g., Types 5, 6, and 7; Weiss et al., Reference Weiss, O’Sullivan, Heinze, Chen, Betz and Wässle2008). There is no GlyRα4 knockout. Since GlyRα2 is important to type 3 amacrine cells and because the localization of GlyRα2 and GlyRα4 are close, but not completely aligned, the current view is that GlyRα4 should be a postsynaptic target of a different narrow-field amacrine cell class. All these data are important in defining the location of glycinergic subunit input; however, more work is required before a role for each of the glycine subunits in light-evoked responses will be understood.
GABAA-mediated inhibition controls the amplitude of direct glycinergic inputs to cone OFF bipolar cells and through this serial inhibitory mechanism of wide-field amacrine cells targeting narrow-field amacrine cells tunes not only the magnitude (Eggers & Lukasiewicz, Reference Eggers and Lukasiewicz2006; Eggers et al., Reference Eggers and Lukasiewicz2007), temporal processing (Zhang et al., Reference Zhang, Li, Trexler and Massey1997; Roska et al., Reference Roska, Molnar and Werblin1998), and spatial aspects of bipolar cell signaling (Eggers & Lukasiewicz, Reference Eggers and Lukasiewicz2010). This verifies that narrow-field amacrine cells can be the targets of wide-field amacrine cells via GABA receptors. The exact identity of the presynaptic GABAergic amacrine cells and the receptor composition of the GABAARs awaits discovery. Functionally, these results argue against glycinergic serial circuitry controlling bipolar cell inhibition, but they cannot rule out a narrow field to narrow-field amacrine cell serial circuit that would be exclusively under glycinergic control.
The A17 (S1/S2) wide-field amacrine cell as a target of amacrine cells
There are approximately 20 wide-field amacrine cell classes, which lead to significant heterogeneity of form and function. Generally, wide-field amacrine cells share several similarities: they are primarily GABAergic, frequently express a second neurotransmitter or neuromodulator; they have processes that tend to ramify within an individual inner plexiform sublamina. However, for most amacrine cells, we do not know what GABAA receptors subunits are associated with which morphological or physiological subtypes of amacrine cells. Similarly, we do not yet know whether the subtype configurations play different roles in retinal inhibition.
The A17 amacrine cell’s dendritic field ramifies primarily in sublamina b (ON) of the inner plexiform layer. In the rabbit retina, there are two wide-field amacrine cells S1 and S2 (Sandell & Masland, Reference Sandell and Masland1986; Vaney, Reference Vaney, Nelson and Pow1986; Strettoi et al., Reference Strettoi, Dacheux and Raviola1990). The A17 or S1/S2 amacrine cells are GABAergic (Chun et al., Reference Chun, Han, Chung and Wässle1993), and almost all the varicosities of the S1 and S2 amacrine cells are apposed to postsynaptic GABARs. In every preparation used, these inputs provide reciprocal feedback to the rod ON bipolar cells (described above).
Exogenous application of either GABA or glycine evokes outward currents in A17 amacrine cells (Menger & Wässle, Reference Menger and Wässle2000). Both glycine-evoked and glycinergic spontaneous inhibitory postsynaptic currents of displaced A17 amacrine cells are unaffected by the absence of GlyRα1, GlyRα2, or GlyRα3 subunits (Majumdar et al., Reference Majumdar, Weiss and Wässle2009). When GABAA receptors are blocked by bicuculline, the amplitude of the glycinergic spontaneous inhibitory postsynaptic currents increases, and this disinhibitory response is controlled when excitatory input via the ON pathway is eliminated with L-2-amino-4-phosphonobutyrate (L-APB) (Majumdar et al., Reference Majumdar, Weiss and Wässle2009). This result suggests that the glycinergic inputs to displaced A17 amacrine cells via the ON pathway are part of a serial synapse with a GABAergic amacrine cell, while the inputs via the OFF pathway are controlled by a different inhibitory mechanism. By exclusion of GlyRα1, GlyRα2, or GlyRα3 subunits, these glycine inputs should be mediated by the GlyRα4 subunit. Alternatively, there is a species difference between rats and mice or a difference between normal and displaced A17 amacrine cells. There is no information about these mechanisms in A17 amacrine cells whose somas are found in the INL. Further, we do not know the identity of their presynaptic partners. In rat A17 amacrine cells, bicuculline blocks the light-evoked response to a luminance decrement (Menger & Wässle, Reference Menger and Wässle2000), which suggests a GABAA receptor-mediated input to the A17 that is the target of an OFF wide-field amacrine cell. This is consistent with anatomical studies that show amacrine cell inputs to the A17 in the inner plexiform sublamina b (ON) (Holmgren-Taylor, Reference Holmgren-Taylor1982; Sandell et al., Reference Sandell, Masland, Raviola and Dacheux1989).
The GABAergic/dopaminergic wide-field amacrine cell
Catecholaminergic cells in the retina were first recognized by Ehinger (1976), and subsequently, dopaminergic cells have been described in almost all species (for a review, see Nguyen-Legros, Reference Nguyen-Legros1988). Most of the dopaminergic cells are GABAergic amacrine cells whose somas are located at border of the inner nuclear and plexiform layers and whose processes ramify in sublamina a (OFF) of the inner plexiform layer (Mitrofanis et al., Reference Mitrofanis, Vigny and Stone1988; Wulle & Schnitzer, Reference Wulle and Schnitzer1989). Dopaminergic amacrine cells are presynaptic to AII amacrine cells (Voigt & Wässle, Reference Voigt and Wässle1987; see above). Subsequently, a role for dopamine (released from amacrine cells) as a modulatory neurotransmitter mediating light adaptation was found, and more recently, a role in modulating circadian rhythms also has been shown. Dopaminergic amacrine cells are low in number and sparsely distributed in the inner plexiform layer; however, because they have been targeted in transgenic reporter mice, they have become a focus of study (Gustincich et al., Reference Gustincich, Feigenspan, Sieghart and Raviola1997; Zhang et al., Reference Zhang, Gradinaru, Adamantidis, Durand, Airan, de Lecea and Deisseroth2004; Knop et al., Reference Knop, Feigenspan, Weiler and Dedek2011). It should be noted that two classes of TH::GPF amacrine cells are labeled, but only the type 1 are considered the dopaminergic amacrine cells, as the type 2 cells do not contain dopamine.
Using one of the transgenic reporter mice that have been created, Raviola and colleagues observed that dopaminergic amacrine cells were targets of AII, as well as other unidentified amacrine cells (Gustincich et al., Reference Gustincich, Feigenspan, Sieghart and Raviola1997), which was consistent with previous reports in other mammalian retina (Dowling & Ehinger, Reference Dowling and Ehinger1978; Pourcho, Reference Pourcho1982; Pourcho & Goebel, Reference Pourcho and Goebel1985; Kolb et al., Reference Kolb, Cuenca, Wang and Dekorver1990, Reference Kolb and Nelson1991). Using a dissociated cell preparation in the same transgenic reporter mouse line, exogenous application of GABA or glycine hyperpolarized identified dopaminergic amacrine cells whose GABAergic currents were mediated by GABAARs. The composition of the GABAARs expressed by the dopaminergic amacrine cells included: α1, 3, and 4; β1 and 3; γ1 and 2s and 2l (Gustincich et al., Reference Gustincich, Feigenspan, Wu, Koopman and Raviola1999; Feigenspan et al., Reference Feigenspan, Gustincich and Raviola2000). Both glycinergic and GABAergic inputs have been found to influence the light-evoked responses of type 2 TH::GPF wide-field amacrine cells (Knop et al., Reference Knop, Feigenspan, Weiler and Dedek2011), although the direct or indirect nature of these inputs has not as yet been defined. A role for D1 receptors has recently been shown to be critical in the dopaminergic control of a GABAergic signal via GABACRs on rod ON bipolar cells (Hermann et al., Reference Hermann, Heflin, Hammond, Lee, Wang, Gainetdinov, Caron, Eggers, Frishman, McCall and Arshavsky2011). Functionally, the circuit enhances light sensitivity and increases operating range of rod-driven bipolar cells at dim light levels. While the exact location of the synapse remains to be discovered, it could result from a novel dopaminergic to GABAergic amacrine serial synaptic mechanism. Equally plausible is an outer retinal mechanism where GABAergic inputs from horizontal cells target rod ON bipolar cells.
The GABAergic/cholinergic wide-field starburst amacrine cell
Majumdar et al. (Reference Majumdar, Weiss and Wässle2009) showed that the spontaneous inhibitory postsynaptic currents in GlyRα1, GlyRα2, and GlyRα3 mutant ON starburst amacrine cells were similar to wild type. They concluded that synaptic glycinergic inputs must then be mediated by the GlyRα4 subunit, which was consistent with immunohistochemical analyses that demonstrated that ON, but not OFF cholinergic amacrine cells express GlyRα4 (Heinze et al., Reference Heinze, Harvey, Haverkamp and Wässle2007). There is good evidence that these amacrine cells release both GABA and acetylcholine (O’Malley & Masland, Reference O’Malley and Masland1989), whether co-release occurs or the neurotransmitters are released under different conditions is unknown.
Displaced medium- and wide-field GABAergic amacrine cells
Approximately 60% of the cells in the ganglion cell layer are displaced amacrine cells, and the overwhelming majority of these cells are GABAergic medium to wide-field cells (Jeon et al., Reference Jeon, Strettoi and Masland1998; Perez de Sevilla Muller et al., Reference Perez de Sevilla Muller, Shelley and Weiler2007). Since they were first recognized in the cat retina (Hughes & Wieniawa-Narkiewicz, Reference Hughes and Wieniawa-Narkiewicz1980), these amacrine cells have been found in many other species and form somewhere between 4 and 17 different classes depending on species and technique for identification (Perry & Walker, Reference Perry and Walker1980; Wässle et al., Reference Wässle and Chun1987; Gustincich et al., Reference Gustincich, Feigenspan, Sieghart and Raviola1997; Jeon et al., Reference Jeon, Strettoi and Masland1998; Badea & Nathans, Reference Badea and Nathans2004; Lin & Masland, Reference Lin and Masland2006; Perez de Sevilla Muller et al., Reference Perez de Sevilla Muller, Shelley and Weiler2007). While the majority of publications have focused on their morphological characterization, a recent survey compared GlyRα subunit expression on 11 different displaced amacrine cell morphological classes in GlyRα mutant and knockout mice to wild type (Majumdar et al., Reference Majumdar, Weiss and Wässle2009). Exogenous GABA application evoked currents in all displaced amacrine cells, while their glycinergic responses grouped them into one of three general types. GlyRα1 and GlyRα3 subunits do not appear to mediate glycinergic currents in displaced amacrine cells, because wild type, GlyRα1 mutant and GlyRα3 knockout displaced amacrine cell types, including A17 and ON starburst amacrine cells, had similar glycine-evoked currents. In contrast, GlyRα2 subunits are likely to mediate glycinergic-evoked currents in a variety of displaced amacrine cells that include: ON starburst, a medium field amacrine cell that ramifies in S5, a polyaxonal amacrine cell that ramifies in S4, a wide-field amacrine cell that ramifies in S3 and a multistratified amacrine cell. This result is consistent with the observations of Veruki et al. (Reference Veruki, Gill and Hartveit2007) on rat wide-field amacrine cells that stratified in S2, S3, or S4 with spontaneous inhibitory postsynaptic currents whose decay was significantly slower than AII amacrine cells (Gill et al., Reference Gill, Veruki and Hartveit2006), representing the slower receptor kinetics of GlyRα2 relative to GlyRα1, respectively. Together, the results suggest a role for GlyRα2 subunit-mediated inhibition modulating GABAergic displaced amacrine cells and potentially a role in serial inhibitory mechanisms modulating lateral spatial interactions.
Much work remains on amacrine cell to amacrine cell modulation. The construction and/or identification of transgenic reporter mouse lines specific for amacrine cell classes will be instrumental in the exploration of the complexities of these circuits. The same is true for the use of currently available mutant and knockout mice. Finally, when the track tracing capacity of pseudorabies (Viney et al., Reference Viney, Balint, Hillier, Siegert, Boldogkoi, Enquist, Meister, Cepko and Roska2007) or other viruses is harnessed, this avenue too will provide new insights into the connectivity of amacrine to amacrine cell circuits.
Ganglion cells
Morphological studies of both GABAergic and glycinergic amacrine cell inputs to ganglion cells
Similar to the amacrine cells, ganglion cells also are morphologically and functionally diverse. Ganglion cells have been grouped morphologically by their dendritic ramification patterns in the inner plexiform layer ON and OFF sublaminae (b and a, respectively), and this has been shown to be tightly correlated with their functional excitatory responses to luminance increments and decrements and thus their receptive field center sign (ON or OFF). Ganglion cells also have been divided morphologically on the basis of soma diameter, dendritic field size, and branch pattern (Rowe & Stone, Reference Rowe and Stone1977; Rodieck & Brening, Reference Rodieck and Brening1983; Rockhill et al., Reference Rockhill, Daly, MacNeil, Brown and Masland2002; Sun et al., Reference Sun, Li and He2002; Coombs et al., Reference Coombs, van der List, Wang and Chalupa2006). The cat followed by the rabbit and primate retinas are the best studied models with respect to correlations between ganglion cell structure and function (Wässle & Boycott, Reference Wässle and Boycott1991), the inputs of bipolar cell and amacrine cell inputs (see description below) as well as the central targets of their axonal projections (Berson et al., Reference Berson, Isayama and Pu1998, Reference Berson, Pu and Famiglietti1999; Isayama et al., Reference Isayama, Berson and Pu2000; Hattar et al., Reference Hattar, Kumar, Park, Tong, Tung, Yau and Berson2006). In these species, serial reconstruction of portions or the entire dendritic arbor at the electron microscopic level indicate that both X- and Y-cells (the morphologically equivalent to beta and alpha ganglion cells) are synaptic targets of amacrine cells (see discussion Weber et al., Reference Weber, McCall and Stanford1991). Several studies have examined the detailed location of amacrine cell inputs at the electron microscopic level, which appear to be distributed equally across the ganglion cell dendritic tree (Kolb, Reference Kolb1979; Watanabe et al., Reference Watanabe, Fukuda, Hsiao and Ito1985; Weber et al., Reference Weber, McCall and Stanford1991; Kolb & Nelson, Reference Kolb and Nelson1993; Weber & Stanford, Reference Weber and Stanford1994). When Freed and Sterling (Reference Freed, Smith and Sterling1988) labeled cells with tritiated glycine, they noted that 19% of the labeled cells provided inputs to an ON Alpha ganglion cell and that they formed an annular ring around on its dendritic field. In contrast, Owczarzak & Pourcho, Reference Owczarzak and Pourcho1999 found a more equal distribution of both GABAergic and glycinergic inputs onto an OFF Alpha ganglion cell. Another specialization noted in these studies is that serial amacrine cell synapses are more frequently associated with OFF- and not ON-center cat X-cells (Weber et al., Reference Weber, McCall and Stanford1991; Kolb & Nelson, Reference Kolb and Nelson1993; Weber & Stanford, Reference Weber and Stanford1994). There remains no resolution to the discrepancies across the studies. Given more recent evidence of multiple subunit types of GABAA and GlyRs and differences in their kinetics, the simple approach used initially is probably inadequate to resolve the issue. Whether all or any of these results represent real differences across ganglion cell classes awaits further confirmation.
Immunohistochemical studies demonstrate that both GABAA and GlyR subunits are localized to ganglion cell dendrites (e.g., Greferath et al., Reference Greferath, Grünert, Fritschy, Stephenson, Mohler and Wässle1995; Grünert, Reference Grünert and Wässle2000), with the primary cells studied the alpha and/or A-type ganglion cells. Thus, these ganglion cell receptors are localized to potentially mediate direct amacrine cell inhibitory inputs (Koulen et al., Reference Koulen, Brandstatter, Enz, Bormann and Wässle1996; Wässle et al., Reference Wässle, Koulen, Brandstatter, Fletcher and Becker1998). GlyRα1 is the primary receptor subunit located on alpha/A-type ganglion cells in cat, rat, and mouse (Koulen et al., Reference Koulen, Brandstatter, Enz, Bormann and Wässle1996; Wässle et al., Reference Wässle, Koulen, Brandstatter, Fletcher and Becker1998; Rotolo & Dacheux, Reference Rotolo and Dacheux2003b; Majumdar et al., Reference Majumdar, Heinze, Haverkamp, Ivanova and Wässle2007). Similarly, GABAA receptor α1, α2, α3, and β2/3 subunits also are localized on these ganglion cells (Koulen et al., Reference Koulen, Brandstatter, Enz, Bormann and Wässle1996; Wässle et al., Reference Wässle, Koulen, Brandstatter, Fletcher and Becker1998).
Electron microscopic studies of the types of inputs to mouse ganglion cells lag behind other species. One reason is the fairly uniform mouse ganglion cell soma diameters, which make targeting a specific class like the alpha ganglion cells of other mammals more difficult. In addition, in the mouse, there are a number of morphological similarities across the three A-type ganglion cells by comparison to a single alpha cat ganglion cell class in other mammals. This has led to a controversy about the true mouse homologue of cat alpha ganglion cells (Majumdar et al., Reference Majumdar, Heinze, Haverkamp, Ivanova and Wässle2007), although the observations of van Wyk et al. (Reference Vaney2009) may solve this dilemma. The advent of many new ganglion cell reporter mouse lines with what appear to be labeled specific ganglion cell populations (Siegert et al., Reference Siegert, Scherf, Del, Didkovsky, Heintz and Roska2009) combined with the connectomics approach described above may tease out the pattern of class-specific amacrine cell inputs within and across ganglion cell populations.
Functional studies of ganglion cell targets of both GABAergic and glycinergic amacrine cells
Because of the increasing synaptic complexity, the functional dissection of specific ganglion cell classes as targets of general, much less individual amacrine cells types becomes increasingly difficult. This increasing complexity has a positive side in that it creates a variety of visual response properties in ganglion cells and entire reviews could and have been written about each aspect, for example, contrast or intensity gain control (Beaudoin et al., Reference Beaudoin, Borghuis and Demb2007; Demb, Reference Demb2008), signaling through the multiple rod and cone pathways (Protti et al., Reference Protti and Llano2005; Manookin et al., Reference Manookin, Beaudoin, Ernst, Flagel and Demb2008), edge detection (Russell & Werblin, Reference Russell and Werblin2010), approach sensitivity (Munch et al., Reference Munch, da Silveira, Siegert, Viney, Awatramani and Roska2009), and direction selectivity (Demb, Reference Demb2007; Zhou & Lee, Reference Zucker and Yazulla2008; Elstrott & Feller, Reference Elstrott and Feller2009). To focus this last section, we will only discuss the more general aspects of amacrine cell inputs to ganglion cells and their impact on receptive field center surround organization.
Although there are several early reports on the roles of GABA and glycine inputs in the spiking activity of ganglion cells (Kirby & Enroth-Cugell, Reference Kirby and Enroth-Cugell1976; Caldwell & Daw, Reference Caldwell, Daw and Wyatt1978; Kirby & Schweitzer-Tong, Reference Kirby and Schweitzer-Tong1981), results varied considerably and little in the way of a cohesive picture of the action of GABA and/or glycine emerged (See Bolz et al., Reference Bolz, Thier, Voigt and Wässle1985Reference Bolz, Thier, Voigt and Wässlea,b). More recent in vitro experiments have begun to produce a more consistent picture. As expected from morphological and immunohistochemical results, both GABAergic and glycinergic amacrine cell inputs can be recorded or elicited in ganglion cells (Bolz et al., Reference Bolz, Thier, Voigt and Wässle1985Reference Bolz, Thier, Voigt and Wässlea,b; reviewed in Wässle & Boycott, Reference Wässle and Boycott1991; Protti et al., Reference Protti, Flores-Herr, Li, Massey and Wässle1997; Tian et al., Reference Tian, Hwang and Copenhagen1998; Rotolo & Dacheux, Reference Rotolo and Dacheux2003b). Generally, both GABAergic and glycinergic amacrine cell inputs modulate the spontaneous and visually evoked responses of ganglion cells, and there are many examples of a role for inhibition in both receptive field center and surround responses. A general rule of thumb is that lateral inhibition leading to surround antagonism is modulated by GABAergic inputs in the majority of ganglion cells (Protti & Llano, Reference Protti, Gerschenfeld and Llano1998; Hartveit, Reference Hartveit1999; Flores-Herr et al., Reference Flores-Herr, Protti and Wässle2001; O’Brien et al., Reference O’Brien, Richardson and Berson2003; Roska et al., Reference Roska, Nemeth and Werblin2006). Iontophoretic application of GABA suppressed both the spontaneous and light-evoked activity of most ganglion cells (Bolz et al., Reference Bolz, Frumkes, Voigt and Wässle1985b). Consistent with these changes, the GABA antagonist, bicuculline, enhanced spontaneous activity and light-evoked activity of ON ganglion cells. In contrast, bicuculline suppressed the spontaneous activity of OFF ganglion cells and produced intensity-dependent effects on the evoked response. These and subsequent findings (O’Brien et al., Reference O’Brien, Richardson and Berson2003) suggest a serial amacrine cell-mediated inhibitory circuit in which GABA modulates a direct inhibition (potentially glycinergic) onto ganglion cells.
In contrast, to the spatial modulation of GABA, glycine inputs are generally associated with shaping ganglion cell temporal response characteristics. Bolz et al. (Reference Bolz, Thier, Voigt and Wässle1985a) found that glycine and strychnine’s effects were more complicated than GABA with respect to the spatial organization of the ganglion cell receptive field. Compared to the sensitivity of the initial phasic response component to GABAergic input, the more tonic response component was modulated by glycine. Consistent with this aspect of response control, among the GABAergic and glycinergic spontaneous inhibitory postsynaptic currents the decay kinetics of GABAA current are generally faster than glycine spontaneous inhibitory postsynaptic currents (Protti et al., Reference Protti, Flores-Herr, Li, Massey and Wässle1997). While no direct test of correspondence between kinetics and temporal tuning has been performed, it is tempting to hypothesize that there will be a temporal match similar to that observed in bipolar cell circuits (discussed above). As has been noted in bipolar cells (Eggers & Lukasiewicz, Reference Eggers, McCall and Lukasiewicz2011), the timing of light-evoked glycinergic inhibition is very slow relative to even the slowest of the receptor kinetics of the GlyRα4 subunit. In addition, the timing of crossover inhibition (discussed below) also appears to be sustained. These results suggest that the postsynaptic receptor subunit combination may not be the sole determinant of the timing of inhibition. This leaves open the question, what is the mechanism(s). Potentially, differential properties of neurotransmitter release, for example, synchronous versus asynchronous release, could be responsible and would add even more diversity to signaling from amacrine cells.
As a general rubric, the current thinking is that at the level of the ganglion cells, GABAergic inputs primarily mediate lateral inhibitory mechanisms and contribute to their receptive field spatial tuning. This is well suited to the morphology of these wide-field GABAergic amacrine cells that ramify narrowly within an inner plexiform layer sublamina. In contrast, the tuning of the ganglion cell temporal response (e.g., sustained vs. transient) is likely modulated by glycinergic receptor inputs, although the sustained/transient nature of their excitatory input from bipolar cells is modulated by GABACR inputs (Dong & Werblin, Reference Dong and Werblin1998). The next section describes crossover inhibition, a mechanism in which glycinergic amacrine cells in the ON pathway modulate the excitatory responses of ganglion cells in the OFF pathway and vice versa.
The ganglion cell as the target for glycinergic crossover inhibition
To account for morphological observations as well as functional results that indicate a role for disinhibition in the control of ganglion cell receptive field organization, McGuire et al. (Reference McGuire, Stevens and Sterling1986) proposed a push–pull mechanism in which the ON and OFF pathways could interact to influence the spiking responses of ganglion cells. This hypothesis predicted both excitatory and inhibitory bipolar cell inputs to ganglion cells and was based in part on the observation that a subset of OFF bipolar cells accumulated glycine (Nakamura et al., Reference Nakamura, Tokunaga and Yoshizawa1978; Pourcho, Reference Pourcho1980). Subsequently, the glycine accumulation has been accounted for by gap junctional diffusion from amacrine cell to ON bipolar cells (Vaney et al., Reference van Wyk, Wässle and Taylor1998), and no evidence of inhibitory inputs from OFF bipolar cells has been found. However, functional effects consistent with this hypothesis continued to be found (Bolz et al., Reference Bolz, Thier, Voigt and Wässle1985a; O’Brien et al., Reference O’Brien, Richardson and Berson2003; Roska et al., Reference Roska, Nemeth and Werblin2006; Molnar et al., Reference Molnar and Werblin2009; van Wyk et al., Reference Vaney2009; Chen et al., Reference Chen, Hsueh, Greenberg and Werblin2010), and the push–pull mechanism was replaced by the idea of cross talk from the OFF and ON pathways to ON and OFF ganglion cells, respectively. This mechanism has become commonly referred to as cross talk or crossover inhibition (Roska et al., Reference Roska, Nemeth and Werblin2006; Molnar et al., Reference Molnar and Werblin2009; van Wyk et al., Reference Vaney2009; Chen et al., Reference Chen, Hsueh, Greenberg and Werblin2010). The circuit mechanisms have been explored in these studies, and generally: (1) crossover inhibition can originate in either the ON or the OFF pathway, (2) glycine is usually the neurotransmitter involved in this form of inhibition, and (3) the mechanism occurs at all levels of interaction between narrow-field amacrine cells and their postsynaptic targets, bipolar cells, other amacrine cells, and ganglion cells (see Werblin, Reference Werblin2010, for a review). In most cases, crossover inhibition enhances the ganglion cell responses both to luminance increases and decreases (Fig. 6B—for OFF to ON pathway crossover inhibition). This occurs because the crossover inhibitory input creates a final current in the postsynaptic cell that is in the same polarity as the current produced by the direct excitatory input from the bipolar cell at both luminance increase and decrease. Thus, in Fig. 6B, an inward current arises in OFF ganglion cells from OFF bipolar cell excitatory input initiated by a luminance decrement. This is augmented by a crossover-mediated inward current that arises because of a reduction of inhibition in the ON pathway evoked by the same stimulus. In most of these experiments, the effect of the ON pathway onto the OFF pathway has been better documented, mainly because signaling through the ON bipolar cells can be eliminated by application of L-APB. An equivalent exploration of the influence of the OFF pathway onto the ON awaits a strategy or a mutant with OFF pathway signaling eliminated.
The exact role of glycinergic inhibition in ganglion cells also has been pursued using GlyR subunit mouse mutants and knockouts. The first mutant studied was the spastic mouse (later found to be a mutation of GlyRβ; Kingsmore et al., Reference Kingsmore, Giros, Suh, Bieniarz, Caron and Seldin1994). In the retina, fewer GlyRs were expressed (Stone & Pinto, Reference Stone and Pinto1992), and under dark-adapted levels, ganglion cells lacked receptive field surround-type responses, even when annular stimuli were used. They also found that the majority of the spastic ganglion cell responses were very transient (regardless of stimulus intensity), which was consistent with the observations of Bolz et al. (Reference Bolz, Thier, Voigt and Wässle1985a). These results and their observations of a significant decline in GlyR expression are suggestive of a role of glycine in the changes observed in ganglion cell responses (Pinto et al., Reference Pinto, Grünert, Studholme, Yazulla, Kirsch and Becker1994). However, a decline in GABAA receptors also was subsequently noted in the spastic mutant retina (Yazulla et al., Reference Yazulla1997). Using GlyRα1, GlyRα2, and GlyRα3 mouse mutants and knockouts, the distribution of glycine-evoked and spontaneous glycinergic spontaneous inhibitory postsynaptic currents in A-type ganglion cells were surveyed (Majumdar et al., Reference Majumdar, Heinze, Haverkamp, Ivanova and Wässle2007). In the GlyRα1 mutant mouse, very few spontaneous inhibitory postsynaptic currents were observed. In contrast, results for the ganglion cell spontaneous inhibitory postsynaptic currents in GlyRα2 and GlyRα3 knockouts were similar to wild type controls. Together, these results strongly support the conclusion that direct synaptic inputs mediated by GlyRα1 are the most common on A-type ganglion cells.
The next steps in the exploration of the roles of glycine in ganglion cell function will come when the role of each subunit input is determined in the spontaneous and visually evoked responses of the ganglion cells, using these mutant mice. While it may prove important for all subunits, a conditional knockout of GlyRα1 in bipolar cell, as well as, in ganglion cell expression will be required. Partially because GlyRα1 mutants do not survive to adulthood and particularly because the GlyRα1 subunit modulates not only the bipolar cell excitatory output but also direct ganglion cell inhibitory input. Since both these will alter the ganglion cell response, an eye-specific mutant will not parse out their individual roles.
Challenges exist in defining the selective roles of GABAARs in ganglion cell function, similar to the challenges in defining their roles in bipolar and amacrine cell function. We lack a good understanding of the exact subunit compositions that exist in the retina in general. We do not know if GABAARs can swap subunits when expression of the native subunit is absent. These two issues alone require a significant effort and will be required before GABAAR subunit knockouts can be used in experimental paradigms similar to those described for the GlyR subunits above.
Conclusions
The retinal circuit becomes increasingly complex as signaling moves through the inner plexiform layer from the bipolar cells to the ganglion cells. Within this layer synaptic connections are made between and among bipolar, amacrine cells, and ganglion cells, some of which consist of interconnecting ensembles. Even with the advanced morphological and electrophysiological techniques discussed above, there remain limitations in our understanding of the roles of amacrine cell inputs to their targets at every level. A primary limitation in sorting out the impact of amacrine cell input as has been discussed above is the absence of subunit-specific pharmacological agents for both GABAA and GlyRs. This by no means detracts from these studies and what has been learned. It only serves to point out that what we know is limited to: (1) the few retinal classes that we can most easily target, the most proximal amacrine cell GABAA and glycinergic inputs onto those cells, obtained using bicuculline and strychnine and (2) the role of the input through the ON pathway driving those inhibitory inputs because it can be eliminated using L-APB. The increasing numbers of transgenic and viral vector-mediated reporter mice along with the use of two-photon microscopy will enable us to target select cell populations for more in depth studies. The development of new pharmacological agents, the use of subunit-specific GABAA and glycine knockout and mutant mice, and the development of their conditional knockouts will provide new insights into the specific roles of the most common receptor configurations in spontaneous and visually evoked responses of retinal cells at all levels of processing. In order to discover the equivalent role of input through the OFF pathway, we need new tools to eliminate signaling. Each of these new avenues will not be without their challenges. Finally, new approaches are already on the horizon that hold great potential as tools for exploring the complexity of synaptic configurations in the inner plexiform layer and include the connectomics approach described earlier (Anderson et al., Reference Anderson, Jones, Watt, Shaw, Yang, Demill, Lauritzen, Lin, Rapp, Mastronarde, Koshevoy, Grimm, Tasdizen, Whitaker and Marc2011; Briggman et al., Reference Briggman, Helmstaedter and Denk2011), optogenetics for light stimulation to control the initiation of signaling in subcircuits (Zhang et al., Reference Zhang, Jung and Slaughter2010), and, in a similar vein, the examination of the projection field of individual cells using electrical stimulation (de Vries et al., Reference de Vries, Baccus and Meister2011).
Acknowledgments
This work was supported by NIH-RO1-EY014701 (MAMc).