INTRODUCTION
Cotton (Gossypium hirsutum L.) is a major crop in the southern United States. The State of Tennessee cultivates approximately 550,000–650,000 acres of cotton per year, with the most grown in the western region of the state (Main, Reference Main2012). After water, N may be considered the second limiting factor for crop growth. While low N application reduces yield and quality of cotton, excessive N application causes rank growth, delayed maturity, difficult defoliation and low yield and poor lint quality. Additionally, excessive N fertilization may lead to nitrate leaching and thus water pollution. Consequently, matching N application rate and timing with cotton N needs based on soil N availability and crop N requirement is essential to optimize N use efficiency and cotton yield and profit. Timely monitoring of plant N nutrition status and appropriate N application is a key management practice for cotton production. Because conventional soil testing and plant analysis for N during the growing season are time consuming due to sample preparation and shipping and laboratory assay, and often such analyses cannot provide the results back to producers on time, new rapid and non-destructive technologies have received increasing attention during the last decade.
Optical sensing technology, as a quick, nondestructive, high-resolution and large scale measurement of plant canopy radiation reflection, can be used to monitor N nutrition status, plant growth and crop yield. Normalized difference vegetative index (NDVI) is based on the visible red light (660 nm) and near-infrared (780 nm) reflected from crop canopy (Drissi et al., Reference Drissi, Goutouly, Forget and Gaudillere2009; Gutierrez et al., Reference Gutierrez, Norton, Thorp and Wang2012). There is usually a good relationship between NDVI and plant biomass, leaf N nutrition and crop yield. As an example, NDVI could be used to predict cotton yield at peak bloom (Gutierrez et al., Reference Gutierrez, Norton, Thorp and Wang2012). Yin and McClure (Reference Yin and McClure2013) noticed that corn growth and N nutrition could be assessed and corn yield could be predicted with combined NDVI and plant height measurements. Ma et al. (Reference Ma, Dwyer, Costa, Cober and Morrison2001) reported that canopy reflectance provided a reliable, fast, repeatable indicator for screening and ranking soybean genotypes because of the relationship between NDVI and grain yield. Zhou and Yin (Reference Zhou and Yin2014) found that NDVI was more appropriate for predicting cotton yield than cotton N nutrition status during the growing season. Leaf chlorophyll content is another useful index to assess the plant vigor and leaf N level (Seemann et al., Reference Seemann, Sharkey, Wang and Osmond1987) and soil plant analysis development (SPAD) chlorophyll meter (Minolta SPAD-502) is a non-destructive analytical tool based on radiation absorbance by leaves in the red and near-infrared regions (650 and 940 nm). As SPAD readings have an indirect and close relationship with leaf N concentration and leaf chlorophyll concentration (Debaeke et al., Reference Debaeke, Route and Justes2006; Rorie et al., Reference Rorie, Purcell, Morteza, Karcher, King, Marsh and Longer2011), the meter has been used on various crops as a quick and reliable method for N management (Saleh, Reference Saleh2012; Vollmann et al., Reference Vollmann, Walter, Sato and Schweiger2011). Bronson et al. (Reference Bronson, Chua, Booker, Keeling and Lascano2003) already reported a good relationship between SPAD reading and leaf N concentration in cotton leaves. While the optical sensor averages readings from the entire crop canopy, the SPAD meter measures only one specific spot on a leaf. Furthermore, optical sensors can be installed on ground-based applicators (Stone et al., Reference Stone, Solie, Raun, Whitney, Taylor and Ringer1996), while SPAD meters cannot.
Petiole sap testing for nitrate‒N (NO3−‒N) concentration is a conventional tissue testing method for crop N management. Previous research has demonstrated that nitrate‒N is a better indicator of N nutrition compared to total N concentration in geranium (Woodson and Boodley, Reference Woodson and Boodley1983). Since NO3‒‒N concentration in the plant is often highest in the petiole or midrib sections, those parts are used as the sap source in most crops (Maynard and Barker, Reference Maynard and Barker1972). A linear relationship has been found between dry petiole NO3−‒N and petiole sap NO3−‒N concentration (Errebhi et al., Reference Errebhi, Rosen and Birong1998). A portable electrode known as a Cardy meter (Horiba, Ltd. Kyoto, Japan) has been developed within the last decade, which can directly and swiftly measure NO3‒‒N concentration in fresh samples of petiole sap to improve N management. The main advantage with this method is the short time required for sap tissue analyses. McConnell et al. (Reference McConnell, Baker, Millerm, Frizzell and Varil1993) reported that petiole NO3−‒N was primarily influenced by N rate and was a good indicator of cotton N status. However, petiole sap NO3−‒N concentration testing method has some limitations, such as poor calibration, high sensitivity to environmental conditions and difficulties in maintenance (Smith et al., Reference Smith, Silvertooth and Norton1998).
Some researchers have compared different tools for evaluating plant N nutrition status and guiding N fertilizer applications. Rosolem and Mellis (Reference Rosolem and Mellis2010) found that both the SPAD meter and petiole sap NO3−‒N concentration testing could be used to estimate N nutrition status of cotton as early as the third week of flowering. Farneselli et al. (Reference Farneselli, Benincase and Tei2010) revealed that the petiole sap NO3−‒N testing is more sensitive and reliable in assessing N status than the SPAD meter. When petiole sap NO3−‒N concentration was compared with SPAD reading for the N status of potato, the results indicated that petiole NO3−‒N concentration was more sensitive, although not as stable as SPAD reading (Wu et al., Reference Wu, Wang, Rosen and Bauer2007). So far, little information is available on the comparisons of NDVI and SPAD reading with the conventional petiole sap NO3−‒N concentration testing in assessing plant N nutrition, plant biomass, and cotton yield. The main objective of this study was to compare the relationships of NDVI, SPAD reading and petiole sap NO3−‒N concentration with leaf N nutrition, plant biomass and yield of cotton at the key growth stages under a long-term no-tillage production system.
MATERIALS AND METHODS
Site description and experimental design
The data used for this study were collected in 2013 from an existing long-term tillage/cover crop/N rate experiment on cotton, which was conducted continuously for 33 years since 1981 on a Lexington silt loam (fine-silty, mixed thermic typic Paleudalf) without irrigation on the University of Tennessee, West Tennessee Research and Education Center at Jackson, TN, USA (N 35°63′12″,W 88°85′40″,altitude 120.48 m). The experimental design was in split-plot with four replications. The following four N rates (0, 34, 67 and 101 kg N ha−1) interacted with two cover conditions (no cover crop and hairy vetch crop) under no tillage. The N rates were main plot and cover conditions were split-plot. Mean monthly air temperature and rainfall during the growing season (May–October) of 2013 are shown in Supplementary figure S1 (available online at http://dx.doi.org/10.1017/S0014479717000229).
Hairy vetch (Vicia villosa) was planted on 25 Oct. 2012 at a seeding rate of 22 kg ha−1. A burndown herbicide was used to kill the cover crop on 8 May 2013. Cotton (G. hirsutum L.) cv. PHY 375 WRF was planted at a density ≈135,860 plants ha−1 on 16 May 2013. The split plot size was 9.1 m long and 7.7 m wide, and consisted of eight rows of cotton. Ammonium nitrate was manually and uniformly broadcast applied on the soil surface on 24 May 2013. Cotton yields were manually taken from the two centre rows of each split plot on 23 Oct 2013 and ginned with a 20 saw gin.
Sampling and measurements
A composite soil sample (10 cores per sample, 2.5 cm in diameter) was collected randomly from each split-plot at 0–15-cm depth at the early square, mid-bloom and late bloom growth stages (Oosterhuis, Reference Oosterhuis, Miley and Oosterhuis1990) for soil inorganic N determination. After the samples were air-dried, ground to pass through a 2 mm sieve, and thoroughly mixed, they were analysed by the Brookside Laboratories Inc. (New Bremen, OH) for NH4+-N and NO3−‒N with the Mehlich 3 method (Mehlich, Reference Mehlich1984).
Canopy NDVI, SPAD meter reading and petiole sap NO3−‒N concentration were taken on the same day at the early square, early bloom, mid-bloom and late bloom growth stages (Oosterhuis, Reference Oosterhuis, Miley and Oosterhuis1990) on 10 July, 25 July, 6 August and 29 August, respectively. Canopy NDVI readings were taken from the middle 3.0 to 3.6 m of the two centre rows in each split-plot using a hand-held GreenSeeker™ optical sensor (Trimble, Ukiah, CA, USA) by positioning it 81 cm above the canopy. The average NDVI value was calculated for each split-plot. The SPAD readings were taken with a Minolta SPAD-502 meter (Minolta Crop., Osaka, Japan) on the fourth uppermost fully-expanded mature leaf from apex (Warner and Burke, Reference Warner and Burke1993). Measurements were taken at a central position on the leaflet and the midrib was avoided. Fifteen leaves were tested randomly in the two centre rows of each split-plot and averaged to a single SPAD value.
A composite leaf sample, consisting of 15 fully-expanded mature leaves from the fourth upmost position of the apex, was collected randomly from each split-plot (Smith et al., Reference Smith, Silvertooth and Norton1998) and divided into two parts, petiole and leaf blade. The fresh petioles were subsequently cut to a manageable size and placed them in the press to extract sap. Four to five drops of the extract sap were placed directly on the sensor of a Cardy nitrate meter (Horiba, Ltd., Kyoto, Japan) for nitrate–N analyses (Rosolem and Mellis, Reference Rosolem and Mellis2010). Every sample was repeated three times. The Cardy meter was recalibrated with a two-point calibration after every 15 measurements. Potassium nitrate (KNO3) and sodium sulfate (Na2SO4) standards of 300 and 5000 ppm were used to perform the calibrations. The 4th leaf blade samples were dried at 65 °C for at least 72 h and ground through a 20-mesh screen with a Wiley-type mill. Nitrogen concentration in these leaf blade samples was determined using the dry combustion method with a Leco TruSpec C and N Analyzer (Leco, St. Joseph, MI, USA) (Al-Kaisi et al., Reference Al-Kaisi, Yin and Licht2005). Additionally, aboveground plant biomass was collected by randomly cutting five plants in the two centre rows from each split-plot at the early square, mid-bloom and late bloom growth stages.
The 2013 growing season was generally normal from cotton planting to harvest in terms of weather conditions and cotton yield level and the focus of this study was on the comparisons of the three methods (NDVI, SPAD reading and petiole sap NO3−‒N concentration) for assessing N nutrition and plant biomass and predicting cotton yield.
Statistical analysis
Analysis of variance was performed with the MIXED procedure in SAS for Windows v9 (2) (SAS Institute, Cary, NC, USA) (Littell et al., Reference Littell, Milliken, Stroup and Wolfinger1996). For NDVI, SPAD readings and petiole sap NO3−‒N data, the sources of variation with fixed effects included N rates, cover conditions, growth stages and their interactions. Replication, the interactions of replication × N rates, replication × cover conditions and replication × N rates × cover conditions were considered random effects. Treatment means were separated with the least significant difference (LSD) in the MIXED procedure at a 0.05 significant level for all the analyses.
Pearson product–moment correlation coefficients were calculated between NDVI, SPAD reading and petiole sap NO3−‒N concentration across growth stages. Regression analyses with the 4th leaf N concentration, plant biomass and lint yield as dependent variables and NDVI, SPAD reading and petiole sap NO3−‒N as independent variables were conducted with PROC GLM in SAS under a quadratic model (y = a + b × x + c × x 2) based on a previous study (Yin et al., 2011). Regression analyses of NDVI, SPAD reading and petiole sap NO3−‒N with soil NO3−‒N level were conducted under a quadratic model for each cover condition treatment with PROC GLM in SAS. Probability levels <0.05 were designated as significant for all regression analyses.
RESULTS
Effects of N rates and cover conditions on NDVI, SPAD reading and petiole sap NO3−‒N concentration
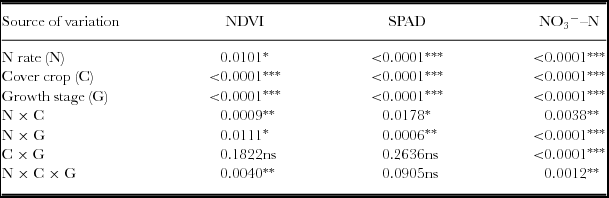
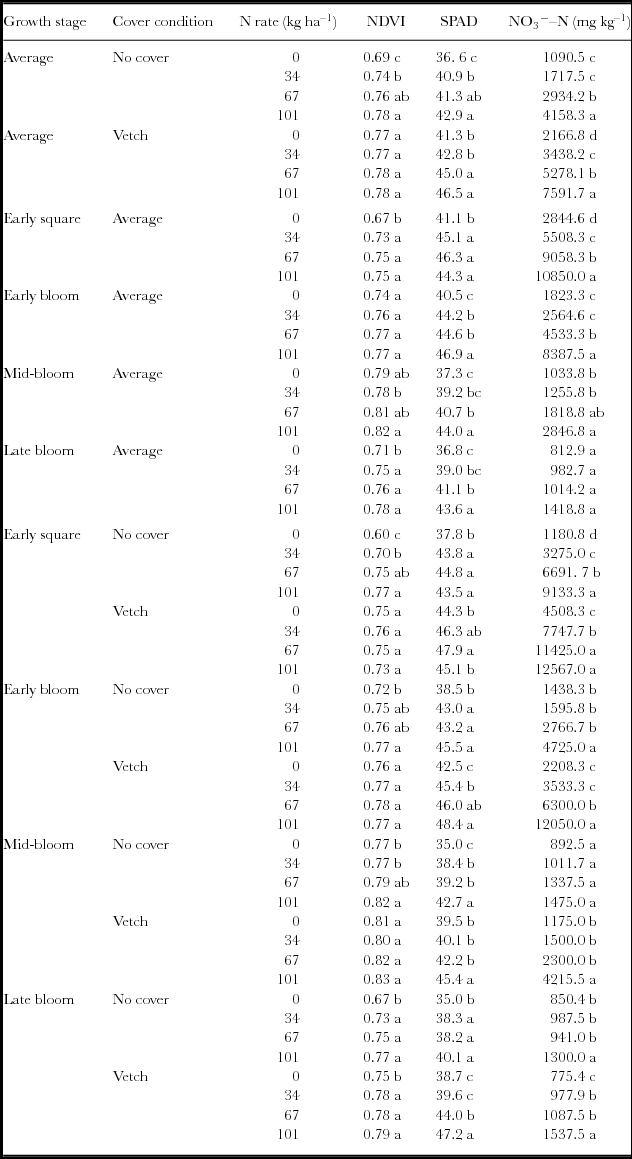
A significant interaction of N rates by cover conditions by growth stages was present for NDVI (Table 1). During early square to mid-bloom, NDVI response to N rates was significant under no cover crop but insignificant with hairy vetch; while at late bloom, NDVI responded significantly to N rates under both no cover and hairy vetch (Table 2).
Analysis of variance of cotton NDVI, SPAD reading and petiole sap NO3−‒N concentration under different N rates and cover conditions at key growth stages under a long-term no-tillage system.

ns, not significant at 0.05 probability level.
*Significant at the p ≤ 0.05 probability level.
**Significant at the p ≤ 0.01 probability level.
***Significant at the p ≤ 0.001 probability level.
Effects of N rates and cover conditions on cotton NDVI, SPAD reading and petiole sap NO3− ‒N concentration at key growth stages.

Means in a column within the N rate effects, cover condition effects, the cover conditions of the growth stage by N rate interaction, or the N rates of the growth stage by N rate interaction or the growth stage by cover condition by N rate interaction followed by the same letter are not significantly different at p = 0.05 according to Fisher's protected LSD in the SAS Procedure Mixed.
The SPAD reading significantly responded to the interactions of N rates by cover conditions and N rates by growth stages (Table 1). The difference in SPAD readings was significant between 0 and 34 kg N ha−1 in no cover crop, but no differences were observed under hairy vetch (Table 2). The SPAD reading was significantly higher in 34 kg N ha−1 than in 0 kg N ha−1 at early square and early bloom only (Table 2).
A significant interaction of N rates by cover conditions by growth stages was observed in petiole sap NO3−‒N concentration (Table 1). The relative differences in the responses of petiole sap NO3−‒N to N rates became larger between hairy vetch and no cover crop as cotton grew from early square to late bloom (Table 2).
Relationships among NDVI, SPAD reading and petiole sap NO3−‒N concentration
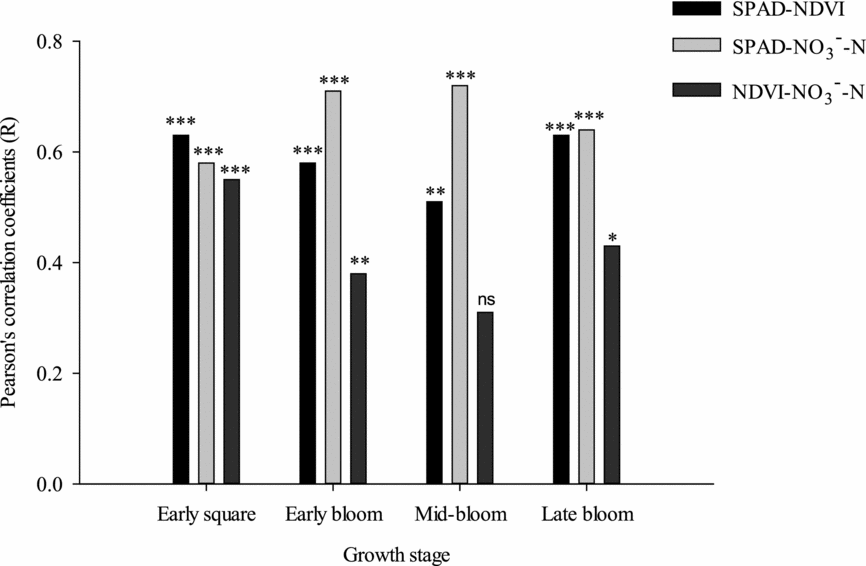
Significant and positive correlations were found between NDVI, SPAD reading and petiole sap NO3−‒N concentration regardless of growth stage, except between NDVI and petiole sap NO3−‒N at mid-bloom (Figure 1). The strength of correlation decreased between NDVI and petiole sap NO3−‒N, but increased between SPAD and petiole sap NO3−‒N, when cotton grew from early square to mid-bloom. From mid-bloom to late bloom, R values were similar for NDVI vs. SPAD reading and SPAD reading vs. petiole sap NO3−‒N.
Pearson's correlation coefficients (R) between cotton NDVI, SPAD reading and petiole sap NO3−‒N concentration (mg kg−1) at key growth stages. ns, not significant at the p ≤ 0.05 probability level; *, significant at the p ≤ 0.05 probability level; **, significant at the p ≤ 0.01 probability level; ***, significant at the p ≤ 0.001 probability level.

Regressions of leaf N concentration with NDVI, SPAD reading and petiole sap NO3−‒N concentration
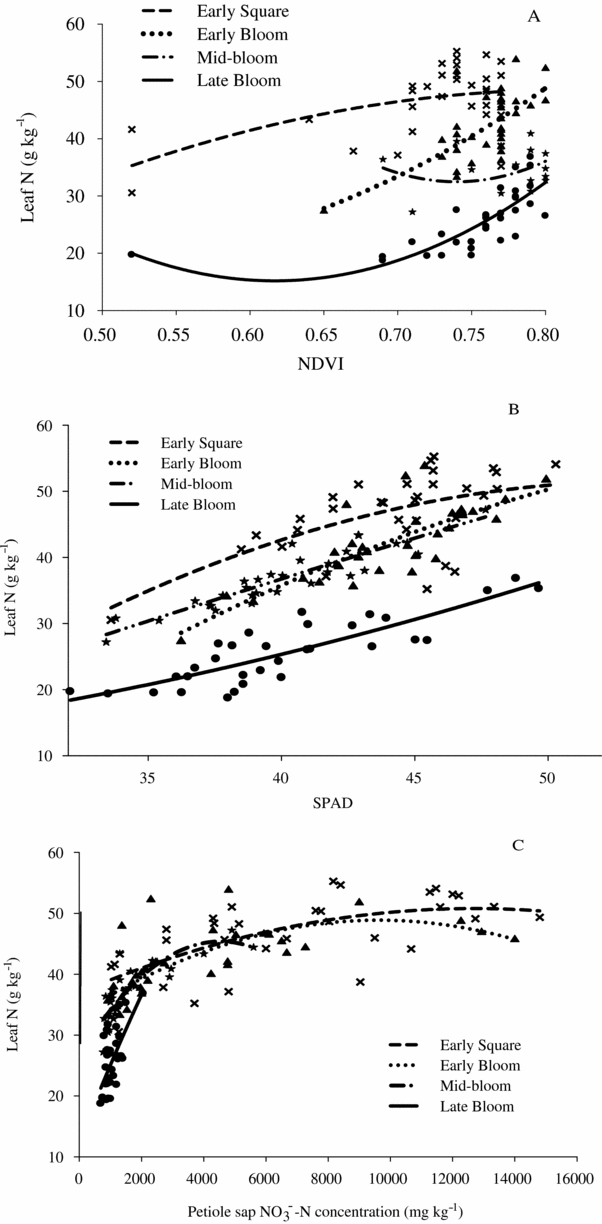
The regressions of leaf N concentration with NDVI, SPAD reading and petiole sap NO3−‒N concentration were highly significant under the quadratic model at early square, early bloom, mid-bloom and late bloom (Figure 2). While the regressions of leaf N concentration with SPAD reading or petiole sap NO3−‒N concentration were stronger than those of leaf N with NDVI in terms of R 2 values during early square to mid-bloom, leaf N concentration regressed stronger with NDVI and SPAD reading than with petiole sap NO3−‒N at late bloom (Figure 2). The regression of leaf N with petiole sap NO3−‒N was stronger at early square but weaker during early bloom to late bloom than that of leaf N with SPAD reading. The R 2 value for the regression of leaf N with SPAD reading increased remarkably as cotton grew from early square to mid-bloom (Figure 2). This result suggests that SPAD reading is more suitable to assess cotton N nutrition status during mid-bloom to late bloom.
Regressions of cotton leaf N concentration with NDVI (A), SPAD reading (B) and petiole sap NO3−‒N concentration (C) at key growth stages. In A, Early Square: Y = –52.3883+247.6594X–151.9425X2, R2 = 0.2667, p = 0.0111; Early Bloom: Y = 79.2031–257.0198X+273.8201X2, R2 = 0.4476, p = 0.0002; Mid-bloom: Y = 26.8425+0.00819X–0.0000009X2, R2 = 0.7129, p < 0.0001; Late Bloom: Y = 195.0292–589.0230X+481.9253X2, R2 = 0.6009, p < 0.0001. In B, Early Square: Y = –79.5611+4.8161X–0.0441X2, R2 = 0.3774, p = 0.0010; Early Bloom: Y = –88.2261+4.4199X–0.0330X2, R2 = 0.6486, p < 0.0001; Mid-bloom: Y = –19.3785+1.5534X–0.0037X2, R2 = 0.8485, p < 0.0001; Late Bloom: Y = –0.3199+0.2797X+0.0091X2, R2 = 0.7369, p < 0.0001. In C, Early Square: Y = 37.0158+0.0021X–0.00000008X2, R2 = 0.4175, p = 0.0004; Early Bloom: Y = 33.5127+0.003189X–0.00000017X2, R2 = 0.4861, p < 0.0001; Mid-bloom: Y = 26.8425+0.0082X–0.0000009X2, R2 = 0.7129, p < 0.0001; Late Bloom: Y = 12.6855+0.01280X–0.0000004X2, R2 = 0.4195, p = 0.0005.

Regressions of plant biomass with NDVI, SPAD reading and petiole sap NO3−‒N concentration
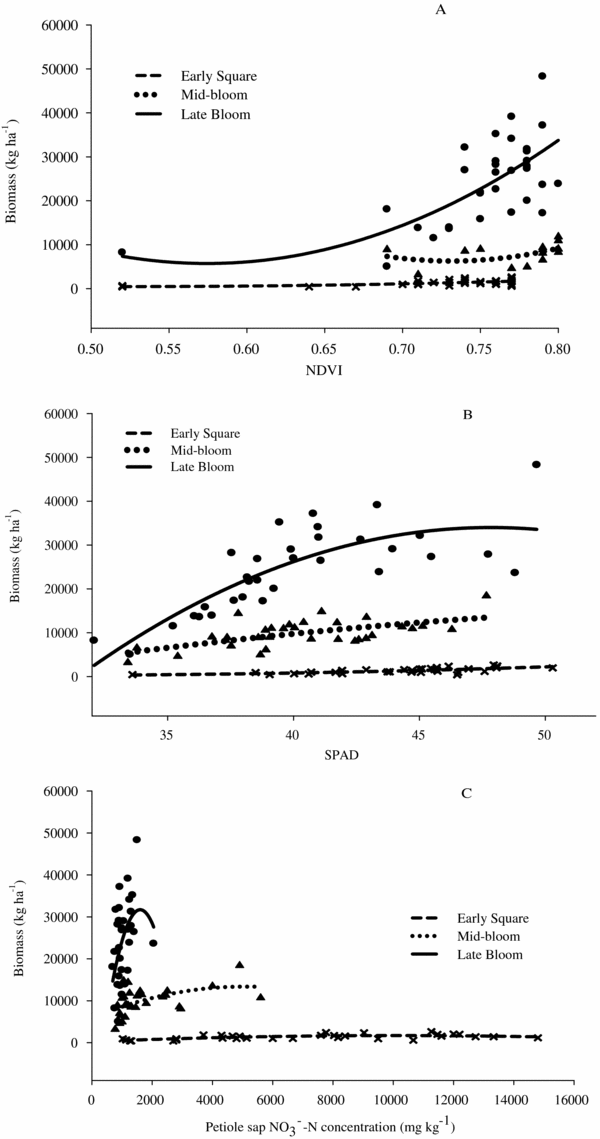
Plant biomass is a good indicator of plant growth and regressions of plant biomass with NDVI, SPAD reading and petiole sap NO3−‒N concentration were all significant at early square, mid-bloom and late bloom (Figure 3). The regression of plant biomass with NDVI was weaker at early square but stronger at mid-bloom and late bloom than that of plant biomass with petiole sap NO3−‒N. The R2 value was higher at early square and late bloom than at mid-bloom for the regression of plant biomass with SPAD reading (Figure 3). While R 2 values for the regression of plant biomass with NDVI increased as cotton grew, R 2 values for regression of plant biomass with petiole sap NO3−‒N decreased.
Regressions of cotton biomass with NDVI (A), SPAD reading (B) and petiole sap NO3−‒N concentration (C) at key growth stages. In A, Early Square: Y = 6051.9250–21212.9830X+20183.9278X2, R2 = 0.2998, p = 0.0057; Mid-bloom: Y = 334940.1139–898887.6374X+614615.3773X2, R2 = 0.3616, p = 0.0015; Late Bloom: Y = 187438.0729–632766.2946X+550854.5117X2, R2 = 0.423, p = 0.0003. In B, Early Square: Y = 3791.9508–246.6611X+4.3077X2, R2 = 0.4745, p < 0.0001; Mid-bloom: Y = –32927.0848+1558.1917X–12.2686X2, R2 = 0.3788, p = 0.0010; Late Bloom: Y = –255838.0032+12116.9217X–126.6354X2, R2 = 0.6339, p < 0.0001. In C, Early Square: Y=244.4616+0.2907X–0.0000144X2, R2 = 0.4039, p = 0.0006; Mid-bloom: Y = 5970.4800+2.9492X–0.000293X2, R2 = 0.2577, p = 0.0133; Late Bloom: Y = –20877.5756+65.7136X–0.0205X2, R2 = 0.2198, p = 0.0309.

Regressions of lint yield with NDVI, SPAD reading and petiole sap NO3−‒N concentration
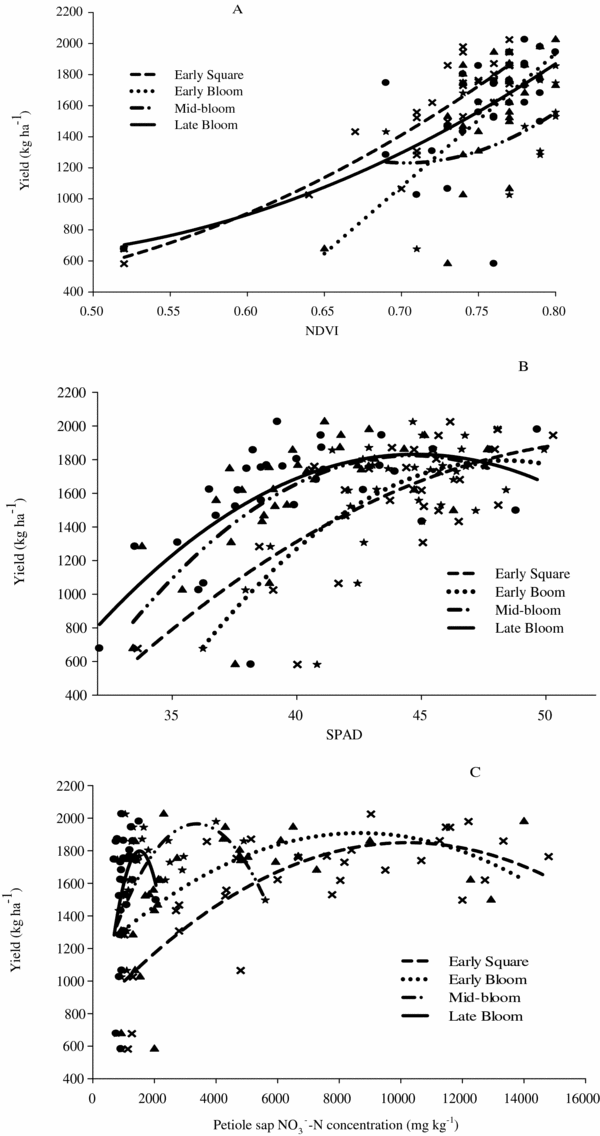
Regressions of lint yield at maturity with NDVI, SPAD reading and petiole sap NO3−‒N concentration at different growth stages were all significant under the quadratic model (Figure 4). At late bloom, however, there was a significant regression of lint yield with NVDI and SPAD reading, but not with petiole sap NO3−‒N. Canopy NDVI had a stronger relationship with lint yield than SPAD reading and petiole sap NO3−‒N at early square. From early to late bloom, SPAD reading had the strongest regression with lint yield.
Regressions of cotton lint yield with NDVI (A), SPAD reading (B) and petiole sap NO3−‒N concentration (C) at key growth stages. In A, Early Square: Y = 1412.4240–5896.5012X+8420.4139X2, R2 = 0.8147, p < 0.0001; Early Bloom: Y = –5136.5599+9220.6987X–434.0199X2, R2 = 0.4471, p = 0.0002; Mid-bloom: Y = 18191.7866–48274.4960X+34351.8374X2, R2 = 0.2292, p = 0.0229; Late Bloom: Y = 2168.8147–7356.1655X+8728.5509X2, R2 = 0.4225, p = 0.0003. In B, Early Square: Y = –7316.6797+343.2138X–3.1867X2, R2 = 0.5184, p < 0.0001; Early Bloom: Y = –15999.8031+736.9819X–7.6305X2, R2 = 0.5185, p < 0.0001; Mid-bloom: Y = –13970.2414+708.4648X–7.9443X2, R2 = 0.5213, p < 0.0001; Late Bloom: Y = –10756.1612+562.3493X–6.2804X2, R2 = 0.4443, p = 0.0002. In C, Early Square: Y = 799.7431+0.2059X–0.0000101X2, R2 = 0.6199, p < 0.0001; Early Bloom: Y = 1128.0087+0.1829X–0.000011X2, R2 = 0.3444, p = 0.0022; Mid-bloom: Y = 908.3371+0.6288X–0.0000935X2, R2 = 0.2874, p = 0.0073; Late Bloom: Y = 66.1439+2.2804X–0.0007505X2, R2 = 0.1538, p = 0.0965.

Regressions of NDVI, SPAD reading and petiole sap NO3−‒N concentration with soil NO3−‒N level
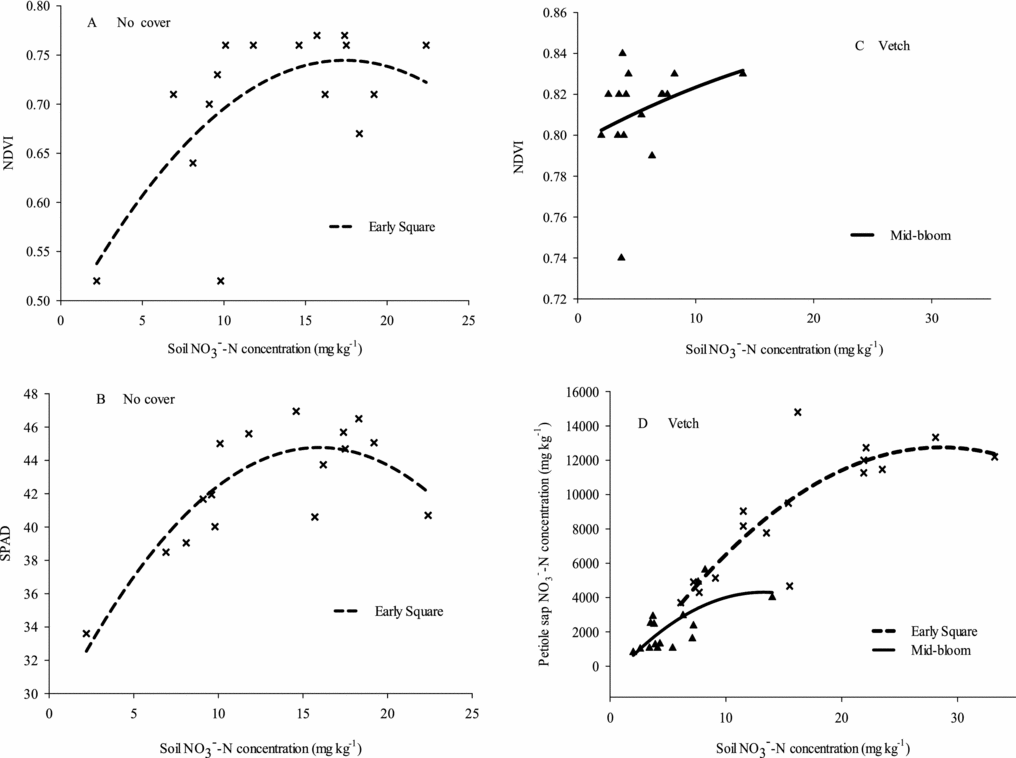
At early square, the regressions of NDVI and SPAD reading with soil NO3−‒N level were significant only under no cover (Figure 5). At mid-bloom, the regressions of NDVI and petiole sap NO3−‒N with soil NO3−‒N level were significant under vetch. No significant regressions of NDVI, SPAD or petiole sap NO3−‒N with soil NO3−‒N level were found at late bloom.
Regressions of cotton NDVI (A, B), SPAD reading (C), and petiole sap NO3−‒N concentration (D) with soil NO3−‒N at key growth stages under no cover (A,B) and covered with vetch (C,D). In A, Early Square: Y = 0.4733+0.0312X–0.0008967X2, R2 = 0.4500, p = 0.0205. In B: Early Square: Y = 28.3214+2.0621X–0.0646X2, R2 = 0.7333, p = 0.0002. In C: Mid-bloom: Y = 33.3450+2.3883X–0.1202X2, R2 = 0.6018, p = 0.0025. In D, Early Square: Y = –2011.0491+1032.5300X–18.0540X2, R2 = 0.7252, p = 0.0002; Mid-bloom: Y = ‒799.6861+771.0446X–29.0975X2, R2 = 0.4878, p = 0.0129.

DISCUSSION
NDVI, SPAD reading and petiole sap NO3−‒N concentration as affected by N rates and cover conditions
The responses of cotton NDVI and SPAD reading to N rates were generally reduced due to the cropping of hairy vetch as a cover crop during the winter (Table 2). However, the values of all three parameters were enhanced in the zero N treatment covered with hair vetch relative to no cover (Table 2). This phenomenon is attributable to the fact that hairy vetch as a winter cover crop provides a substantial amount of N to the following crop (Bauer and Roof, Reference Bauer and Roof2004), and thus dilutes the responses of NDVI and SPAD reading to applied N rates. In contrast, petiole sap NO3− ‒N concentration had a significant response to N rates under hairy vetch, but did not respond to N rates with no cover crop (Table 2). This result might be due to the fact that petiole sap NO3−‒N is more sensitive to higher N application rates than NDVI and SPAD readings. Gerendás and Pieper (Reference Gerendás and Pieper2001) noticed that petiole sap NO3−‒N concentration was more sensitive than SPAD reading in monitoring N nutrition status of nursery potatoes and similar results were reported in tomato by Farneselli et al. (Reference Farneselli, Benincase and Tei2010). During early square to mid-bloom, petiole sap NO3−‒N concentration was significantly higher under hairy vetch than with no cover crop (Table 2), which was a result of increasing the level of soil N storage and thus increased nitrate accumulation in cotton (Sainju and Singh, Reference Sainju and Singh2008).
In this study, NDVI and SPAD reading did not respond as sensitively as petiole sap NO3−‒N concentration to N rates during early square to mid-bloom (Table 2). This might be because petiole sap NO3−‒N is a direct measure of N status, while NDVI and SPAD readings are not. Sexton and Carroll (Reference Sexton and Carroll2002) reported that the SPAD reading was less sensitive to N effects than the conventional measurement of petiole nitrate concentration in sugarbeet, with the SPAD reading lagging two weeks behind petiole nitrate in being able to discriminate N treatments. Similar results were found on potato by Vos and Bom (Reference Vos and Bom1993) and on mango trees by Bally and Still (Reference Bally and Still2013). Additionally, Hardin et al. (Reference Hardin, Smith, Weckler and Cheary2012) reported that NDVI became less sensitive than SPAD because reflected red light intensity from leaves asymptotically approaches a minimum at high level of plant biomass.
Canopy NDVI is, to a certain degree, assumed to be a valuable indicator of differences in the N rates applied to the crop because the available N in the soil influences the accumulation of biomass, the principal factor that determines the canopy NDVI reading in cotton (Bronson et al., Reference Bronson, Chua, Booker, Keeling and Lascano2003). However, it is difficult to obtain consistent results in studies of cotton N response based on NDVI, because high variability within cotton crop is caused by environmental factors more limiting than N. Moreover, no N fertilizer may be needed at all to optimize profit in some fields. Therefore, to obtain the most satisfactory results, the canopy NDVI measurement must be used when the cotton has accumulated sufficient biomass to be measured, although the reading should not be taken at an overly late stage of crop development when canopy NDVI has its sensitivity decreased as a result of excessive biomass accumulation.
Relationships among NDVI, SPAD reading and petiole sap NO3−‒N concentration
Before leaf N concentration reaches its adequate level, high leaf N level will often result in high chlorophyll content and photosynthetic rate, more plant biomass accumulation, and thus likely higher crop yield. Since NDVI, SPAD reading and petiole sap NO3−‒N concentration are all related to leaf N concentration in different ways, the relationships among NDVI, SPAD reading and petiole sap NO3−‒N are interesting to be examined. Significant and positive correlation between NDVI and SPAD readings found in this study (Figure 1) is similar to those from a previous cotton experiment in which chlorophyll concentration was highly correlated with leaf reflectance either at 551 or 708 nm or with the reflectance ratios of R551/R915 and R708/R915 (Zhao et al., Reference Zhao, Reddy, Kakani, Read and Koti2005). Poljak et al. (Reference Poljak, Horvat, Majic, Pospisil and Cosic2008) found that SPAD reading and petiole sap NO3−‒N concentration were highly correlated, which are generally in agreement with our results on the strong correlation between SPAD reading and petiole sap NO3−‒N (Figure 1). Wang et al. (Reference Wang, Dunn and Arnall2012) found that NDVI and SPAD readings from geranium were highly correlated (R2 = 0.97–0.98). Sexton and Carroll (Reference Sexton and Carroll2002) reported that SPAD reading was well correlated with petiole nitrate concentration in sugarbeet within 10,000 mg NO3−‒N kg−1, but above this petiole nitrate-N level, SPAD reading did not correlate with petiole nitrate. In our study, petiole nitrate concentration in cotton rarely exceeded 10,000 mg NO3−‒N kg−1 (Table 2), which at least partially explains why SPAD reading was strongly correlated with petiole nitrate concentration (Figure 1). Overall, the positive correlations among NDVI, SPAD reading and petiole sap NO3−‒N concentration in this study were similar to those from the above mentioned prior studies.
Leaf N concentration, plant biomass and lint yield vs. NDVI, SPAD reading and petiole sap NO3−‒concentration
The regressions of leaf N concentration, plant biomass and lint yield with NDVI, SPAD reading and petiole sap NO3−‒N concentration were all statistically significant except lint yield vs. petiole sap NO3−‒N at late bloom under a quadratic model in this study (Figures 2–4). These results indicated that the test field was N deficient; leaf N, plant biomass, lint yield, NDVI, SPAD reading and petiole sap NO3−‒N were generally enhanced due to increased N applications. For field trials, the R2 value of 0.50 is sometimes used as the critical value to determine whether a regression is strong or not (Yin and McClure, Reference Yin and McClure2013). If that criterion is used, only SPAD reading during early bloom to late bloom, NDVI during mid-bloom to late bloom, and petiole sap NO3−‒N concentration at mid-bloom were strong enough for assessing cotton N nutrition status (Figure 2). The benefit of using NDVI or SPAD reading to assess cotton N status was sometimes obvious relative to the conventional utilization of petiole sap NO3−‒N concentration. Wang et al. (Reference Wang, Dunn and Arnall2012) observed that NDVI was able to indicate geranium N status. In contrast, Raper et al. (Reference Raper, Varco and Hubbard2013) reported that sensor reading failed to consistently predict cotton leaf N status before early bloom, when a yield-impacting fertilizer N application could be made. These previous investigations suggest that NDVI is sometimes a valid tool for assessing plant N status, which coincides with our findings in this study. Our results are similar to or stronger than those on the association of leaf N concentration with NDVI in cotton. Raper et al. (Reference Raper, Varco and Hubbard2013) reported in Mississippi that the R2 values of cotton leaf N with NDVI were between 0.06 and 0.77 during pre-square to peak bloom from three different types of sensors (GreenSeeker Model 505, Crop Circle ACS-210, and Yara N Sensor). Bronson et al. (Reference Bronson, Chua, Booker, Keeling and Lascano2003) found that the correlation of cotton leaf N with red NDVI was insignificant at Ropesville in 2000, and was insignificant at early square, but significant at early bloom and peak bloom at Lubbock in 2000 and 2001. A stronger relationship of leaf N with NDVI in our study than some prior investigations might be due to the fact that the zero N plots were more N deficient in the soil due to the over 30-year continuous implementation of this experiment in our study. In general, our results along with others suggest that the association of leaf N with SPAD reading is affected by location and year.
The SPAD chlorophyll meter and petiole sap nitrate testing measure two different forms of N in the plant. The SPAD reading meter indirectly measures the total organic N concentration, while petiole sap nitrate concentration testing directly measures inorganic nitrate level in the plant. By measuring the difference in absorbance of infra-red vs. near infra-red light transmitted through the leaf, SPAD reading provides a rapid but indirect estimate of leaf chlorophyll concentration. Chlorophyll in turn reflects a relatively stable pool of organic N within the leaf and its concentration is associated with Rubisco content (Evans, Reference Evans1989; Lawlor et al., Reference Lawlor, Kontturi and Young1989). This pool of N does not appear to be as responsive to a broad range of N as does the inorganic N pool represented by nitrate concentration in petioles or stems (Varvel et al., Reference Varvel, Schepers and Francis1997; Westcott and Wraith, Reference Westcott and Wraith1995). While a SPAD chlorophyll meter provides a quick in-field measurement, the N pool it is observing appears to be less sensitive to plant N status than is the N pool reflected in the petiole sap nitrate testing. Thus, the petiole sap NO3−–N concentration testing, even with the inherent lag time required for sample shipment and laboratory assay, provides an earlier indication of changes in plant N status than does the SPAD meter reading. Similarly, Sexton and Carroll (Reference Sexton and Carroll2002) reported that the SPAD meter provides a narrower view of sugarbeet N status than does the petiole sap nitrate testing. Whether or not this is a limitation depends on whether one wants to track crop N status at higher levels of N availability. One possible way to improve the sensitivity of SPAD reading might be to sample leaves lower in the canopy, as older leaves will show N deficiency symptoms earlier than newer leaves. However, effects of disease and abiotic stress would be more likely to be confounded with N effects influencing SPAD reading on older leaves.
Out of the three parameters, only SPAD reading at late bloom had enough strength for estimating plant biomass as the R2 value for this regression was greater than 0.50. The benefit of using NDVI or SPAD reading to estimate cotton biomass was sometimes evident compared with petiole sap NO3−‒N. Bronson et al. (Reference Bronson, Chua, Booker, Keeling and Lascano2003) found that the correlation of cotton biomass with NDVI was significant at early square (R = 0.42) but insignificant at early bloom and peak bloom. The differences in this relationship when comparing our results and ones reported by Bronson et al. (Reference Bronson, Chua, Booker, Keeling and Lascano2003) might be related to the site-specific factors, such as soil N fertility level and weather conditions. Bronson et al. (Reference Bronson, Chua, Booker, Keeling and Lascano2003) observed that the correlation of cotton biomass with SPAD reading was not significant regardless of growth stage. Bronson et al. (Reference Bronson, Malapati, Scharf and Nichols2011) revealed that the correlation of cotton biomass with SPAD reading was significant in 2007 (R = 0.35) but was not significant in 2008 or 2009 at early bloom; at mid-bloom, the correlation of cotton biomass with SPAD reading was significant in 2007 (R = 0.35) and 2008 (R = 0.27) but insignificant in 2009. Again, these results suggest that the correlation between cotton biomass and SPAD reading vary significantly with year and location.
In this study, only NDVI at early square, petiole sap NO3−‒N at early square, and SPAD during early square to mid-bloom were strong enough for cotton yield prediction. The benefit of using NDVI or SPAD reading to predict cotton yield were sometimes obvious relative to the conventional utilization of petiole sap NO3−‒N. However, Bronson et al. (Reference Bronson, Booker, Keeling, Boman, Wheeler, Lascano and Nichols2005) noted that there were poor correlations of early squaring NDVI with cotton yield. Our results are similar to or stronger than those reported on the relationship of cotton yield with NDVI. Guteirrez et al. (Reference Gutierrez, Norton, Thorp and Wang2012) observed that the correlation of cotton yield with NDVI was not significant at pinhead square, mid-bloom, or cut out (R2 = 0.00–0.02), but was significant at early bloom and peak bloom (R = 0.46–0.69). Bronson et al. (Reference Bronson, Malapati, Scharf and Nichols2011) found that cotton yield was significantly correlated with amber and red DDVI at early bloom and at mid-bloom during 2007–2009. Herein, the regression of cotton yield with NDVI was consistently significant across growth stages, but became weaker from early square to mid-bloom (Figure 4). Similarly, Teal et al. (Reference Teal, Tubana, Girma, Freeman, Arnall, Walsh and Raun2006) and Ali et al. (Reference Ali, Thinda, Sharmaa and Singh2014) reported that the decline in the relationship between yield and NDVI at later growth stages can be attributed to canopy closure that influences the field of view of the optical sensor.
The regressions of NDVI, SPAD reading or petiole sap NO3−‒N with leaf N, plant biomass or lint yield were sometimes weak (R 2 < 0.5) although statistically significant (Figures 2–4). Zhou and Yin (Reference Zhou and Yin2014) found that NDVI was more appropriate to be used to predict cotton yield than to assess cotton N nutrition status during the growing season. The regressions of cotton yield and leaf N with NDVI were weaker in this study than those of corn yield and leaf N with NDVI in a prior study (Yin and McClure, Reference Yin and McClure2013); which was probably resultant from the lower N requirement by cotton than corn.
CONCLUSIONS
Canopy NDVI and SPAD reading responded less sensitively to N rates than petiole sap NO3−‒N concentration. The responses of NDVI and SPAD reading to N rates were generally reduced due to the cropping of hairy vetch as a winter cover crop, but at the same time, the values of these three parameters were enhanced in the zero N treatment covered with hair vetch than no cover. Significant and positive correlations existed mostly between NDVI, SPAD reading and petiole sap NO3−‒N during the growing season. Considering R2 value of 0.50 as the critical value in field-trials, canopy NDVI during mid-bloom to late bloom and SPAD reading during early bloom to late bloom are effective alternative methods for assessing cotton N nutrition status. While SPAD reading at late bloom is an effective parameter to estimate cotton biomass, NDVI at early square and SPAD reading during early square to mid-bloom are effective for cotton yield prediction.
SUPPLEMENTARY MATERIALS
For supplementary material for this article, please visit https://doi.org/10.1017/S0014479717000229.