In 1914, accidents killed 682 German steel workers for every million worker-years of employment. By 2011 that risk had declined to 15 deaths per million worker-years.Footnote 1 Revulsion with high accident rates during Germany's early industrialization constituted a core reason for the accident-insurance system Reich Chancellor Otto von Bismarck introduced in 1884 as part of his famous social-insurance scheme. Those who fought for the system's creation thought it would lead to safer workplaces and reduce industrial accident rates. But at first this did not happen; in the years prior to WWI accident rates declined only modestly. The death rate for the steel industry, for example, actually increased from about 533 per million-worker-years in 1887 before beginning a steady decline starting at the turn of the twentieth century. Contemporaries disappointed with accident reduction perhaps gave the system too little credit. Other changes taking place in the later nineteenth century would have increased accident rates considerably in the absence of the measures taken by the accident-insurance system. Larger plants were more dangerous, for example, and plant size expanded rapidly in the decades before WW1. By adopting the measures we document later, the system prevented a worsening accident rate. The system's backers faced the problem familiar to many policy-makers, claiming credit for success on the basis of a counter-factual. This article studies the reasons for the slow improvement in safety, which reflected a combination of flawed design and a reluctance to use the tools available to the insurance carriers.
The accident-insurance system achieved one goal: it provided financial compensation to injured workers and their survivors in a routine, formalized way. But it was nonetheless disappointing. We show that German industrial firms had access to policy tools that were, if used, quite effective in reducing accidents. What they lacked was an incentive to use these tools: establishing and enforcing safety rules, for example, cost money, and the costs of compensating accident victims were pegged to the relatively low wages prevailing in German industry at the time. The system, moreover, allowed individual firms to shift costs to other firms. Thus we see in this example an early version of the problem that often plagues social-insurance systems: they are good at providing benefits, but can be expensive because the systems often do not use mechanisms that induce firms and workers, for example, to produce safely. Compensating accident victims is costly, and does not enhance worker welfare as much as preventing accidents in the first place.
Economists increasingly stress the role of human capital in long-run economic development, seeing the decline of mortality and increasing education levels as central to the transition to the levels and rates of growth of income we enjoy today. The accident-insurance system we study here (along with its counterparts elsewhere) contributed to the growth of human capital, both by reducing the chance that trained workers would die or become disabled in the course of doing their jobs, and by giving firms increased incentives to employ highly-skilled workers. Social insurance programs today form a central part of most developed countries' economic systems, but demographic change combined with rising medical-care costs threatens the solvency of these programs. An economics literature asks how systems can be designed to provide incentives to reduce the costs of meeting the social insurance system's goals. This article addresses that question in an historical context. The German system was an important role model for similar systems across Europe and for the American workman's compensation scheme introduced in the early twentieth century. In contrast to the latter, however, the functioning of the German system has not been well-researched. This article closes that gap. We show that when it comes to social legislation and regulation the devil is in the details. German firms could have reduced fatal accidents considerably if insurance carriers had used the available regulatory tools.
The system Germany introduced in 1884 formed the second pillar of Bismarck's system of social insurance. (Health insurance came first, in 1883). Bismarck's system created a new, special-purpose entity called a Berufsgenossenschaft (hereafter BGS). The BGS was a mutual insurance carrier for firms in related industries. Each BGS had considerable autonomy, subject only to some oversight from the Reichsversicherungsamt (hereafter RVA), the Imperial Insurance Office. The system had two elements that would seem to provide the BGS with the means to reduce accidents. First, each member firm paid an insurance contribution that was partly experience-rated. Second, the BGS could issue rules governing safety practices (Unfallverhütungsvorschriften) for the factories run by its member firms. The BGS appointed inspectors to make sure the rules were followed, and could fine firms that did not comply with these rules.
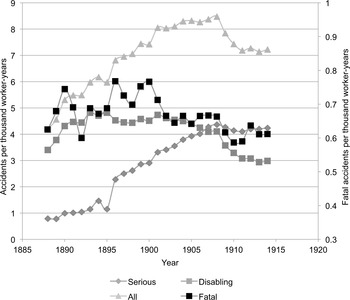
Accident insurance's advocates had two goals. They wanted to shield workers and firms from the economic consequences of accidents. They also sought to combat a rising toll of industrial accidents. By mandating payments and creating large, financially solid insurance carriers, the new system met the first goal admirably. Figure 1 shows the system did less to reduce accidents.Footnote 2 These figures report median annual accident rates for all insurance funds combined. Accidents of all types increased to 1905, and declined only slightly from that date. The accident rates remained appalling: as late as 1914, accidents that killed or seriously injured workers were nearly twice as common as when the system was first introduced, and in some individual sectors the picture was much worse.Footnote 3 The overall accident rate includes a category of minor accidents that were not part of the compulsory accident insurance scheme. Because of this fact, and because of reporting issues we explore below, in the remainder of the article we focus on the accidents reported in Figure 1.
ACCIDENT RATES FOR WORKERS COVERED BY A BGS, 1886–1914

The totals reported in Figure 1 reflect the net effect of several different changes, all of which we unpack in this article. Even Figure 1 suggests some improvement in fatal accidents and in the next most-serious category, accidents that left workers disabled for long periods. In a few especially dangerous sectors, such as steel production, the overall accident rate began to decline in the years just prior to 1914. The steel industry's experience also hints at a more general pattern: while the overall accident rate in many industries did not decline as much as hoped, the stagnant overall accident rate reflected a fall in fatal accident rates coupled with an increase in the incidence of accidents with less serious consequences. Our findings suggest this experience could have been more general.Footnote 4
Previous research on the United States has concentrated on the transition from liability for negligence to workers' compensation. James R. Chelsius (Reference Chelius1976) focuses on fatal industrial accidents caused by machinery (other than motor vehicles) between 1900 and 1940. Introduction of strict liability in the American states significantly reduced these fatal accidents. Price V. Fishback (Reference Fishback1987) found the opposite effect in American coal mining, where it was especially difficult to enforce safety rules. We unfortunately cannot study the German accident insurance's effects by comparing accident rates “before” and “after” its introduction; the only comprehensive data on accidents are due to the system itself. Rather, we focus on the impact of policy changes within the accident insurance system. We begin with an overview of the pre-history of the accident insurance system, and then describe the 1884 law and the institutions it created. A simple model helps fix ideas about the (weak) incentives firms had to reduce accidents before and after 1884. We then use reports from the accident-insurance regulator to estimate the determinants of accidents and the effect of policy changes on accident rates. Our results imply that the main problem was a reluctance to use the tools available.
FROM LIABILITY LEGISLATION TO ACCIDENT INSURANCE
The 1884 accident-insurance legislation reflected dissatisfaction with earlier approaches. In the 1860s industrial accidents became the subject of extensive discussion. The political historiography stresses the accident-insurance system as part of an effort to co-opt the labor movement. Labor groups argued that industrial accidents reflected the abuse of workers by the capitalist system; firms could save money by not making safety improvements, instead letting workers bear the human and financial consequences of injury and death. Other observers complained that the cost of industrial accidents fell on taxpayers through the local poor law. Industrial firms provided a small share of the taxes that supported the poor relief system.
An increase in industrial accidents formed the backdrop to these discussions. Three especially bad accidents in the period 1867–1869 killed a total of 540 miners (Kleeberg Reference Kleeberg2003, p. 86 ff). The local Knappschaften (a mutual-insurance system for miners only) paid for medical expenses and disability pensions, but the latter were perceived as inadequate (Boyer Reference Boyer1995, p. 21). Outside the mining industry there was no comparable system of social protection. Public opinion was particularly offended that the surviving relatives of the victims were not entitled to compensation from the employer. Survivors could only hope for support from poor relief.Footnote 5
In response to these problems the government introduced the Imperial Liability Act of 7 June 1871, which in theory made firms financially responsible for the consequences of accidents. The way it assigned responsibility, however, made the law at best a partial success. Strict liability applied only to railways (Kleeberg Reference Kleeberg2003). For other sectors, the law placed the burden of proof on the injured worker. The Act obliged employers to compensate accident victims or their survivors only if the worker could prove that the owners had caused the accident by their own acts or omissions. Labor groups opposed the 1871 Act, arguing that because of their limited education and financial reserves, working people could rarely pursue legal action against their employers, even if likely to eventually win.Footnote 6
Many employers purchased liability insurance to meet potential costs under the 1871 Act. Contemporaries claimed these insurance policies exacerbated the problem because insurance companies had a greater interest in and expertise at avoiding or delaying payments.Footnote 7 The liability legislation left employers equally unhappy. Many complained that judges too often ruled in favor of an injured worker and too often assigned unreasonable damages (Lehr Reference Lehr1888, pp. 27–39). According to Louis Baare, the Director General of the Bochum Association of Mining and Cast Steel, this situation led many accident victims to gamble on a big win in court: “If the worker wins, he becomes a pensioner; if he loses, he becomes a beggar.”Footnote 8
The 1884 Act
The accident insurance system at first pertained to all employees with an annual income of up to 2,000 Marks who worked in mines, saltworks, processing plants, quarries, shipyards, factories, and steel mills. Later legislation expanded the compulsory insurance to other occupations/groups such as agricultural and construction workers.Footnote 9 In 1885, the first year for which comprehensive data are available, the system insured almost three million workers. By 1914, through the extension of the system to new industries and the growth of industries already covered, that coverage figure had grown to 9.2 million industrial workers.Footnote 10
The 1884 law forbad private-law claims against employers, so the insurance premia were the only costs to employers. These restrictions seem to have reduced expenses per accident. According to one estimate, expenses per accident for one of the BGS in 1886 were about 182 Marks. In 1882, the damages covered by the private accident insurer Leipziger Unfallbank amounted to more than 500 Marks per accident (Lehr Reference Lehr1888).Footnote 11 Workers made no direct contribution to the BGS, but they still bore some of the costs. For the first 13 weeks after an accident, medical costs and replacement pay were shouldered by the worker's health-insurance fund rather than the BGS, and workers paid one-half the costs of their health insurance. The 1884 law required that an injured worker receive all necessary medical care free of charge. The law also specified a menu of mandatory additional benefits based on the worker's income at the time of the accident. A permanently disabled worker, for example, received 66.6 percent of his last earnings as a pension.Footnote 12 A widow received 20 percent of her husband's last earnings (until she remarried), and each surviving child received 15 percent of the worker's earnings until the age of 15.Footnote 13 Thus while instituting a form of strict liability, the 1884 Act capped damages.
Both workers and factory owners approved of the shift to insurance with the 1884 Act. Labor groups preferred the insurance approach because it removed the question of “fault” from the compensation discussion. The owners also preferred accident insurance to the older liability scheme. Insurance made accident costs limited and calculable both by assigning specific tariffs to particular types of outcomes, and by pooling costs across a large number of firms and thus making insurance costs stable (Wickenhagen Reference Wickenhagen1980; Bödiker Reference Bödiker1895). This is in line with Fishback's (Reference Fishback, Glaeser and Goldin2006) finding for the United States where each of the major interest groups (employers, workers, insurers) welcomed the change from common law negligence liability to a form of strict liability.
The institutional heart of the accident insurance system was the BGS. Each BGS consisted of a group of firms in related industries. The law allowed companies to create either a single, nation-wide organization, or to form regional groupings within a single industry. Both types of BGS emerged. All German musical-instrument makers, for example, belonged to a single BGS. The iron and steel industry, on the other hand, established eight regional BGS. The BGS paid all costs for therapies, accident benefits, and administrative costs, and funded these expenses by levying contributions on member firms.Footnote 14 This article focuses on the operation of the accident-insurance system, and thus defers the political economy of its creation to a later point in the project. Yet the system's design may reflect its origins in ways that affected its performance. Not all relevant actors favored the system as it came into being. Isabela Mares (Reference Mares2003) argues that some high-risk producers (such as iron and steel) had wanted a national system that would allow them to shift some of their costs to safer sectors (such as textiles). The BGS system made such cost-shifting across sectors impossible. But the system clearly tolerated cost-shifting within BGS, perhaps from large to small firms. Larger firms received more votes for the governing bodies of the BGS. A small number of large firms could out vote smaller firms within the BGS, and this power would enable them to adopt procedures that would penalize small firms relative to their actual risks.Footnote 15
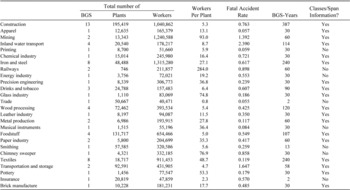
Table 1 provides a statistical overview of the 68 industrial BGS that existed in 1914. We organize them into the 26 sectors used by the RVA (and the industrial census). Some BGS formed late in our period after changes in the law required coverage of a broader group of workers. The size of the average BGS differed considerably across sectors, from the huge organizations in construction, mining, and iron and steel down to the small groups for insurance and musical instruments.
OVERVIEW OF THE THE BERUFSGENOSSENSCHAFTEN AS OF 1914

Note:
Accident rate is per thousand worker-years.
ALLOCATING COSTS
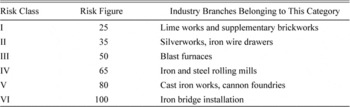
Perhaps the BGS's most important task was to allocate the costs of accidents across member firms. To do this, the BGS constructed a risk estimate that supposedly reflected each firm's contribution to expected costs. (We will refer to the entire scheme as the “tariff,” and the individual risk figure assigned to each firm as its “risk level.”) Each BGS was required to construct a tariff intended to last for 3–5 years; at the end of one tariff period, the BGS proposed a new tariff. While the BGS was responsible for proposing a tariff, the RVA had to approve each tariff before it could go into effect, and the RVA could make suggestions to prod the BGS in a different direction. The BGS assigned each establishment (Betrieb) to a “risk class” (Gefahrenklasse) that reflected in principle the expected costs of accidents in an establishment of that type. Table 2 reports an example, the scheme for the smelting and rolling-mill BGS in 1886. A risk class for a given BGS might consist of heterogeneous plants such as cast-iron works and cannon foundries. The idea was to group plants together if their accident risks were similar, not to group establishments by technology or product.Footnote 16
TARIFF OF THE RHEINISCH-WESTFÄLISCHE HÜTTEN- UND WALZWERKS- BERUFSGENOSSENSCHAFT, OCTOBER 1886

Source:
Bundesarchiv R 89/15622.
Experience rating in a modern insurance system means that a given firm's premium reflects both its inherent risk, due to its activity (e.g., manufacturing engines), and an adjustment upwards or downwards that reflects that firm's own accident history. Experience rating in the BGS system was cruder. First, the relevant experience was for all establishments of a given type within a BGS, not for a particular firm. Thus a firm with a plant in risk class I would see its insurance costs go up or down with accidents in risk class I, even if those accidents occurred in plants belonging to other firms in the BGS. This subtlety was poorly understood in the early years of the insurance system; BGS boards had to re-explain the system, over and over, to firms that had experienced few accidents but that nonetheless were assigned to high risk classes.Footnote 17
Each BGS used its own accident statistics to construct these tariffs. In the method originally used, the average risk level of like firms in a sector was reported as a weighted sum of the number of accidents per 1,000 workers. For fatal accidents the weight was assumed to be 10; for accidents that caused permanent total incapacity, 30; for accidents that caused permanent partial incapacity, 15; and accidents that caused temporary incapacity were assigned a weight of unity (Hartmann Reference Hartmann1900, p. 9). The weights were supposed to reflect the costs to the BGSs of different types of accidents. Widow's benefits were, for example, much less costly than the disability pension required for a permanently incapacitated worker.Footnote 18
In May 1896 the RVA informed the BGSs that henceforth they must use a new way of calculating the figures. The new approach replaced the crude weights noted earlier with the BGS's expenditure on medical treatments and accident benefits for each type of accident, divided by the aggregate wages and salaries of the companies concerned. The RVA required this calculation to be based on all data since the BGS was established, and not just on accidents recorded under the most recent agreement.Footnote 19 The company-specific contribution units (CUi) of the member firms (1…n), which were calculated as the product of total wages and salaries (Wi) and the risk level (Gi), became the basis for allocating the BGSs' financial burden. In the second step of the assessment system the individual contribution for a firm i (Ci) was determined as the product of its relative share in all contribution units (ci) and the total expenditures of that year (E):

For most of the period under study, the average BGS collected from firms a sum representing about 1.6 percent of the wage bill. But there is a great deal of dispersion around that mean; the top 25 percent of BGS collected about 2 percent, while the bottom 25 percent collected about 0.1 percent. Variations in costs across industries line up closely with the variations in accident rates reported in Table 1.
A MODEL OF INCENTIVES WITH THE BGS COST ALLOCATION
Before considering the historical episode in detail, we first outline a simple model to evaluate the incentive effects implicit in the Liability Act of 1871 and the later BGS' tariff system. Assume that firm (i) produces output (y) with the two inputs, labor (l) and capital (c). The firm's technology can be described by the following production function:

Assuming a competitive environment with given output price (p), wage (w) and interest rate (r), profit maximization leads to the profit-maximization condition

The firm's production plan (y0, l0, c0) is optimal if and only if the ratio of the marginal products of labor and capital is equal to their price ratio. We use this production plan in the following as a benchmark. Suppose now that a strict liability law requires the firm to bear the (expected) economic costs of accidents per worker (gi). We can interpret these costs as the firm's individual risk level determined by its particular production technology. The firm can reduce the (expected) economic costs of accidents per worker to (gi–ei) by implementing additional safety practices or by introducing less risky production methods. However, the accident-reducing effort (ei) also involves convex costs v(ei) with v'(ei)>0 and v”(ei)>0. The firm's profit function is now

Profit maximization now leads to two first-order conditions:


From both the decreasing marginal productivity of labor and the assumption that gi ≥ ei, we see that the firm facing strict liability uses more capital (cL>c0) and less labor (lL<l0) to produce the same output. Liability has the same effect as a tax on labor and leads to an acceleration of mechanization. In addition, the firm now implements safety practices in the amount of eL i.
Now assume the liability law is replaced by an accident insurance system. The individual firm's contribution is not determined by its individual risk level (gi) but by the average risk level (ag) of all member firms (1…n) (or a subset of firms with similar individual risk levels). This average risk level is calculated as

Hence, the firm's individual profits are now


Comparing equations (6) and (10), we see that the insurance system leads the firm to care less about the implementation of safety practices than in the situation with strict liability (eAG<eL). The magnitude of the reduction in e depends on the number of firms (n) used to calculate the average risk level. The impact on labor demand is ambiguous. Firms with a comparatively high individual accident risk (gi) (for which gi- ei L+ v (ei L) > ag + v (ei AG)) will increase their labor demand with the transition from strict liability to the accident insurance scheme. The opposite is true for firms with a comparatively low individual risk level. Thus the introduction of the accident insurance has the perverse effect of channeling workers into those firms where they face an above-average risk of an accident.
Suppose instead that the BGS assigns a fixed, individual risk level (fg) to every member firm. We assume this risk level cannot, at least in the short run, be influenced by a firm's individual efforts. Then the firm's profit is:

The first-order conditions are:


In the case of fixed risk levels, firms have no incentive to reduce the (expected) economic costs of accidents per worker. Summing up, our analysis implies eL>eAG>eFG=e0=0. Both in a system without compensation of workers' accidents costs and under an accident insurance system with fixed risk levels, firms will not be motivated to increase worker safety. The consequences are worse, however, in the insurance system because of the induced re-allocation of more workers to relatively dangerous sectors.
Before 1871, Germany had no reliable system for forcing firms to pay for the economic consequences of industrial accidents. The 1871 Liability Act changed that (e0→eL), and then the 1884 Accident Insurance Act created the system under discussion in this article. The fixed risk levels and lack of firm-level experience-rating in the original post-1884 scheme reduced firms' incentives to reduce accidents in their operations (eL→eFG). Under pressure from the RVA, at the end of the nineteenth century the BGS began to use more and more risk classes, in effect assigning firms to pay rates that more nearly reflected the costs they incurred for the BGS. The differentiation of tariffs into many different average risk levels increased member firms' incentives to increase workers' safety (eFG→eAG).
Our model does not address changing incentives for workers. There are two possible forms of moral hazard in this type of system.Footnote 20 If workers realize that the transition from liability to accident insurance makes compensation for injuries secure and foreseeable, they might be inclined to take higher risks and trade safety for higher piece rates (Fishback, Reference Fishback1987). This effect implies that introducing insurance can raise accident rates. A second form of moral hazard reflects the way accidents are reported. In a pure liability system, workers might not report some accidents that they would report in an insurance system. To deal with the second problem we concentrate our empirical analysis on fatal accidents, which are unlikely to suffer from misreporting. The first type of moral hazard affects accident rates mostly during the transition from liability to accident insurance. Since we analyze the development of accident rates only after the implementation of accident insurance we can assume that workers' preferences for risk were mostly constant in our period of observation. We also use year dummies and BGS-specific time trends in all econometric specifications; together these should control for the possibility that risk-taking and reporting practices vary over the business cycle.
INSURANCE AND ITS DISCONTENTS
Our model implies three different incentive effects from the way the BGS allocated costs. All were known to contemporaries. First, the system encouraged the substitution of capital for labor. A firm could not change its assignment to a given risk class, and any firm's conduct had only the smallest (and delayed) effect on the contributions due from a firm in that class. But a firm could reduce its insurance costs immediately by reducing the wage bill. Thus a system intended to protect workers from the costs of accidents might leave them unemployed.
Second, the system did not necessarily reward investments in accident-reducing equipment or research, even if somehow all the firms in a given risk class collaborated to simultaneously make these investments. This effect has two components. A cost reduction would affect the firm's situation only after the adoption of a new tariff, which might be three or four years in the future. Moreover, because the RVA insisted on basing current risk calculations on the entire history of the BGS, the effect of changes today was muted by practice in the past. This approach annoyed some BGS, who noted, correctly, that it meant they could be paying today for practices they no longer used. In some industries, for example, electric power had by 1900 completely replaced the relatively dangerous steam power in wide use at the system's start. But the RVA insisted that firms still base their calculations in part on data from the steam era. The engineering and small iron industry BGS resisted the RVA more than others. In 1896 it proposed a revised tariff that was based on only three years' worth of accident data, in open defiance of RVA regulations. When questioned, the BGS replied that its new safety rules had made earlier data a poor predictor of future accidents. In 1913 the BGS proposed a revised tariff that used data back to 1890 (but not to the system's beginning), which also included alternative calculations showing how misleading the RVA's approach was.Footnote 21
The RVS's insistence on using all available historical data puzzled some BGS. The RVA explained it by an appeal to the law of large numbers: only by using all available information could the BGS calculate the right risk levels.Footnote 22 This argument reflects either faulty statistical reasoning or the assumption that the data-generating process for accidents did not change over time. The RVA often appealed to what it thought were insurance principles; the most important thing was for firms to share risks within a BGS. But the way firms share risk within a mutual organization like a BGS shapes the incentives to expend funds on the prevention of accidents.
Third, the assessment system created the externality noted earlier: it was almost never cost-effective for any individual member firm to invest in accident-reducing measures. Equation (1) shows that the increase in a BGS's expenses (ΔE) that resulted from an increase in a single firm's accidents led to a relatively small increase (ciΔE) in that firm's contribution. Moreover, ci is smaller, the smaller is a firm in relation to the entire group. Most of the rise in accident costs (i.e., (1-ci)ΔE) was passed on as externality to other firms in the BGS. Contemporaries questioned the RVA's approach, noting the perverse incentives. Germans had experience with more differentiated systems. Private-sector liability insurance issued in response to the 1871 Liability Act typically used a more complicated tariff structure, incorporating firm-level histories in setting insurance premia (Poeverlein Reference Poeverlein1900, p. 17).
The requirement to join a BGS made adverse selection at the system level impossible. But individual BGS sometimes tried to affect their own costs by attracting or repelling firms with unusual accident costs. An economy as developed as Germany's in the 1880s was bound to have firms that would not fit easily into a reasonable number of industrial categories. Some BGS resisted accepting firms that did not naturally fit anywhere. BGS sometimes tried to prevent a particularly high-risk firm from joining. In 1889, for example, the south German precious and base metal BGS tried to exclude Lorenz, a firm that made metal cartridges and machines. Lorenz's works included the hazardous activity of filling cartridges with gunpowder. The BGS's board thought this activity a more natural fit to the chemical industry's BGS.Footnote 23 The fact that a BGS would want to rid itself of a member firm suggests once again that the premium system was imperfect; in principle, a BGS should not care about its membership, so long as it could correctly price all risks.Footnote 24
The BGS sometimes deliberately mis-priced risk. A small firm that played only a marginal role in its BGS was at risk of being assigned unjustified, high risk levels. One example of this problem comes from the southwest German iron BGS. The “misfits” belonging to this BGS included firms that operated steam rollers. In 1889 this BGS's risk levels ranged from 5 to 50, and it assigned the steam rollers to the class with a risk level of 35. In 1906 the BGS revised its tariff so that the overall levels ranged from 5 to 70, and assigned the steam rollers a level of 50.Footnote 25 At the 1909 BGS meeting, the steam roller operators objected to the proposed new figure of 23, calling instead for a classification with the much lower risk figure of 8.5. The other member firms overwhelmingly rejected this proposal.Footnote 26 The steam roller operators then appealed to the RVA. The regulator eventually persuaded the BGS to lower the rollers' risk figure to 16. This number more nearly reflected the estimate one would draw from the accident statistics, 15.04.Footnote 27 In this case the BGS had tried to ignore its own statistical information and assign the steam roller firms a risk figure 50 percent higher than was warranted. This example also shows the RVA's power: when it cared to, the regulator could shape the negotiation of the new tariffs.
The BGS often exacerbated problems by creating tariff structures consisting of just a few risk classes with similar risk values. In the 1880s, the mean number of risk classes for all BGS was 6.6, and the mean absolute span (ratio of the highest to the lowest risk level) was 9.8. This practice made little sense, given the range of firms grouped in a single BGS. In the late 1880s, for example, the Rhein Westphalian smelting and rolling mill BGS assigned plants employing 87 percent of its covered workers to the risk levels 35, 50, or 65.Footnote 28 This limited range probably reflects the fact that in the 1880s the BGSs did not yet have the long-term accident statistics required to assign individual establishments to specific risk levels. But lack of information was not the only problem. BGS boards found it difficult to assign realistic risks to sectors that were financially dominant within the group. Until 1918, for example, the Rhein-Westphalian engineering and small iron industry BGS clumped together three different types of machine-building factories. When the BGS finally split them up, they were in three different classes with very different risk levels, showing that the earlier assignments had been too crude.Footnote 29 In another example, the Rhein-Westphalian smelting and rolling mill BGS assigned two groups of firms, non-iron smelters and gun-drillers, to the same risk level of 35 in 1897. But the BGS's own data showed how different the two groups were. The non-iron smelters had a statistical risk figure of 25, and the gun drillers a figure of 56.Footnote 30
The law did allow a BGS to impose on an individual firm a higher or lower tariff than would be implied by the general tariff scheme. With the help of these surcharges or discounts the BGS could condition the relative contribution units (ci) on firm-level experience. Some BGSs formally adopted such provisions in their tariffs, but the practice was rare. Reluctance to use this approach reflected the perception that it would cause trouble with the affected firms, but not produce much in the way of change. The board of the BGS for precision and electrical engineering, for example, noted in 1909 that “we have not used increases or discounts to the standard risk levels […], because we lack sufficient grounds for them.”Footnote 31 Other BGS explicitly opposed the introduction or retention of such regulations. Faced with this passivity, the RVA increasingly pressed for more differentiated tariffs. One case illustrates this lengthy negotiation process. Until 1900, the Rhein-Westphalian smelting and rolling mill BGS's tariff had only six risk classes. That figure was increased to seven in 1900. Only in 1910 did the BGS shift to a structure with 33 risk classes, despite its growing database of accidents and the ability to construct a more differentiated tariff based on its own history. The RVA had long objected to the BGS's approach: for the tariff starting in 1900, the RVA wanted 26 (!) different classes. The BGS professed to understand the advantages of a greater number of groups, but still refused to implement this suggestion. As a compromise the RVA suggested an increase in the number of groups from 6 to 13. The BGS nevertheless rejected this suggestion.Footnote 32
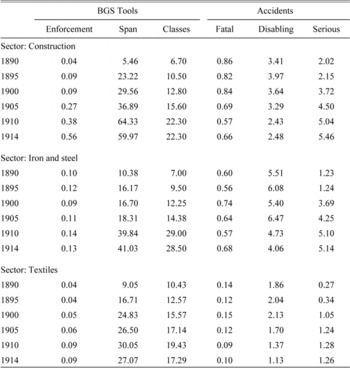
Table 3 summarizes the use of three important policy tools available to BGS in selected sectors.Footnote 33 (We report these three sectors because they figure heavily in the econometric analysis reported later). Table 3 also reports accident rates under the three definitions previously provided. The RVA's ongoing insistence eventually achieved success. BGS in some of the more dangerous industries were enthusiastic converts to the cause of more risk classes; between 1909 and 1915, the groups rose significantly in all iron and steel BGS, reaching 69 classes in the south German iron and steel BGS. The average steel BGS increased the number of risk classes four-fold in the period covered by our data. Creating more risk classes had two effects. First, by creating more groups a BGS ensured more homogeneity within each group. Second, by reducing the number of firms assigned to a group, the BGS gave each firm a greater impact on its own future contributions. Both effects linked a firm's financial contribution more tightly to its own record. The tariff also assigned a risk figure to each risk class. The number of risks classes would not matter at all if all classes were assigned the same risk figure. Some BGS initially did something close to that, as Table 3 shows. Over time, however, many BGS increased the differentiation in their risk system, increasing the figures assigned to the most dangerous activities. The construction BGS embraced this tool most enthusiastically, increasing the mean span ten-fold.
MEAN VALUES OF POLICY TOOLS AND ACCIDENT RATES FOR SELECTED BGS AND YEARS

Notes:
“Enforcement” is expenditure on factory inspectors, divided by the number of workers covered. “Span” and “classes” are properties of the tariff scheme in force in that period. “Span” is the ratio of the highest to the lowest risk figure. Accident rates are per thousand worker-years. See text and Online Appendix for additional definition and discussion
Source:
BGS database.
The BGS had a third tool at its disposal: it could issue and enforce rules requiring firms to adopt devices or production methods that reduced certain well-known risks. One important set of safety rules, for example, required covers on power-transmission belts and similar moving parts. The BGS could also appoint inspectors to verify that the rules were being followed, and to recommend fines against firms that did not comply.Footnote 34 The measure “Enforcement” reported in Table 3 is based on expenditure for factory inspectors. The RVA constantly stressed that industrial practice at the time offered opportunities for changes that would make the workplace safer. In a letter of June 1890, for example, the RVA claimed
It can be recognized from the accident statistics that almost a quarter of all serious accidents that are caused by machinery occur in connection with transmission belts and gears. In 269 cases, workers got caught in the belt and were injured. In 731 cases, workers ended up in the wheels gear, most of which lacked a cover. These figures suggest that it is in the interests of effective accident prevention to install belt boxes, wheels tops and belt and wheel railings, and simultaneously to adopt a rule whereby the production belts may be replaced only at slow speed or when the machine has been switched off.Footnote 35
Given the externalities implicit in the system of risk calculation, it is no surprise that individual firms ignored recommendations on safety practice. One can view the inspectors and fines as an effort to align the firm's interest with those of the BGS. Some BGS spent more and more money on enforcing the safety rules; Table 3 shows that the construction industry used this tool extensively. From 1900 to 1914, the expenditures on enforcement per thousand worker-years increased five-fold in that sector.
THE OUTCOMES: ACCIDENTS
So what was the net effect of the imperfect incentives implied by the risk tariffs, and the BGS's ability to write and enforce safety rules? The RVA's data divides accidents into several categories that reflect the accident's financial consequences. We re-work the RVA definitions slightly to compute the risk of fatal accidents; of accidents that cost the employee at least six months of work (disabling accidents); and of accidents that implied the employee was out of work for more than 13 weeks but less than six months (serious accidents). When we refer to “all serious accidents” we mean the sum of those three rates. The classifications reflect the consequences for the worker, and correspond (if imperfectly) to an accident's financial implications for the BGS. A worker who died without survivors could cost less than long-term support for a permanently disabled worker.
Figure 1 implies that the frequency of accidents of different types could move in opposite directions. Table 3 shows that disabling accidents became less common in those three sectors, while serious accident rates increased dramatically. This fact raises two questions. First, one could imagine employers or the BGS deliberately reporting accidents in the wrong category. This misreporting could reflect the firm's or BGS's interests, or pressure from workers. Whether this was an important problem we cannot say. All accidents had to be reported to the local police, and workers had the right to challenge the determination of the accident's severity. We report descriptive results for all three accident categories, but focus our econometric analysis on the fatal accidents that firms could not easily conceal or misrepresent.Footnote 36
Second, improvements in safety practices and rehabilitation therapies could shift the actual impact of a given accident from the “fatal” to the “disabling” category or from “disabling” to the “serious” category. To the extent this force underlies the patterns represented in our data, the increase in serious accidents reflects the system's success rather than its failure. To address this possibility, we regress one accident rate (e.g., fatal accidents) on other rates plus year and BGS fixed effects. (Online Appendix Table A.3 reports the results). The correlation between fatal and other accident rates is positive, so it seems unlikely that safety improvements saved some lives but left workers disabled. The relationship between disabling and serious accidents, on the other hand, is negative and has an elasticity of about 0.2. While statistically different from zero, this effect is too small to account for the rise of serious accidents from 0.48 to 4.24 from 1887 to 1914; the disabling accident rate fell in this period from 2.78 to 2.37. In the rest of this analysis we abstract from any causal relationship among the different types of accidents and focus on fatal accidents alone.
REGULATING FOR SAFETY
The BGS's diverse experiences suggest a close look at the determinants of accident rates within each BGS. We focus on the mechanisms the BGS could use to reduce accidents: the number of risk classes, the span of the risk levels assigned by the current tariff, and the amount the BGS spent to enforce its rules. Our general question can be framed as follows: Given the policy measures available to them under the law, could the BGS have reduced accidents from their actual levels by changing their tariffs as the RVA advised, or by increased enforcement? The first two variables are the key features of each tariff. The last, enforcement, we view as a proxy for the effort to use safety rules to reduce accidents. Our basic tool is a series of econometric models in which the dependent variable is the number of fatal accidents per thousand insured worker-years. Our observations are BGS-years. We always include year fixed effects to control for shocks common to all BGS (such as unobserved innovations in RVA policy or new technologies). We also use BGS-specific trends to control for unobserved changes in the composition of a BGS's members and their production techniques.Footnote 37 All specifications include the controls insured (the number of insured workers per BGS, a measure of size) as well as wages (the average wage per insured worker, a measure of the expected cost of an accident of a given severity).
The sum spent each year on factory safety inspectors (enforcement) is available from the RVA reports and thus we have it for all BGS-years. We normalize this variable by the number of covered workers. Two other policy variables require laborious extraction from archival reports. One is the number of classes in the BGS tariff (classes), reported for selected BGS in Table 3. The other is the range of risk levels (span). To reduce costs we did not collect classes and span for all BGS; we focused on sectors with a larger number of BGS because of the instrumenting strategy discussed later. The last column of Table 1 reports the availability of these measures in our data, and the Online Appendix Table A.4 reports descriptive statistics, dividing the BGS into those for which we have this information and those we do not. The overall sample has 1,943 BGS-years of observation; when using these two archival variables, we have 1,477 BGS-years of observation. Accident rates do not differ significantly between the two groups (BGS with information have a higher disabling accident rate, but the t-statistic is –1.449), but the BGS with tariff information have a lower average wage. The latter reflects the omission of some small but relatively highly-paid groups of workers such as in insurance (their average wage is 1,156 Marks per year, compared to the grand mean of 913 Marks per year). Most of the BGS for which we lack tariff information drop out of our estimation sub-samples for other reasons; several are the only BGS in a sector, and for others we have less than 10 years of data.
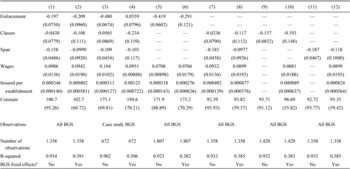
The BGS decided on the three policy variables, so we confront possible endogeneity in the econometric sense. The endogeneity could reflect simultaneity, if BGS facing higher accident costs took stronger measures to combat them. The endogeneity could also reflect unobserved heterogeneity, if the technologies in different sectors imply that the marginal cost of accident-prevention, and thus the optimal safety regime, differs across BGS in ways we do not observe. Table 4 reports pooled and fixed-effect (FE) estimates for fatal accidents without confronting the endogeneity issue. Columns (1) and (2) use all BGS for which we have the requisite variables. Columns (3) and (4) focus on the three sectors summarized in Table 3. Columns (5) through (12) report specifications that use only sub-sets of the three policy variables. The sample sizes vary across these models because of the missing information on classes and span for some BGS. In some cases, the estimates for the policy variables are either positive or effectively zero. In a well-functioning system we would expect all three policy variables to have a negative effect on accident rates.Footnote 38 The two controls wages and insured have similar effects across the models, and their effect is broadly invariant to the inclusion of the policy variables and to the use of the pooled or FE estimator. BGS whose workers are more highly-paid have higher accident rates. This result is consistent with the idea that labor markets price out risk in the form of higher wages in riskier settings, but we lack the wage data needed to precisely test for compensating differentials.Footnote 39 Murray and Nilson (Reference Murray and Nilson2007) show for the Austrian case that wage premia in more dangerous industries decreased after the introduction of an accident insurance in 1887 (see also Kim and Fishback (Reference Kim and Fishback1993) for the American case). Wage differentials and accident insurance were obviously (imperfect) substitutes.
POOLED AND FE REGRESSIONS FOR FATAL ACCIDENT RATES

Notes:
All regressions included year fixed effects and BGS-specific linear time trends. Number of observations is larger in (5) and (6) because information on span and classes are not available for all BGS. Robust standard errors in parenthesis.
Source:
Estimated from the BGS database.
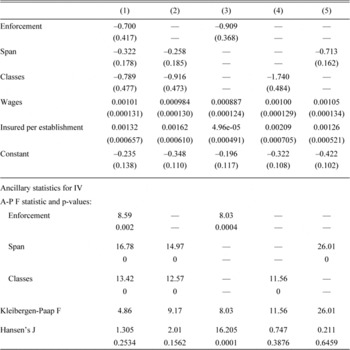
To address the problem of the endogenous policy variables we use an instrumental-variable (IV) approach. Table 5 reports IV models of accident rates for the three sectors reported in Table 3. We focus on these three sectors because of the instrumenting strategy; unfortunately, suitable instruments for all BGS are not available. We construct the instruments as the mean value of a variable for the other BGS in a given sector. Thus, for example, one instrument is the average value of the enforcement variable for all other BGS in the sector. The idea underlying these instruments is that the policy variables change in reaction to shocks common to all BGS in a sector. Violation of the exclusion restriction would require that the policy in one BGS affect accident rates in another, even controlling for BGS and year fixed effects and BGS-specific time trends. One might imagine technological spillovers across BGS within a sector that would possibly violate the exclusion restriction here, but it seems unlikely that could take a form that would escape the other controls. We use one instrument of this type for each of the endogenous policy variables. The fourth instrument is the average value of financial reserves held by other BGS in the sector in a given year. Violation of the exclusion restriction in this case would require that the wealth of other BGS in a sector directly affects accidents rates, which is even more implausible.
INSTRUMENTAL-VARIABLE ESTIMATES FOR FATAL ACCIDENT RATES

Note:
All models include BGS and year fixed effects as well as BGS-specific time trends. Model estimated by 2-step GMM. Standard errors are HAC with bandwidth = 2. The first-stage equations are reported in the Online Appendix.
Source:
BGS database.
Table 5 also reports diagnostics for weak instruments and identification problems. (All models in Table 5 have more excluded instruments than endogenous regressors.) The Angrist-Pischke F values suggest that the instruments are strong by any reasonable standard. With the exception of the restricted model reported in Column (3) the regressions also pass the tests for weak or under-identification. Column (1) presents a specification using all three endogenous variables. This model verges on heroic because it contains three endogenous variables. Comparison to the models reported in Columns (2) through (5) provides some reassurance; using only one or two of the endogenous variables at a time, the estimates for those differ somewhat in magnitude, but retain their negative sign. The models reported in Columns (4) and (5) differ the most from the full model in Column (1); since the classes and span variables are part of a common strategy embedded in a tariff, it makes less than complete sense to estimate models with one of those variables alone. Comparison to Table 4 shows that the IV estimates for the endogenous variables are “more negative.” The endogeneity bias in the Table 4 models masks the BGS's power to reduce accidents. The coefficients for all three estimates here are negative, as expected, and estimated tolerably precisely.
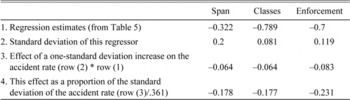
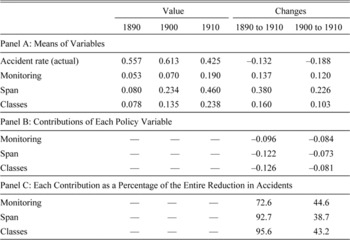
Tables 6 and 7 report a simple evaluation of these estimates. Using the model reported in Column (1) of Table 5, Table 6 demonstrates the effect of a one standard deviation increase in each of the three policy variables. A one-standard deviation increase in enforcement would by itself reduce accidents by about 0.23 standard deviations. Table 7 appeals to a slightly different counter-factual. Again using the estimates reported in Table 5, Column (1), we consider the implications of the policy variables for the changes in accident rates we observe over this period. We consider two sub-periods, from 1890–1910 (approximately the entire period) and from 1900 to 1910 (i.e., following the initial rise in accident rates). The observed increase in enforcement from 1890 to 1910, for example, implies an accident reduction equal to about 73 percent of the actual reduction over that period. Adding the analogous estimates for span and classes, we find that more extensive use of the policy variables implies a reduction in the accident rate from 1890 to 1910 equal to 260 percent of the actual reduction. This result illustrates the counter-factual nature of the system's partial success. If the policy variables had the same values in 1910 as in 1890, the accident rate would have risen dramatically, propelled by changing technologies and larger plant sizes. These evaluations imply that the BGS had available tools powerful enough to reduce the accident rate, but only used them enough to forestall what would have been increases in the accident rate propelled by larger plants and other forces. One reason contemporaries were disappointed with the system reflects the difficulty of imagining how much worse the situation would have been without it.Footnote 40
IMPLICATIONS OF THE IV ESTIMATES

Notes:
The standard deviation of the fatal accident rate is .361.
Source:
Table 5 and BGS database.
THE IMPLICATIONS OF BGS POLICY FOR THE DECLINE IN FATAL ACCIDENTS, 1890–1910

Notes:
The values in panel A are single-year figures from the database that underlies Table 5. The values in panel B multiply the regression estimates reported in Table 5, Column (1) by the corresponding changes reported in panel A. Panel C reports those contributions as percentages of the decline in accident rates. The contributions sum to more than 100 percent, implying that in the absence of the policy changes reflected in Panel A, accident rates would have increased.
Sources:
Table 5 and BGS database.
CONCLUSION
Germany's 1884 accident-insurance legislation forms a core piece of a larger system that eventually provided virtually the entire German population with economic security in the face of accidents, illness, or old age. The accident-insurance system effectively protected workers against the financial consequences of workplace mishaps. But in its first decades the system saw little success in reducing accidents. This experience reflects the difficulty of developing and applying new safety practices as well as the design flaws that made it difficult for the BGS to price firm-level risk appropriately.
Firms initially lacked strong incentives to reduce accidents for the institutional reasons we note. But low wages were another reason the workplace remained dangerous. Most of an accident's cost to the BGS was proportional to the workers' income. The average insured steel worker earned about 1,300 Marks in 1914. His BGS paid some 19 Marks per worker to the insurance fund, or about 1.5 Marks per hundred Marks paid in wages. Because the 1884 Act ruled out punitive damages, firms saw compensation for frequent accidents as a modest part of their total costs. The regulator, on the other hand, wanted lower accident rates that could only be achieved if firms invested in more safety-enhancing technology and practices. The firms' reluctance to do so reflects the meager cost of paying the damages associated with unsafe workplaces: low wages made accidents cheap.